
S&P 500: Elliott Wave and Technical Analysis | Charts – October 15, 2020
Three new short-term Elliott wave counts are considered today.
Summary: The invalidation point is moved up to 3,209.45.
The hourly chart expects a little more downwards movement to about 3,418.
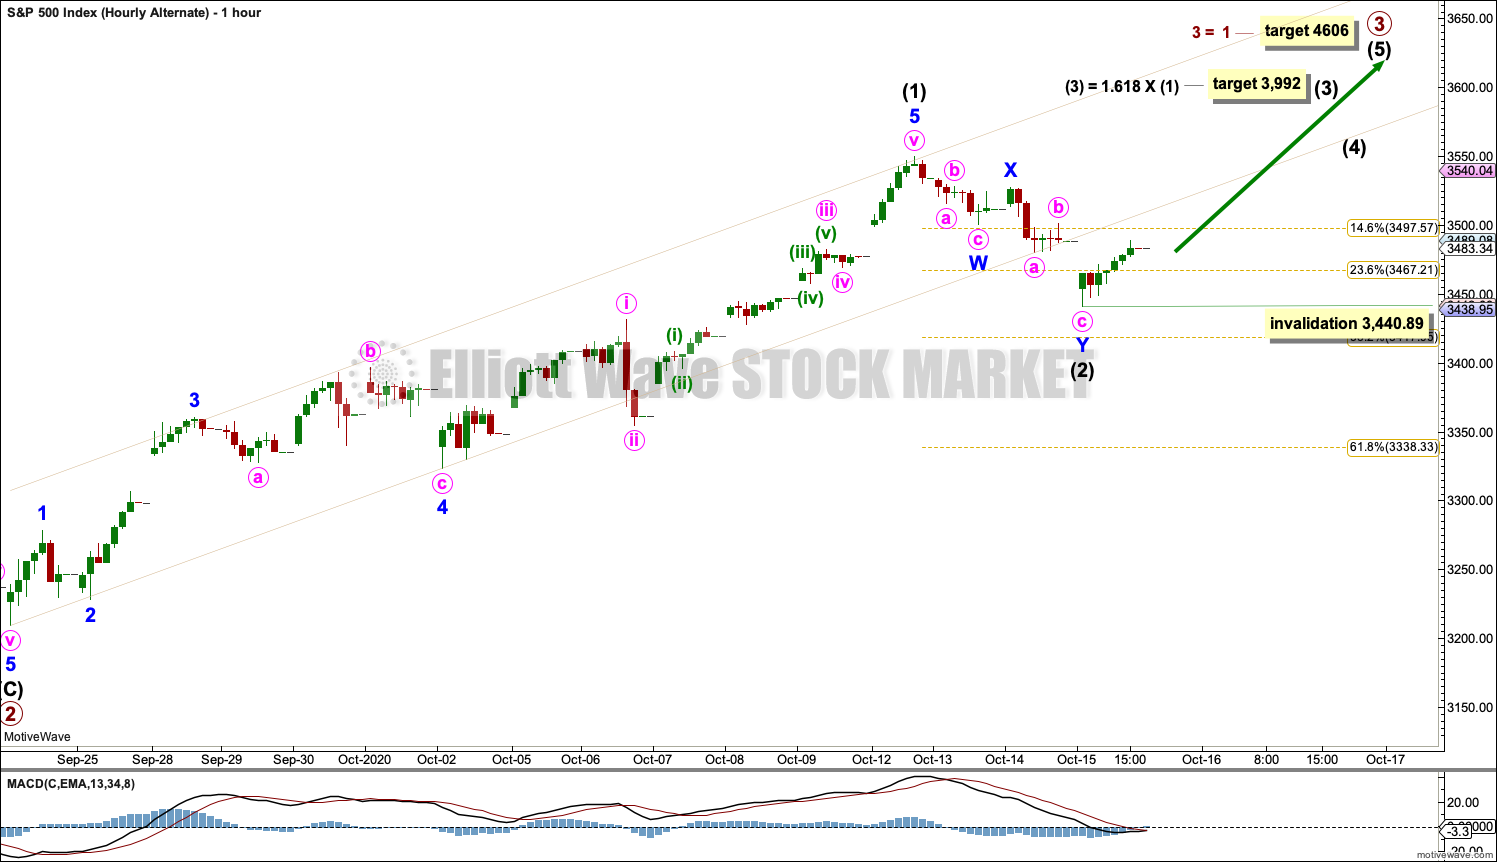
The alternate hourly chart considers the possibility that the pullback is over at today’s low. A target for a third wave up to end would be at 3,392 with the longer term target at 4,606. This alternate hourly chart may have a little more support today from classic technical analysis.
A second alternate hourly chart considers the possibility that intermediate wave (1) may be incomplete. A target for it to end is at 3,625.
At this stage, a new high above 3,588.11 would invalidate the second very bearish Elliott wave count, leaving only a bullish Elliott wave count.
The biggest picture, Grand Super Cycle analysis, is here.
Monthly charts are here, with video here.
ELLIOTT WAVE COUNTS
FIRST WAVE COUNT
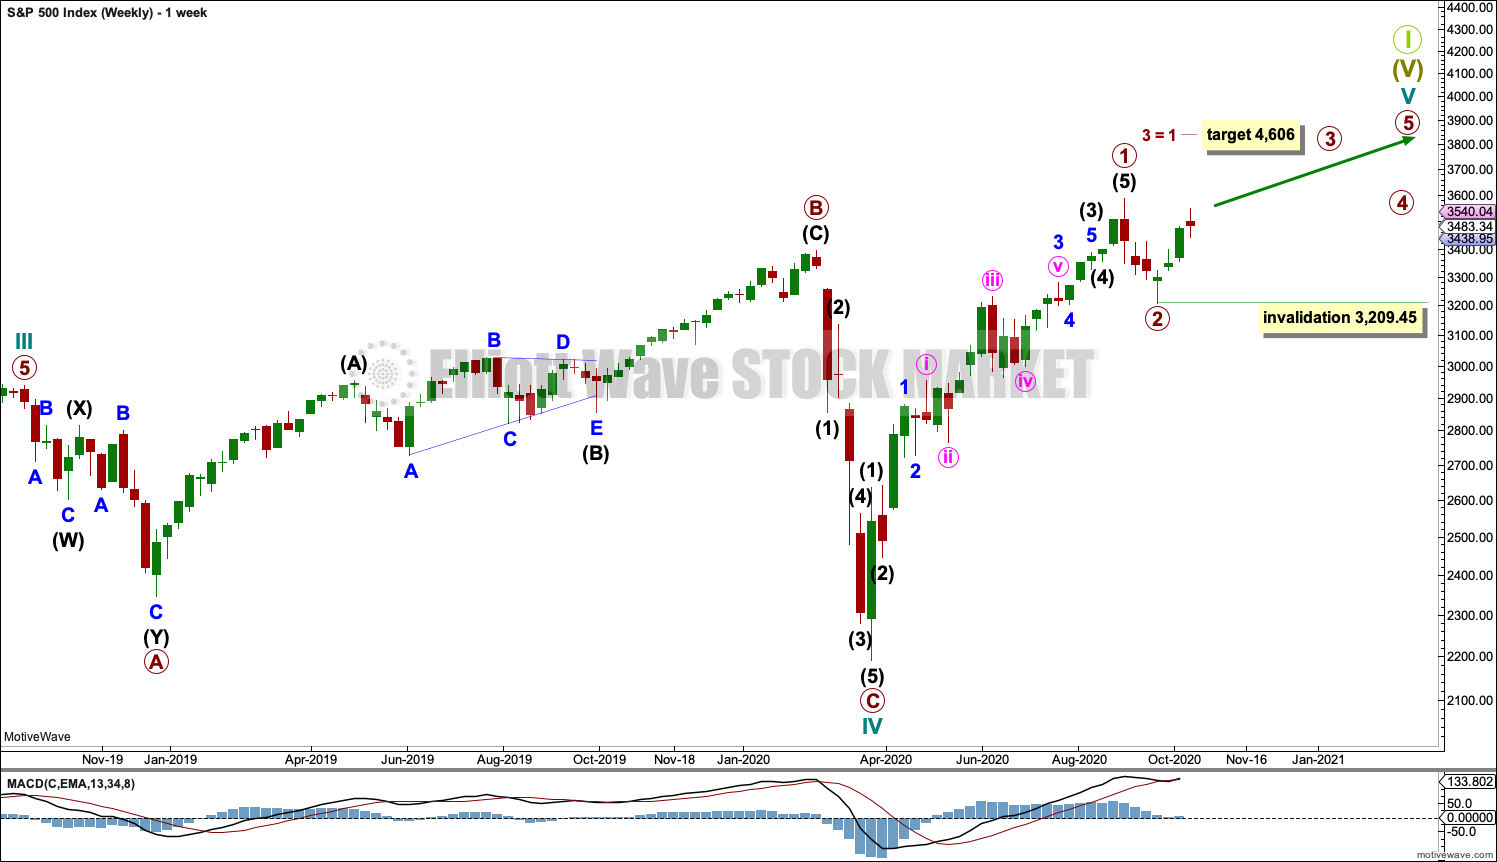
WEEKLY CHART
Click chart to enlarge.
Cycle wave V may last from one to several years. So far it is in its seventh month.
Cycle wave V would most likely subdivide as an impulse. But if overlapping develops, then an ending diagonal should be considered. This chart considers the more common impulse.
Primary waves 1 and 2 may be complete.
Primary wave 3 may have begun. It may only subdivide as an impulse. Intermediate wave (2) within primary wave 3 may not move beyond the start of intermediate wave (1) below 3,209.45.
There is already a Fibonacci ratio between cycle waves I and III within Super Cycle wave (V). The S&P500 often exhibits a Fibonacci ratio between two of its actionary waves but rarely between all three; it is less likely that cycle wave V would exhibit a Fibonacci ratio. The target for Super Cycle wave (V) to end would best be calculated at primary degree, but that cannot be done until all of primary waves 1, 2, 3 and 4 are complete.
DAILY CHART
Click chart to enlarge.
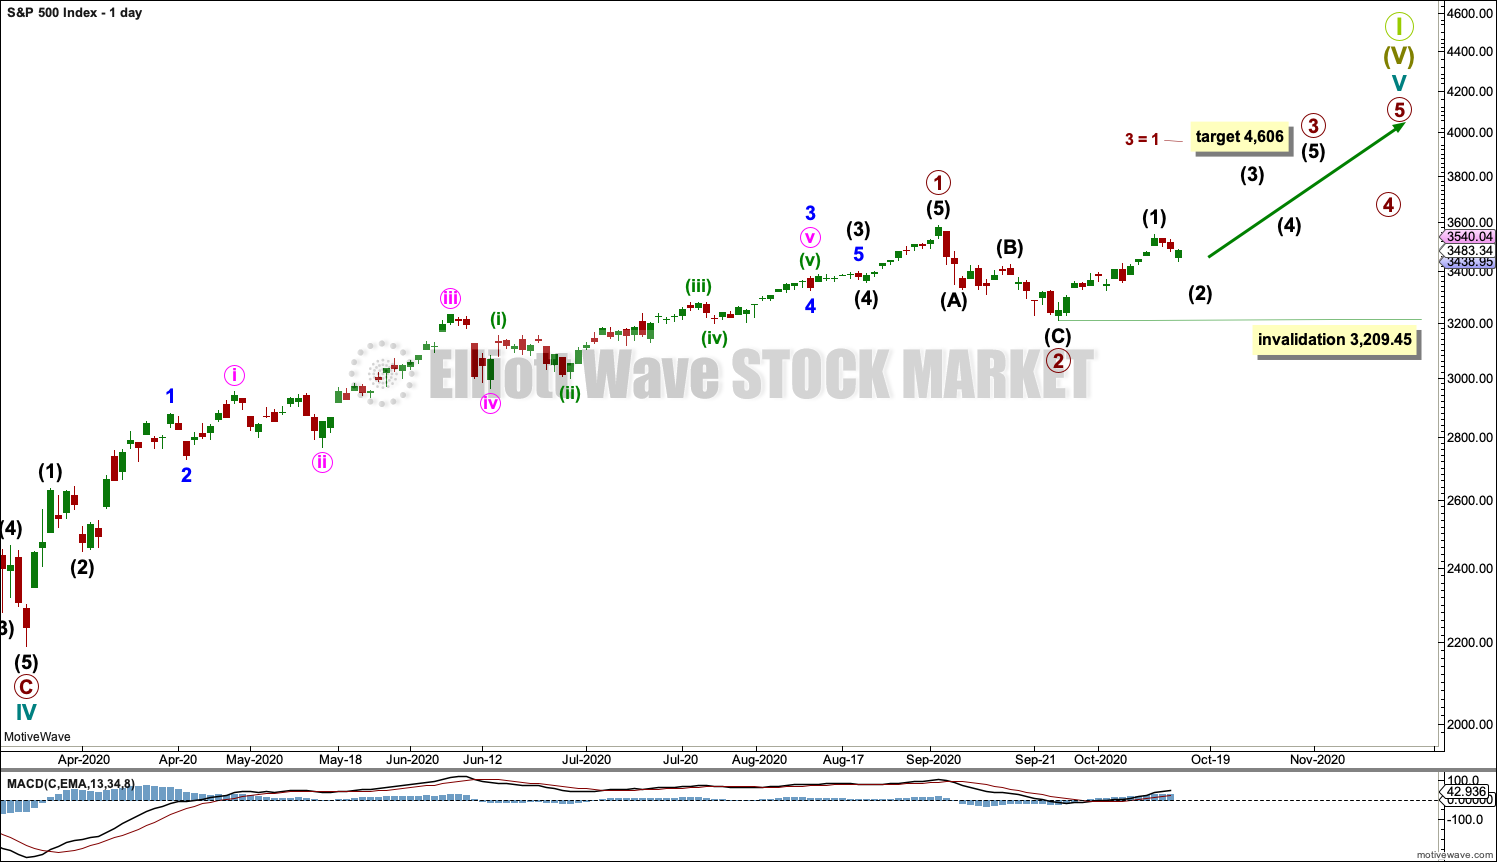
Primary waves 1 and 2 may both be complete. Primary wave 3 may now be underway.
Primary wave 3 may only subdivide as an impulse. Intermediate wave (2) within primary wave 3 may not move beyond the start of intermediate wave (1) below 3,209.45.
Primary wave 1 looks extended. The target for primary wave 3 expects it to also be extended.
HOURLY CHART
Click chart to enlarge.
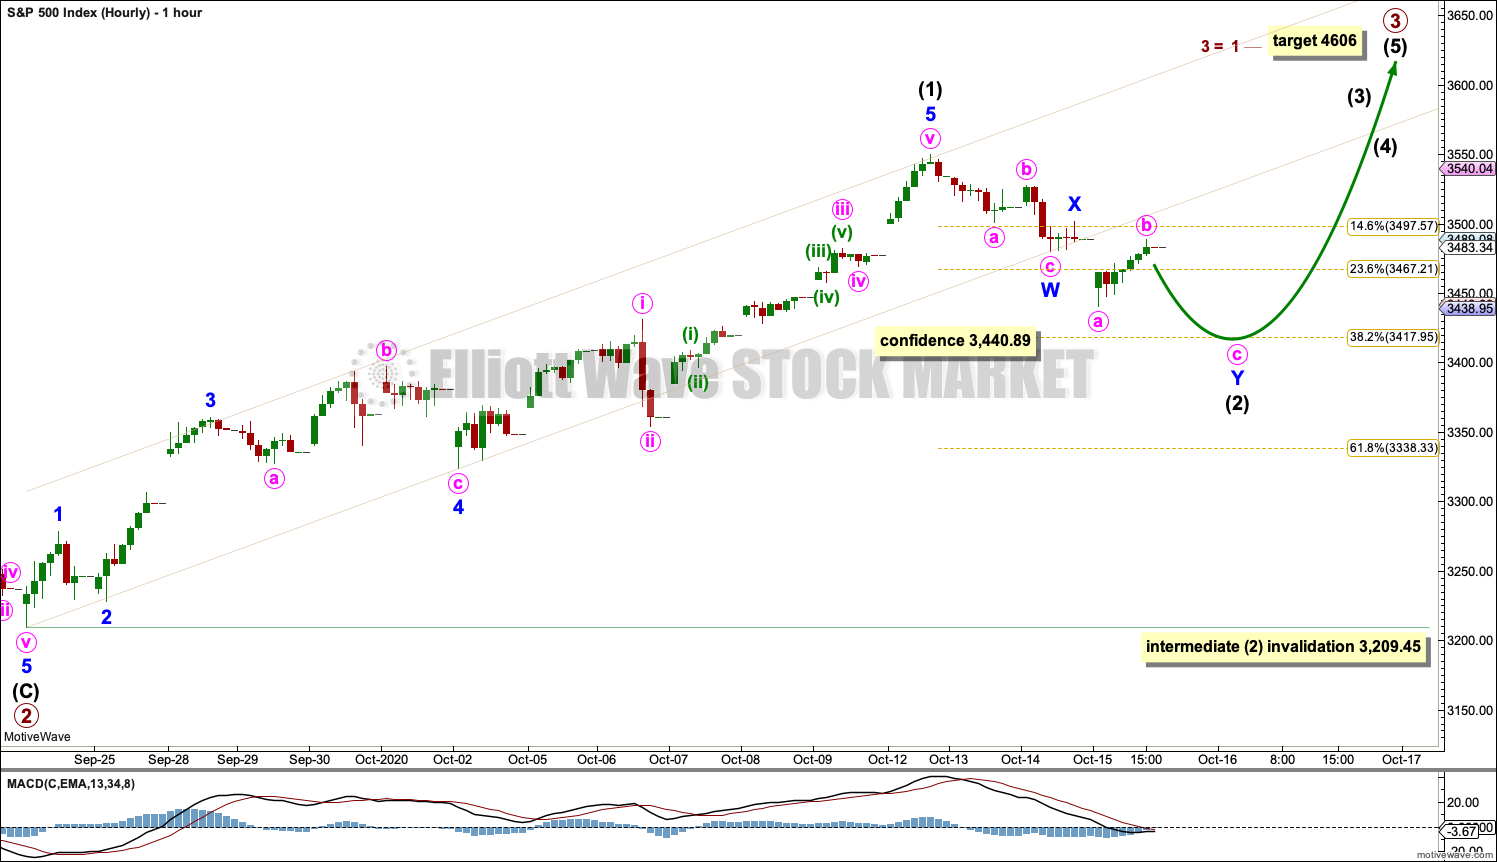
It is possible that intermediate wave (1) within primary wave 3 may be over.
Intermediate wave (2) may continue a little lower as a double zigzag. The target for intermediate wave (2) may be the 0.382 Fibonacci ratio about 3,418.
Intermediate wave (2) may not move beyond the start of intermediate wave (1) below 3,209.45.
ALTERNATE HOURLY CHART
Click chart to enlarge.
It is also possible today that both intermediate waves (1) and (2) may be complete. Intermediate wave (2) may be a relatively brief and shallow double zigzag.
This wave count expects a third wave up at two large degrees may have just begun. It should exhibit strength with rising momentum and some support from volume.
No second wave correction within intermediate wave (3) may move beyond its start below 3,440.89.
SECOND ALTERNATE HOURLY CHART
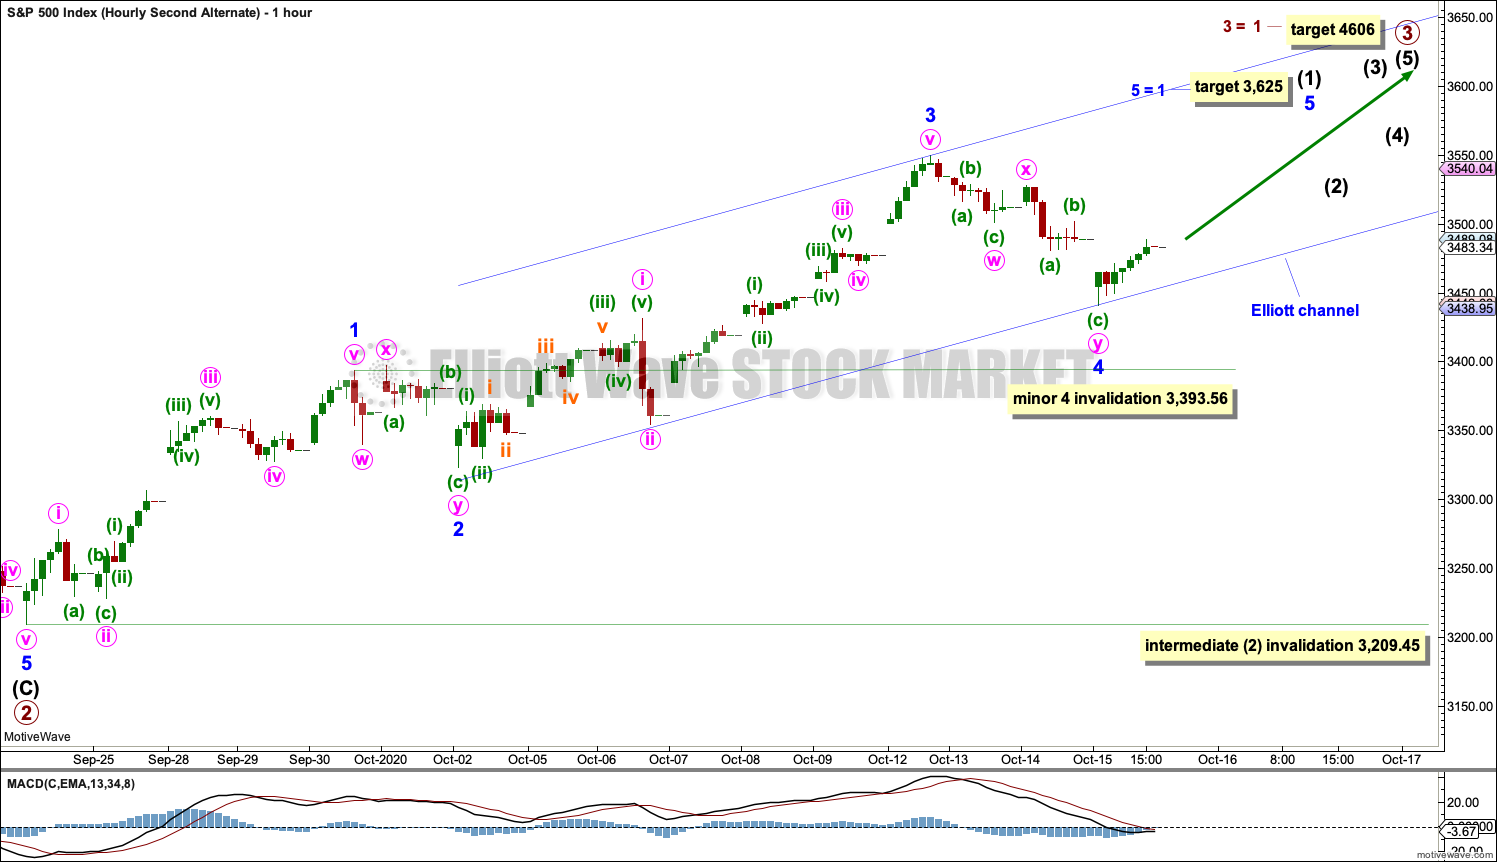
Click chart to enlarge.
It is also possible that intermediate wave (1) may be incomplete. This wave count has the best look in Elliott wave terms.
The channel about intermediate wave (1) is drawn using Elliott’s second technique: draw the first trend line from the ends of minor waves 2 to 4, then place a parallel copy on the end of minor wave 3. Minor wave 5 may end mid way within the channel. The target for minor wave 5 expects it to exhibit the most common Fibonacci ratio for a fifth wave.
Minor wave 4 may not move into minor wave 1 price territory below 3,393.56.
SECOND WAVE COUNT
DAILY CHART
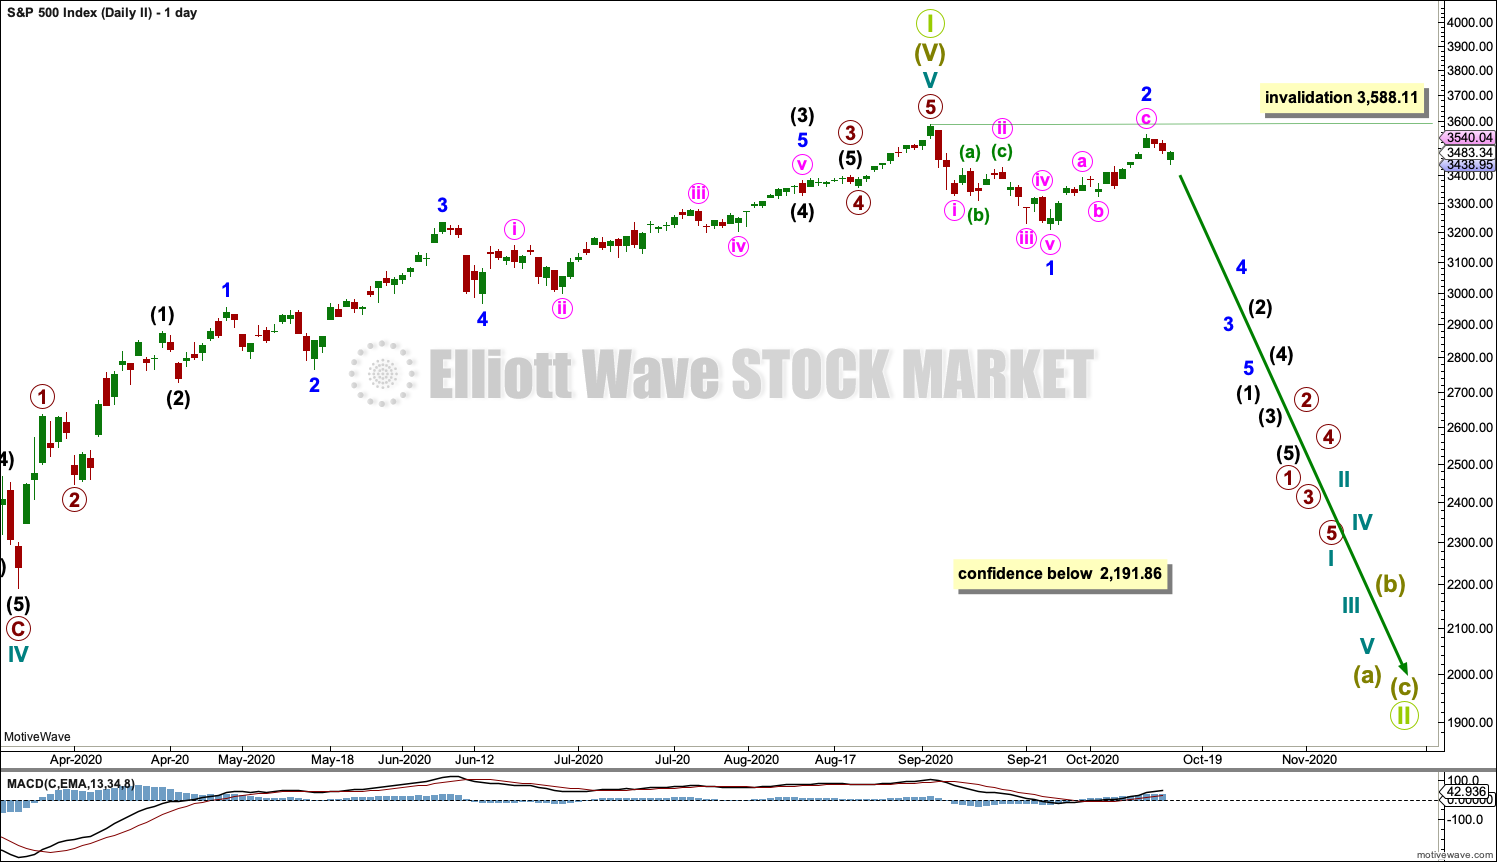
Click chart to enlarge.
This wave count is the same as the first wave count with the exception of the degree of labelling within cycle wave V. If the degree of labelling is moved up one degree, then it is possible that cycle wave V to end Super cycle wave (V) to end Grand Super Cycle wave I is complete.
A new low below 2,191.86 would add confidence in this wave count. At that stage, the first wave count would be invalidated.
A new bear market at Grand Super Cycle degree may be expected to last over a decade. It may take price below the start of Super Cycle wave (V) at 666.79 in March 2009.
A first five down, labelled minor wave 1, may be complete. Minor wave 2 now also may be complete. A third wave down at minor degree may just have begun. It should exhibit strength if this wave count is correct. So far it has not. This wave count does not have support from technical analysis.
Major new downwards trends for this market usually begin with strength. The lack of any 90% down days or back to back 80% down days reduces the probability of this wave count. Now with the AD line making a new all time high and two back to back 80% upwards days the probability of this wave count has reduced further.
HOURLY CHART
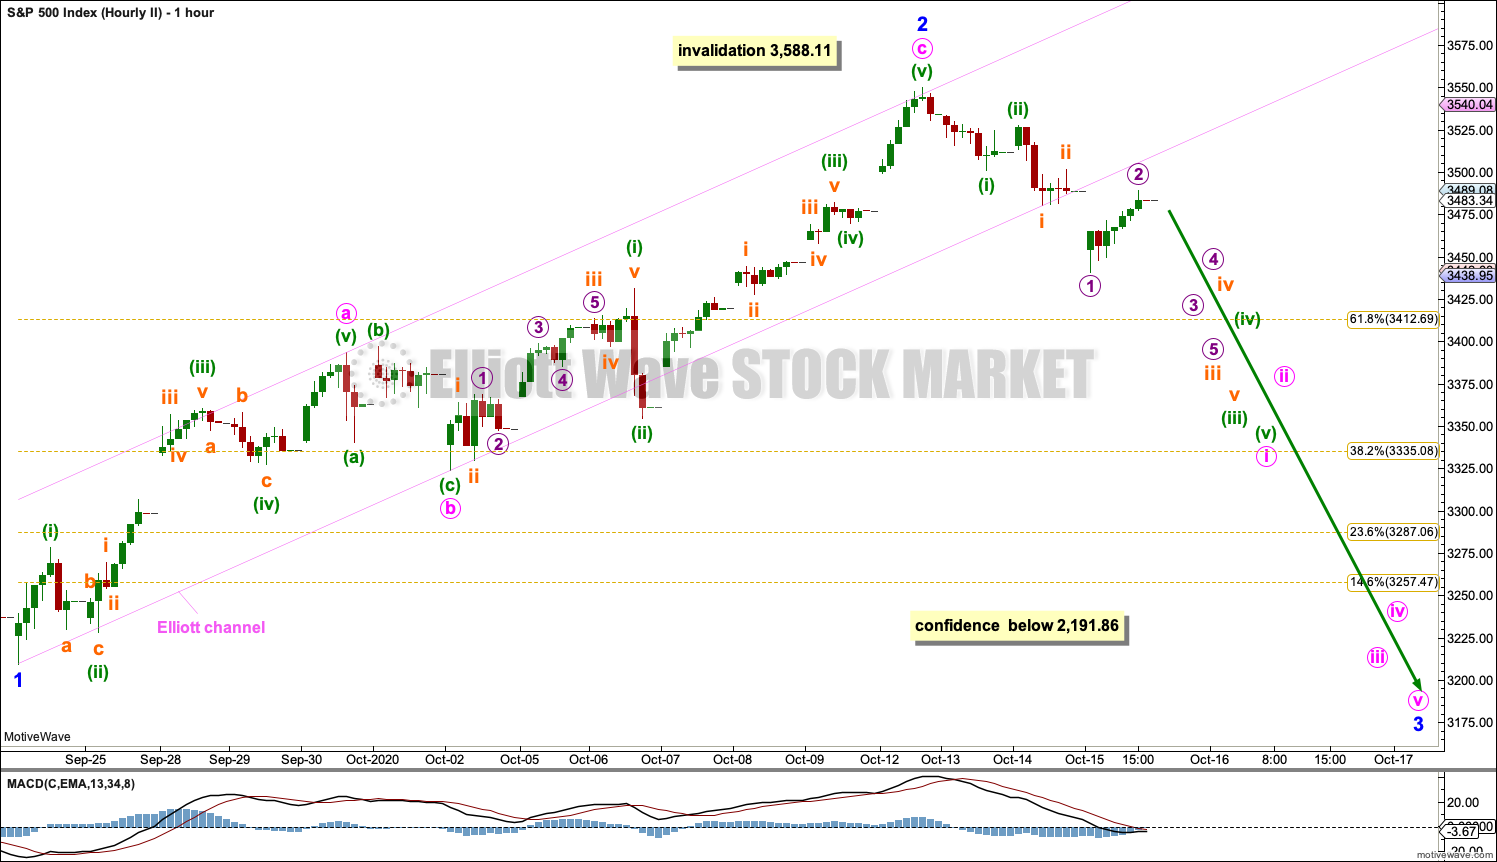
Click chart to enlarge.
Minor wave 2 may be a complete zigzag.
If it continues higher as a double zigzag, then minor wave 2 may not move beyond the start of minor wave 1 above 3,588.11.
TECHNICAL ANALYSIS
WEEKLY CHART
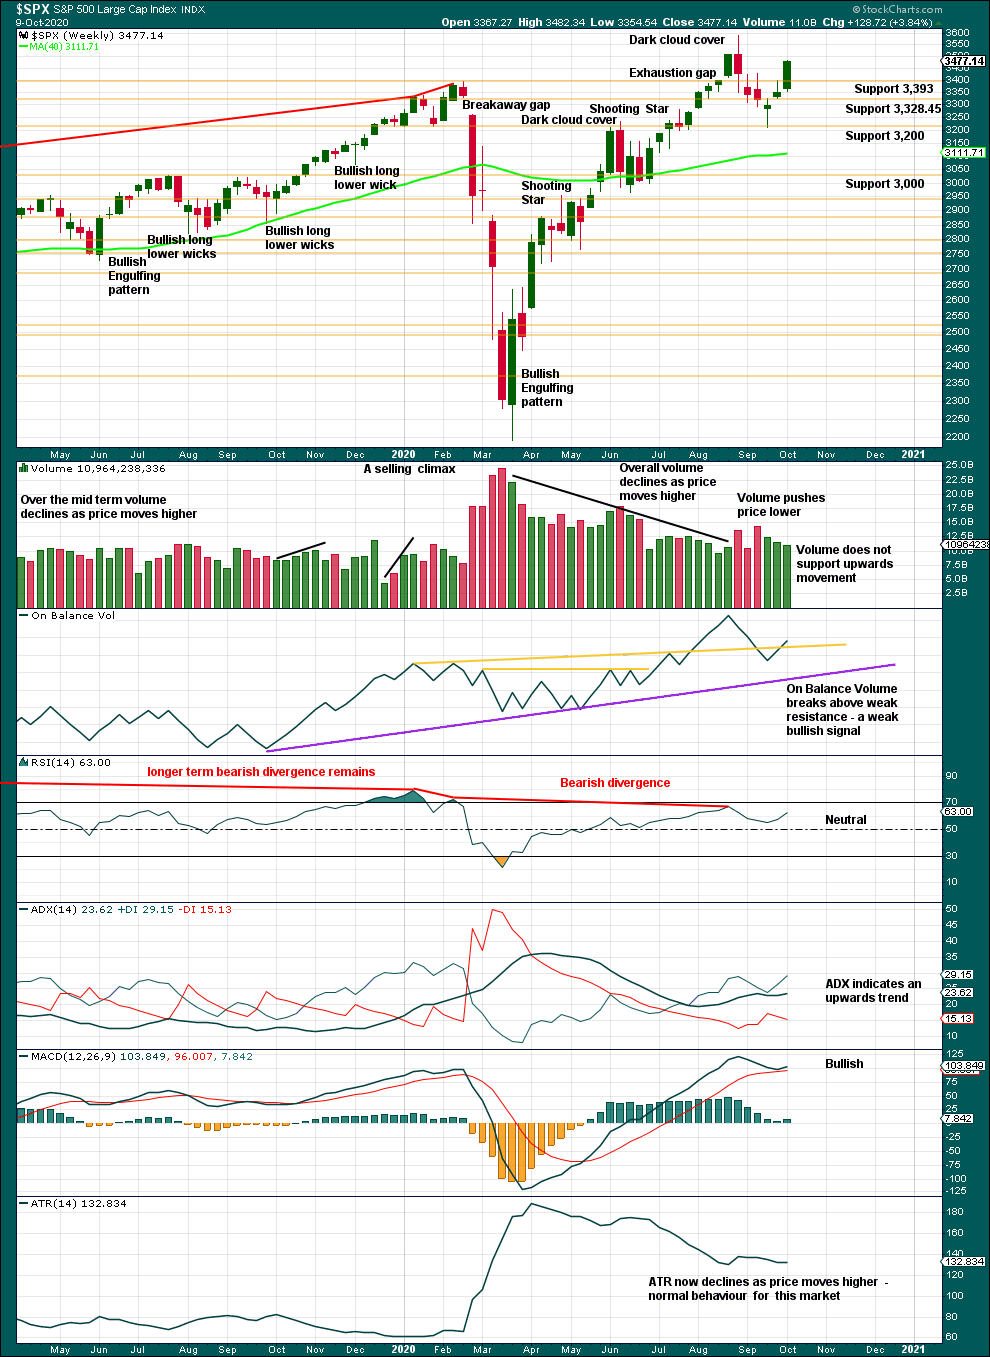
Click chart to enlarge. Chart courtesy of StockCharts.com.
Last week price closes near highs for the week. Range has increased. This suggests more upwards movement this week.
DAILY CHART
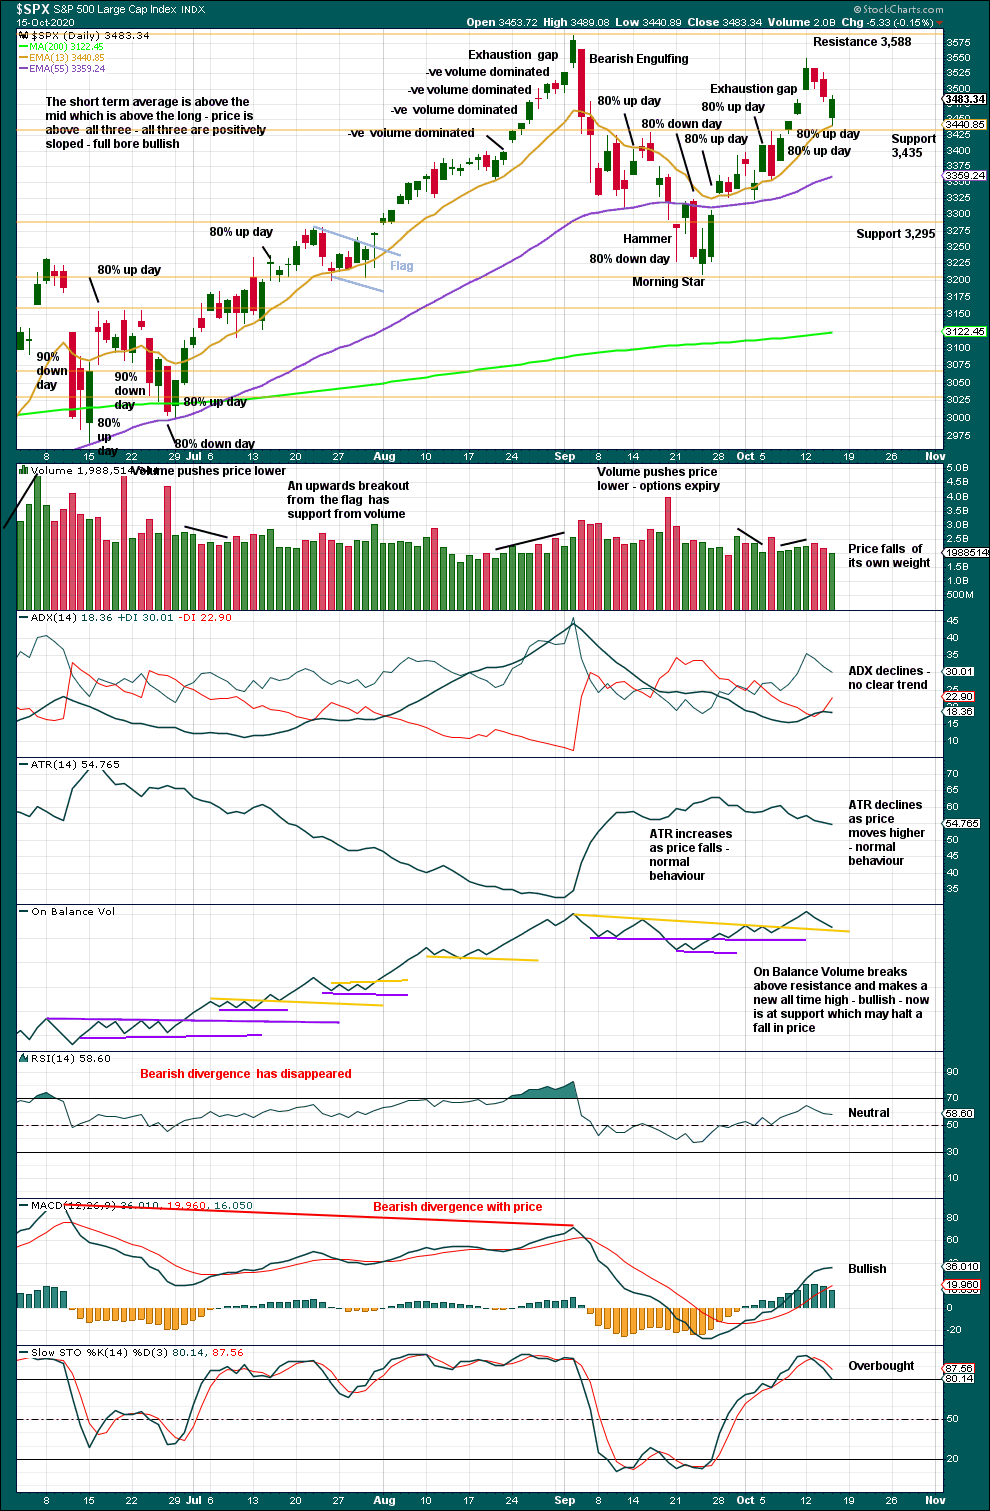
Click chart to enlarge. Chart courtesy of StockCharts.com.
There are now two back to back 80% upwards days.
The bullish signal from On Balance Volume has reasonable technical significance because the trend line breached had four tests and was reasonably long held and close to horizontal. On Balance Volume gives another bullish signal as it makes a new all time high.
ADX gives a strong bullish signal.
New all time highs may be close by.
Price today bounced up just above support about 3,235. The opening gap was closed by the end of the session. Up volume dominated the session at 62% of total up / down volume, but volume declined and did not support upwards movement within the session. Overall, this chart is mixed, but may slightly favour the first alternate hourly chart that expects the pullback may be over at today’s low.
BREADTH – AD LINE
WEEKLY CHART

Click chart to enlarge. Chart courtesy of StockCharts.com. So that colour blind members are included, bearish signals will be noted with blue and bullish signals with yellow.
Breadth should be read as a leading indicator.
Lowry’s Operating Companies Only AD line has still not made new all time highs, but at the end of last week it is very close. The last high for the OCO AD line was in the week beginning January 13, 2020. There was 7 and a half months of bearish divergence between price and the OCO AD line at the September high.
The NYSE All Issues AD line made new highs last week. This divergence is bullish.
Large caps all time high: 3,588.11 on September 2, 2020.
Mid caps all time high: 2,109.43 on February 20, 2020.
Small caps all time high: 1,100.58 on August 27, 2018.
This rise has been led by large caps, which is a feature of an aged bull market. Above the swing high of the 11th of August, large caps first made a new high now followed by mid caps. Small caps have not yet made a new high above this point.
DAILY CHART
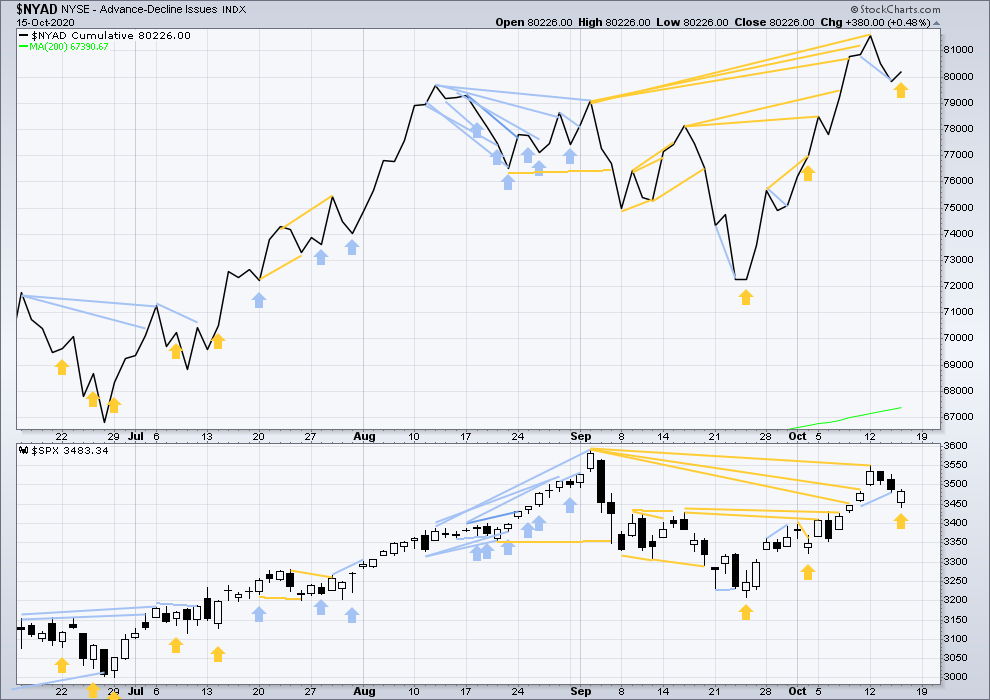
Click chart to enlarge. Chart courtesy of StockCharts.com. So that colour blind members are included, bearish signals will be noted with blue and bullish signals with yellow.
Today price has moved lower, but the AD line has moved higher. This is a single day instance of bullish divergence.
The OCO AD line will be watched carefully. If that too makes a new all time high, then that would be a very bullish signal; it has not done so yet, but it is very close.
VOLATILITY – INVERTED VIX CHART
WEEKLY CHART
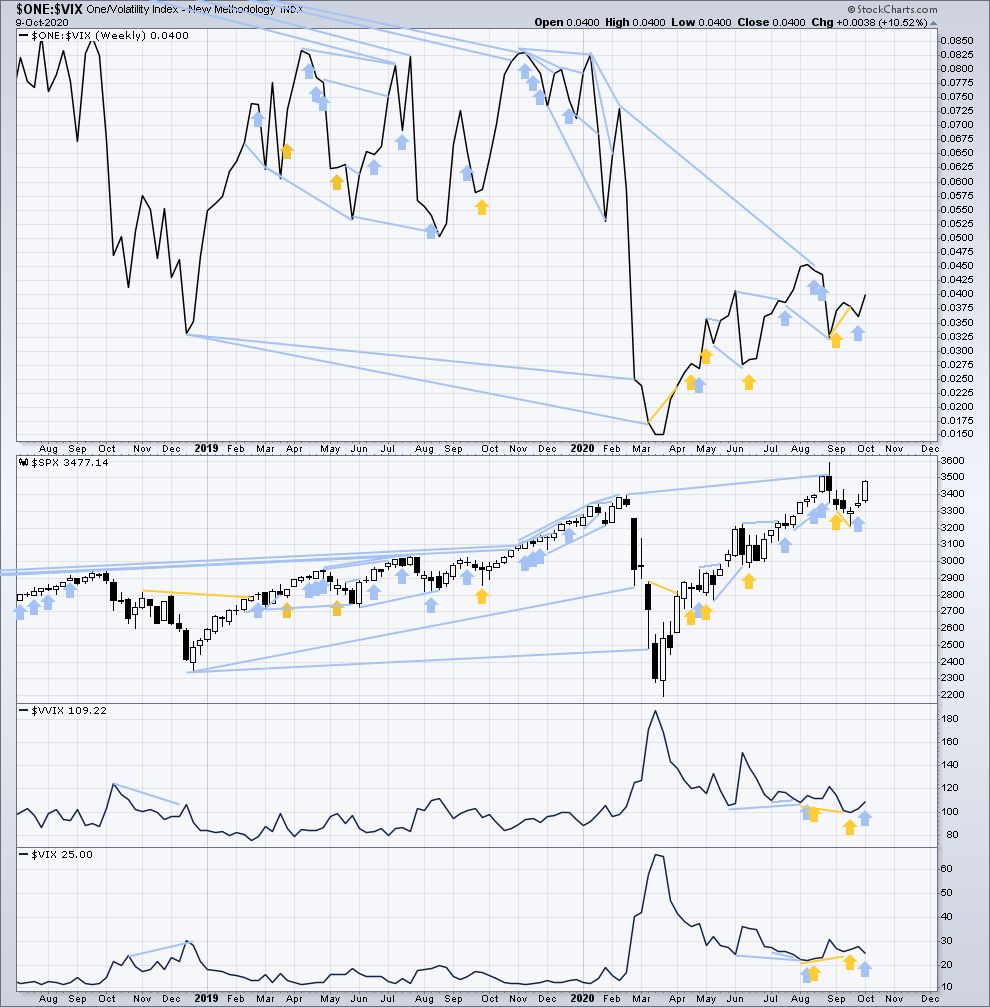
Click chart to enlarge. Chart courtesy of StockCharts.com. So that colour blind members are included, bearish signals will be noted with blue and bullish signals with yellow.
Inverted VIX remains well below all time highs. The all time high for inverted VIX was in the week beginning October 30, 2017. There is nearly 3 years of bearish divergence between price and inverted VIX. There is all of long, mid and short-term bearish divergence.
Last week both price and inverted VIX have moved higher. There is no new divergence.
Comparing VIX and VVIX: Last week VIX has moved lower, but VVIX has moved higher. This divergence is bearish for the short term. If a cluster of bearish signals develops, then that may warn of a deeper pullback.
DAILY CHART
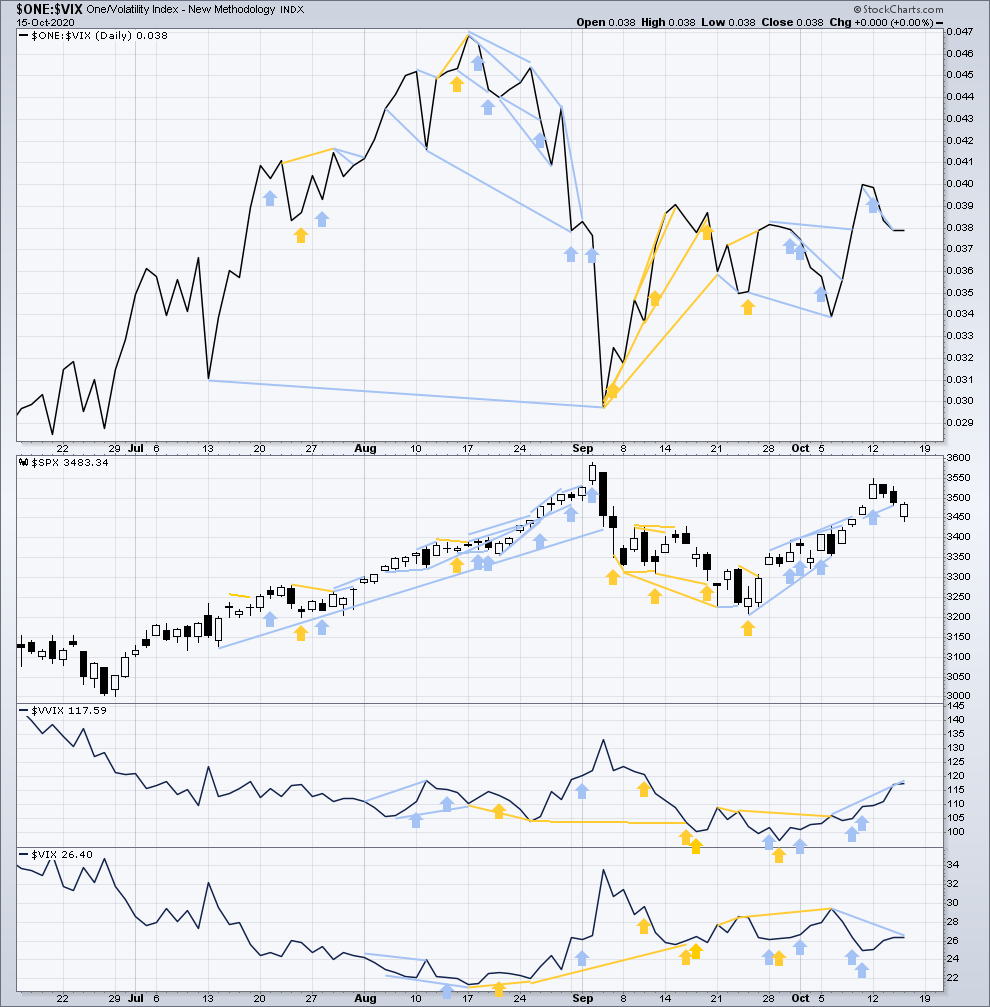
Click chart to enlarge. Chart courtesy of StockCharts.com. So that colour blind members are included, bearish signals will be noted with blue and bullish signals with yellow.
Bearish divergence has been followed by more downwards movement, so it may now be resolved.
Today price has moved lower, but inverted VIX is flat. This is not considered divergence.
Comparing VIX and VVIX at the daily chart level: VVIX has made a new short-term high above the prior high of the 6th of October, but VIX has not. This divergence is bearish for price for the short term. It suggests VIX has rising volatility, which normally corresponds with bearish moves for the S&P.
DOW THEORY
Dow Theory still concludes a bear market is in place.
Dow Theory confirmed a bear market with the following lows made on a closing basis:
DJIA: 21,712.53 – a close below this point was been made on the March 12, 2020.
DJT: 8,636.79 – a close below this point was been made on March 9, 2020.
Adding in the S&P and Nasdaq for an extended Dow Theory, a bear market was confirmed:
S&P500: 2,346.58 – a close below this point was made on March 20, 2020.
Nasdaq: 7,292.22 – a close below this point was made on the March 12, 2020.
At this time, to shift Dow Theory from viewing a bear market to confirmation of a new bull market would require new highs made on a closing basis:
DJIA: 29,568.57
DJT: 11,623.58 – closed above on 7th October 2020.
Adding in the S&P and Nasdaq for an extended Dow Theory, confirmation of a bull market would require new highs made on a closing basis:
S&P500: 3,393.52 – closed above on 21st August 2020.
Nasdaq: 9,838.37 – closed above on June 8, 2020.
Published @ 07:53 p.m. ET.
—
Careful risk management protects your trading account(s).
Follow my two Golden Rules:
1. Always trade with stops.
2. Risk only 1-5% of equity on any one trade.
—
New updates to this analysis are in bold.