
S&P 500: Elliott Wave and Technical Analysis | Charts – October 26, 2020
Downwards movement was not expected by the main Elliott wave count, but it was for an alternate. Price remains above the invalidation point for the main Elliott wave count, so both counts remain valid.
Summary: The invalidation point is moved up to 3,209.45.
The upwards trend may resume. The next target is at 4,606. The channel on the hourly chart must be breached and a new high above 3,465.60 must be seen for confidence in this view.
New all time highs for market breadth in both the NYSE all issues AD line and Lowry’s Operating Companies Only AD line support a bullish Elliott wave count.
At this stage, a new high above 3,588.11 would invalidate the second very bearish Elliott wave count, leaving only a bullish Elliott wave count.
The biggest picture, Grand Super Cycle analysis, is here.
Monthly charts are here, with video here.
ELLIOTT WAVE COUNTS
FIRST WAVE COUNT
WEEKLY CHART
Click chart to enlarge.
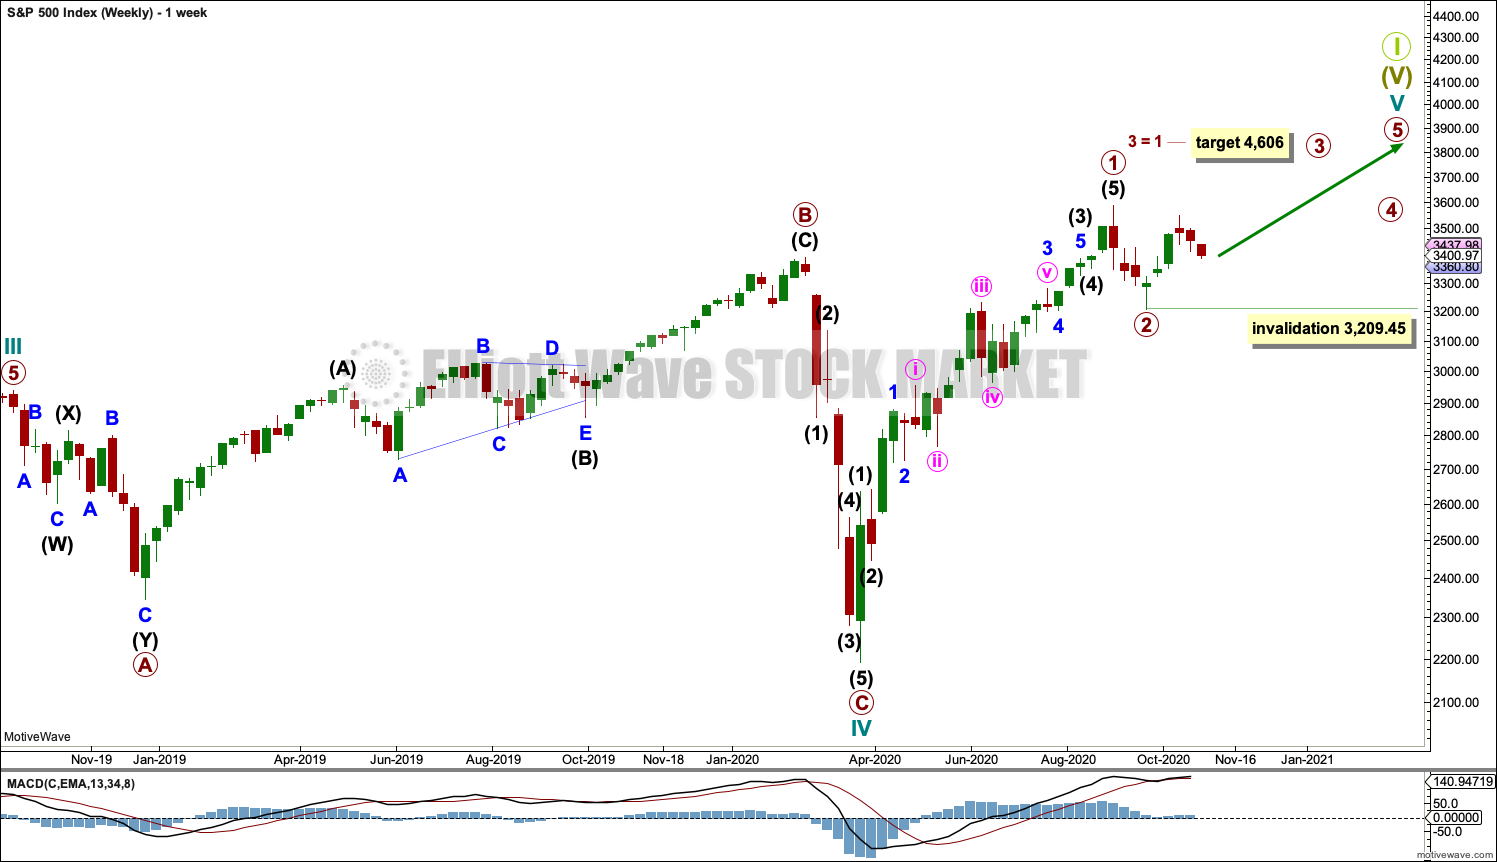
Cycle wave V may last from one to several years. So far it is in its seventh month.
Cycle wave V would most likely subdivide as an impulse. But if overlapping develops, then an ending diagonal should be considered. This chart considers the more common impulse.
Primary waves 1 and 2 may be complete.
Primary wave 3 may have begun. It may only subdivide as an impulse. Intermediate wave (2) within primary wave 3 may not move beyond the start of intermediate wave (1) below 3,209.45.
There is already a Fibonacci ratio between cycle waves I and III within Super Cycle wave (V). The S&P500 often exhibits a Fibonacci ratio between two of its actionary waves but rarely between all three; it is less likely that cycle wave V would exhibit a Fibonacci ratio. The target for Super Cycle wave (V) to end would best be calculated at primary degree, but that cannot be done until all of primary waves 1, 2, 3 and 4 are complete.
DAILY CHART
Click chart to enlarge.
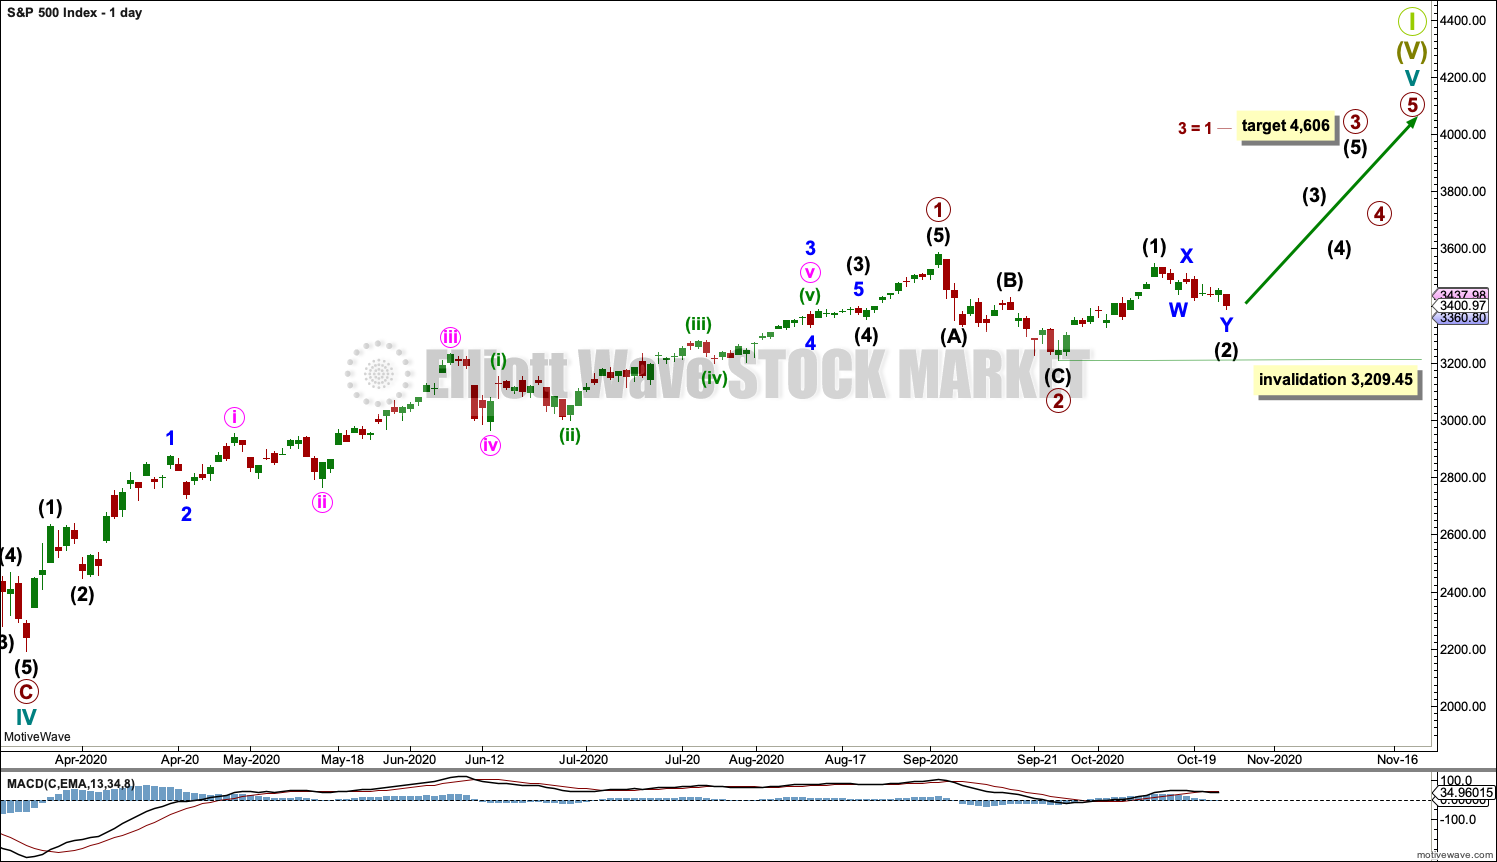
Primary waves 1 and 2 may both be complete. Primary wave 3 may now be underway.
Primary wave 3 may only subdivide as an impulse. Intermediate wave (2) within primary wave 3 may not move beyond the start of intermediate wave (1) below 3,209.45.
Primary wave 1 looks extended. The target for primary wave 3 expects it to also be extended.
HOURLY CHART
Click chart to enlarge.
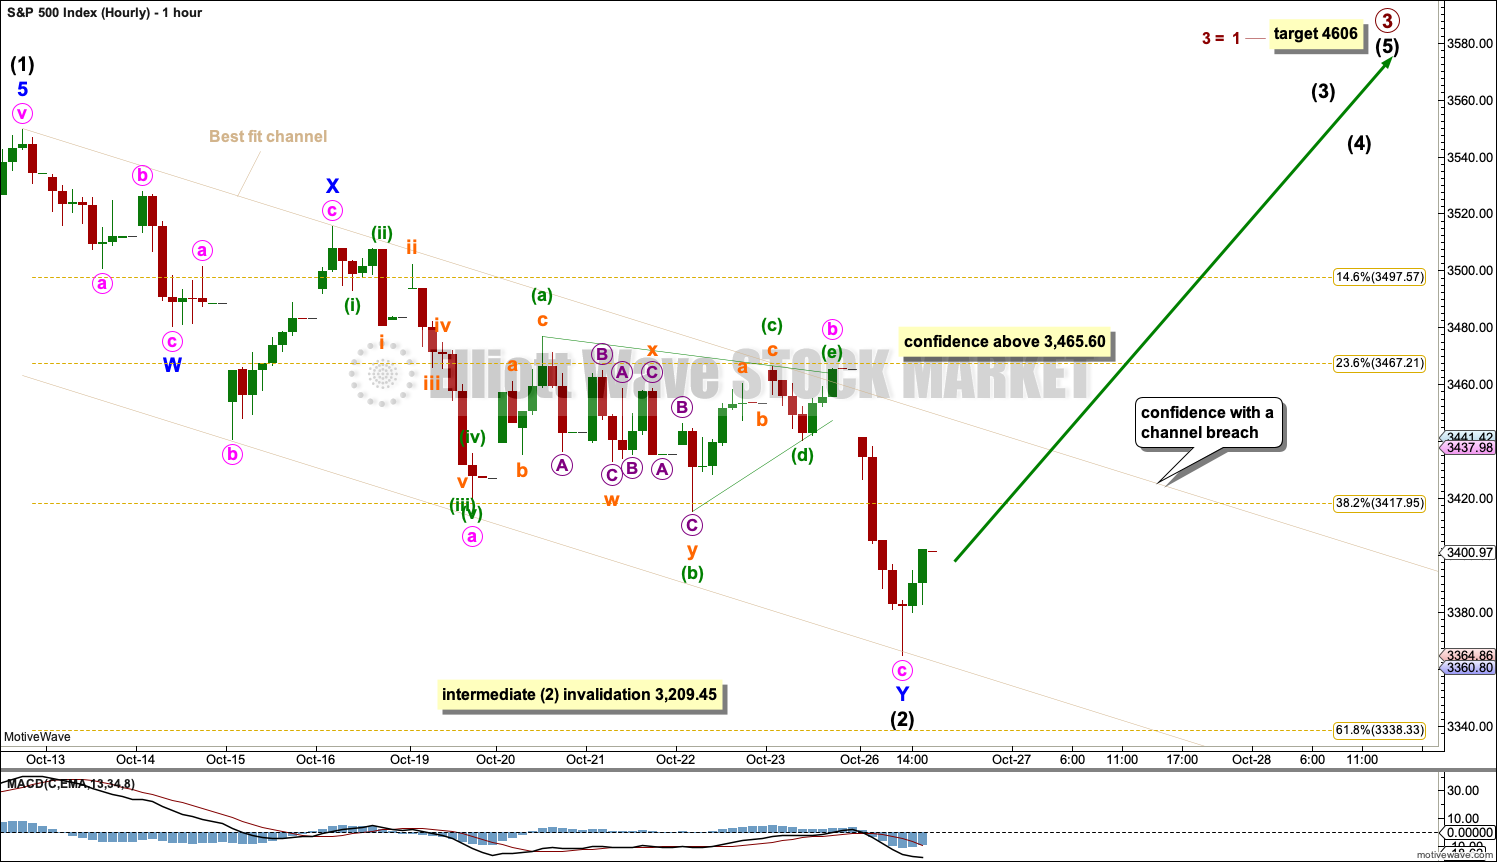
Intermediate wave (2) may be complete as a double zigzag, which moved lower today to find support at the lower edge of the channel.
It is also possible that minute wave c of minor wave Y of intermediate wave (2) may continue lower. The invalidation point must remain at 3,209.45 to allow for this possibility.
When the best fit channel is properly breached by a full candlestick of upwards movement above and not touching the upper edge, then that may offer confidence that intermediate wave (2) should be over and intermediate wave (3) should be underway. At that stage, the invalidation point may be moved up to the start of intermediate wave (3).
A new high above 3,465.60 would be a new high above the start of minute wave c. This could not be a second wave correction within minute wave c, so minute wave c would have to be over. This would add confidence that a low should be in place.
SECOND WAVE COUNT
DAILY CHART
Click chart to enlarge.
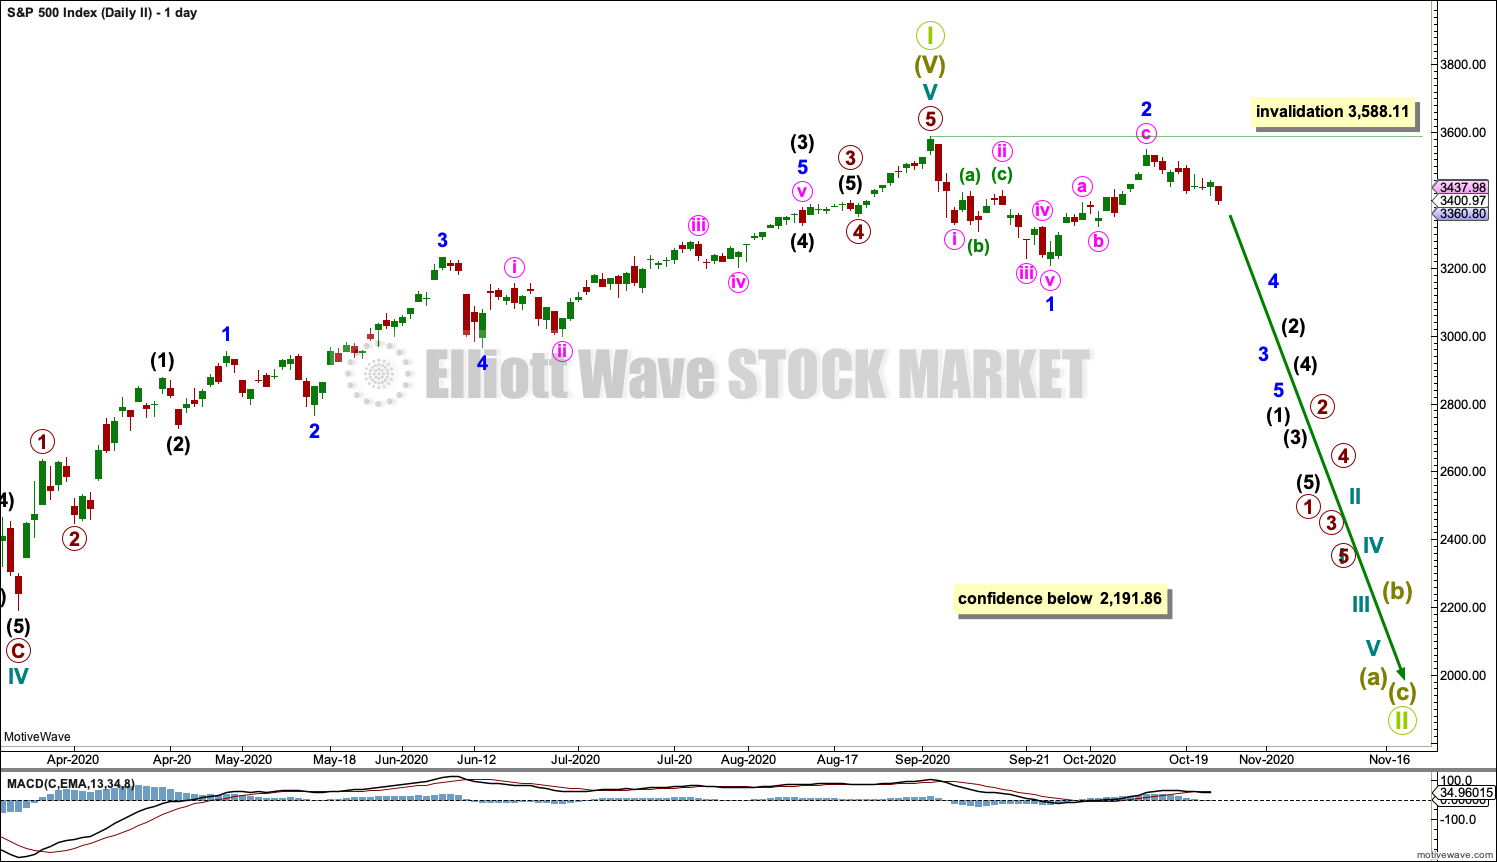
This wave count is the same as the first wave count with the exception of the degree of labelling within cycle wave V. If the degree of labelling is moved up one degree, then it is possible that cycle wave V to end Super cycle wave (V) to end Grand Super Cycle wave I is complete.
A new low below 2,191.86 would add confidence in this wave count. At that stage, the first wave count would be invalidated.
A new bear market at Grand Super Cycle degree may be expected to last over a decade. It may take price below the start of Super Cycle wave (V) at 666.79 in March 2009.
A first five down, labelled minor wave 1, may be complete. Minor wave 2 now also may be complete. A third wave down at minor degree may just have begun. It should exhibit strength if this wave count is correct. So far it has not. This wave count does not have support from technical analysis.
Major new downwards trends for this market usually begin with strength. Today there is a 90% down day; this may offer very small support to this wave count. However, recent new all time highs in both NYSE AD line and Lowry’s OCO AD line suggest this wave count has a very low probability.
HOURLY CHART
Click chart to enlarge.
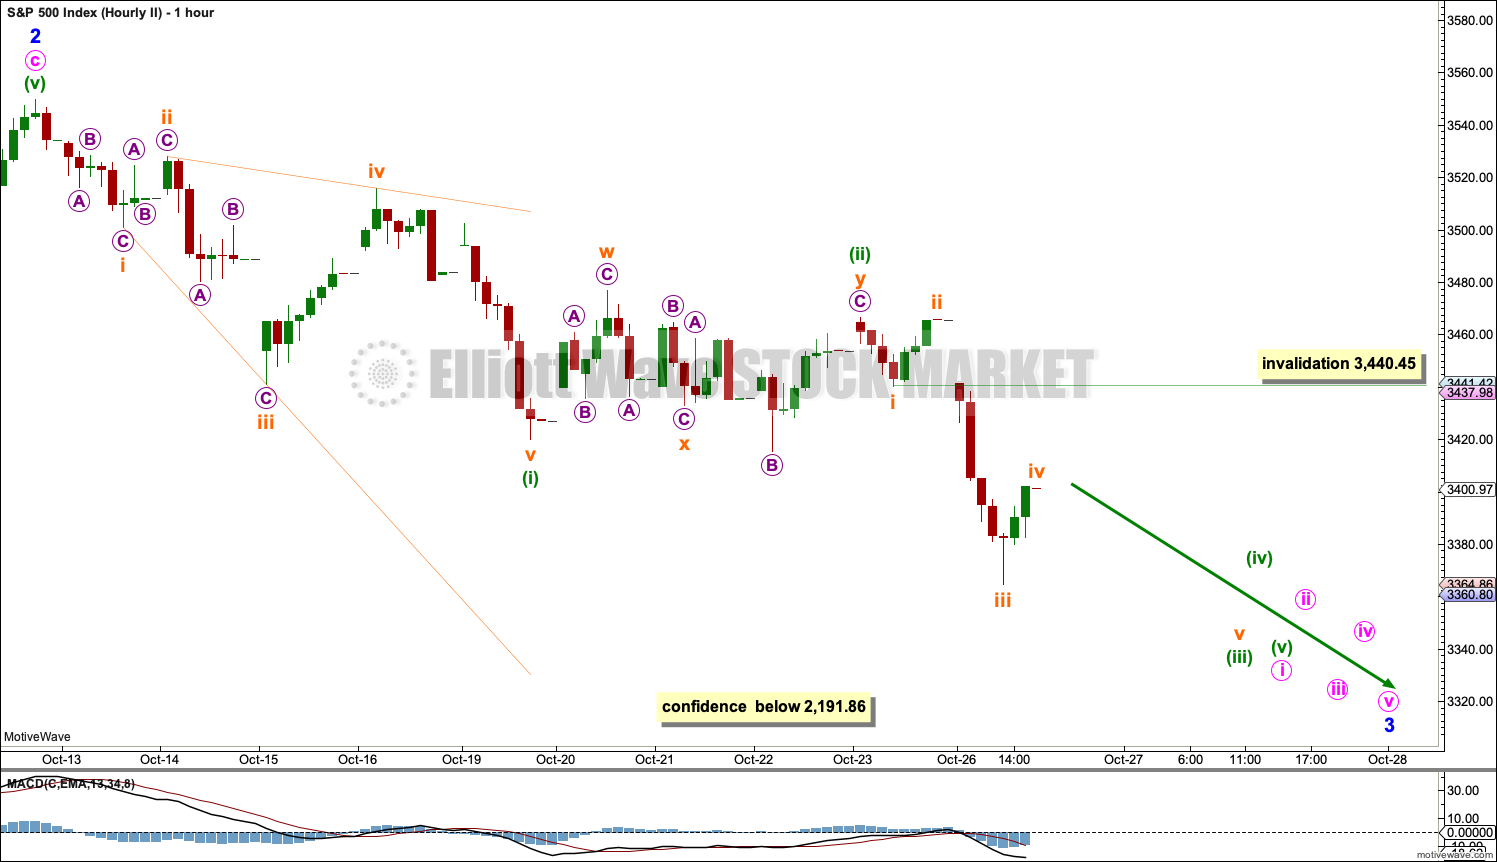
Minor wave 2 may be a complete zigzag.
Minor wave 3 downwards may have begun. Minuette wave (i) within minute wave i within minor wave 3 may be a complete leading expanding diagonal. This structure is not very common, so the probability of this wave count is further reduced.
If this wave count is correct, then following a leading diagonal in a first wave position should be a deep second wave correction. Minuette wave (ii) may be complete as a double combination: zigzag – X – flat. If this structure is correct, then it is not very deep; again, reducing the probability of this wave count as it is not following common patterns.
Minuette wave (iii) may have moved through its middle portion today. Minuette wave (iii) may only subdivide as an impulse. Subminuette wave iv within the impulse may not move into subminuette wave i price territory above 3,440.45.
TECHNICAL ANALYSIS
WEEKLY CHART
Click chart to enlarge. Chart courtesy of StockCharts.com.
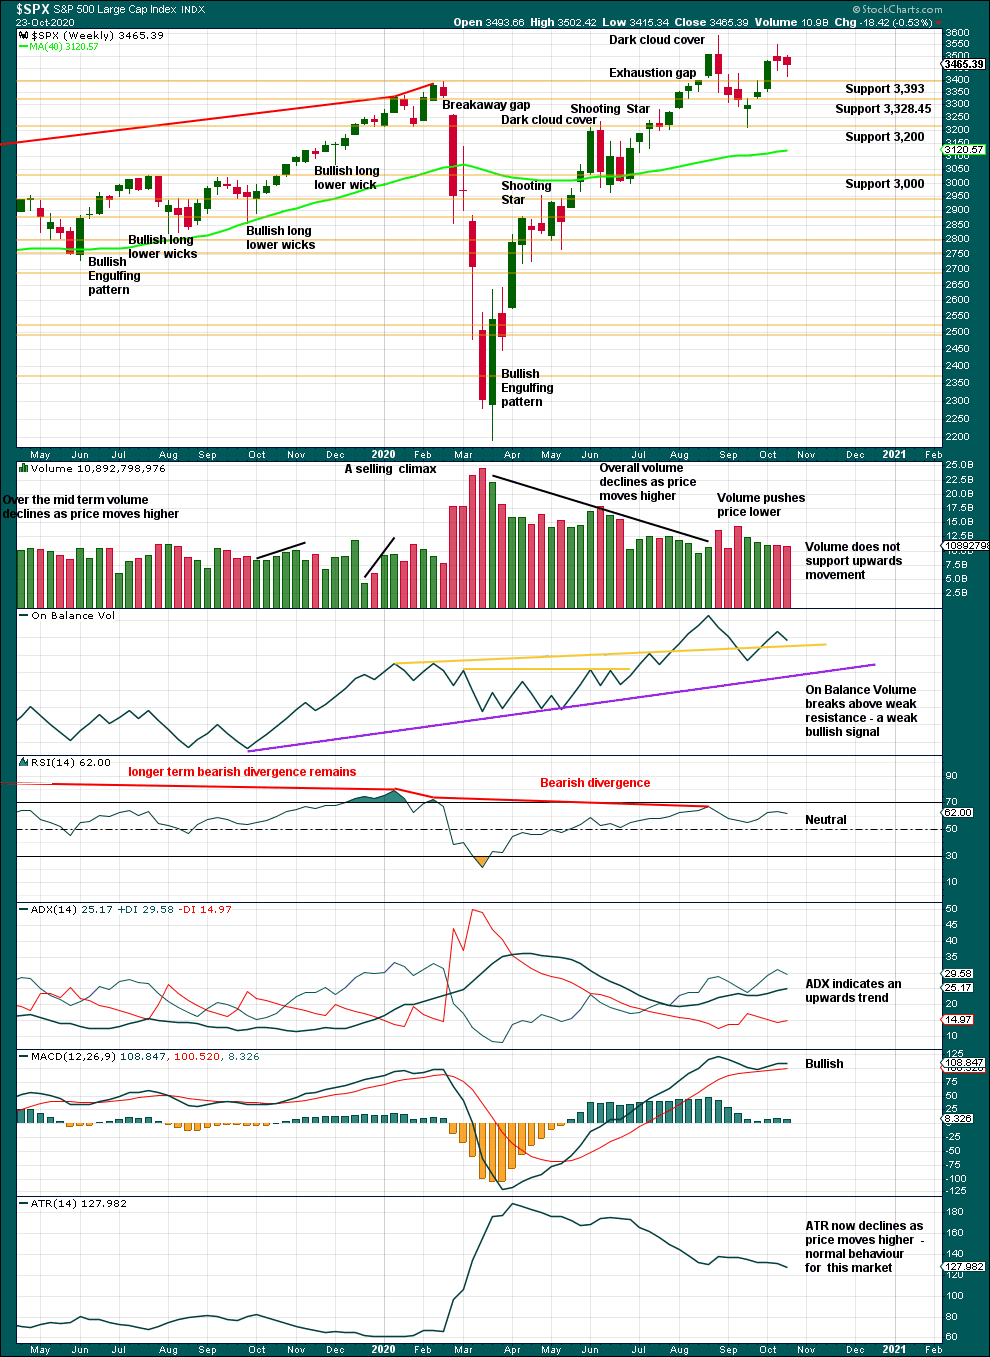
Last week closes with a longer lower wick and downwards movement within the week did not have support from volume. Support about 3,393 (a prior all time high) has held last week. With this price point now breached on Monday, it is not longer bullish.
There is an upwards trend in place.
DAILY CHART
Click chart to enlarge. Chart courtesy of StockCharts.com.
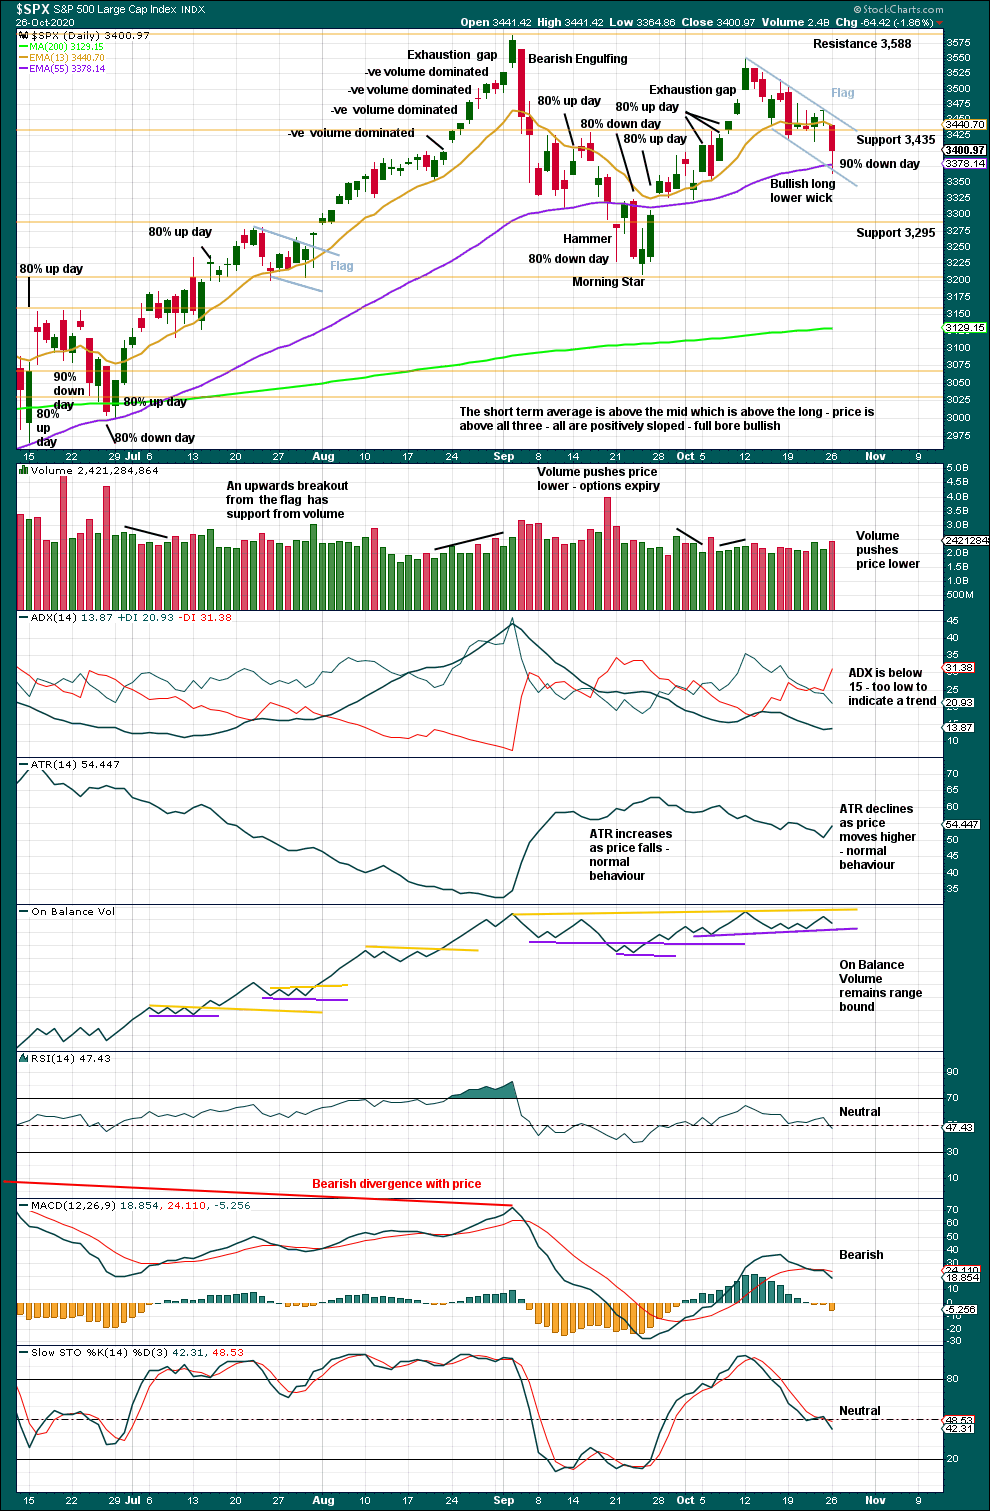
There are now two back to back 80% upwards days shortly after the low of the 24th of September. This adds some confidence that this low may be sustainable.
A flag pattern may be forming. Flags are continuation patterns. A target calculated from the flag pole would be about 3,785.
Today’s 90% down day exhibits strength in selling, which has a little support from volume. As this market commonly forms V bottoms, it is possible that one may form here.
BREADTH – AD LINE
WEEKLY CHART
Click chart to enlarge. Chart courtesy of StockCharts.com. So that colour blind members are included, bearish signals will be noted with blue and bullish signals with yellow.
Breadth should be read as a leading indicator.
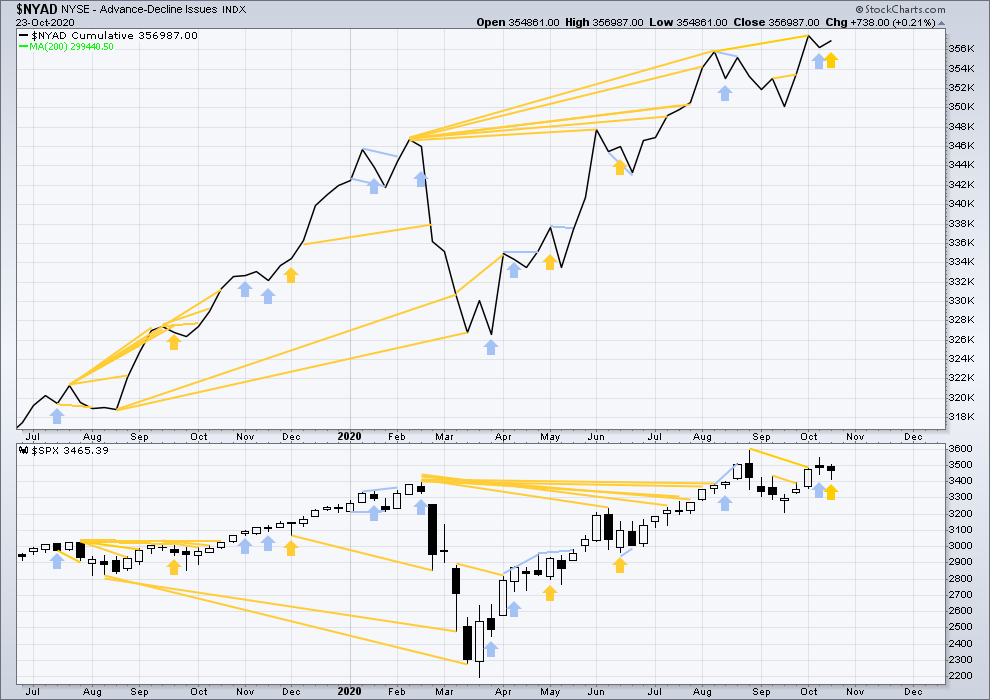
Lowry’s Operating Companies Only AD line has made a new all time high on the 12th of October. This erases prior bearish divergence with the last all time high in January 2020. With both the NYSE and OCO AD lines making new all time highs, breadth is leading price. This is a strong bullish signal and supports the first Elliott wave count.
Large caps all time high: 3,588.11 on September 2, 2020.
Mid caps all time high: 2,109.43 on February 20, 2020.
Small caps all time high: 1,100.58 on August 27, 2018.
Last week price has moved lower, but the AD line has moved higher. This divergence is bullish for the short term.
DAILY CHART
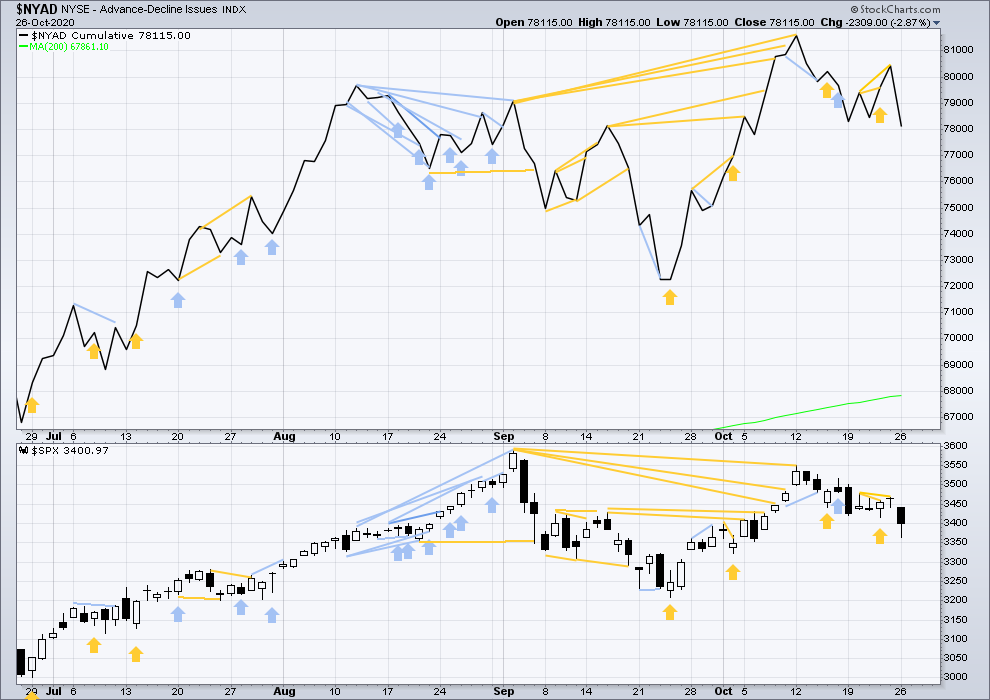
Click chart to enlarge. Chart courtesy of StockCharts.com. So that colour blind members are included, bearish signals will be noted with blue and bullish signals with yellow.
Bullish divergence has not yet been followed by upwards movement. Today both price and the AD line moved lower. There is no new divergence.
VOLATILITY – INVERTED VIX CHART
WEEKLY CHART
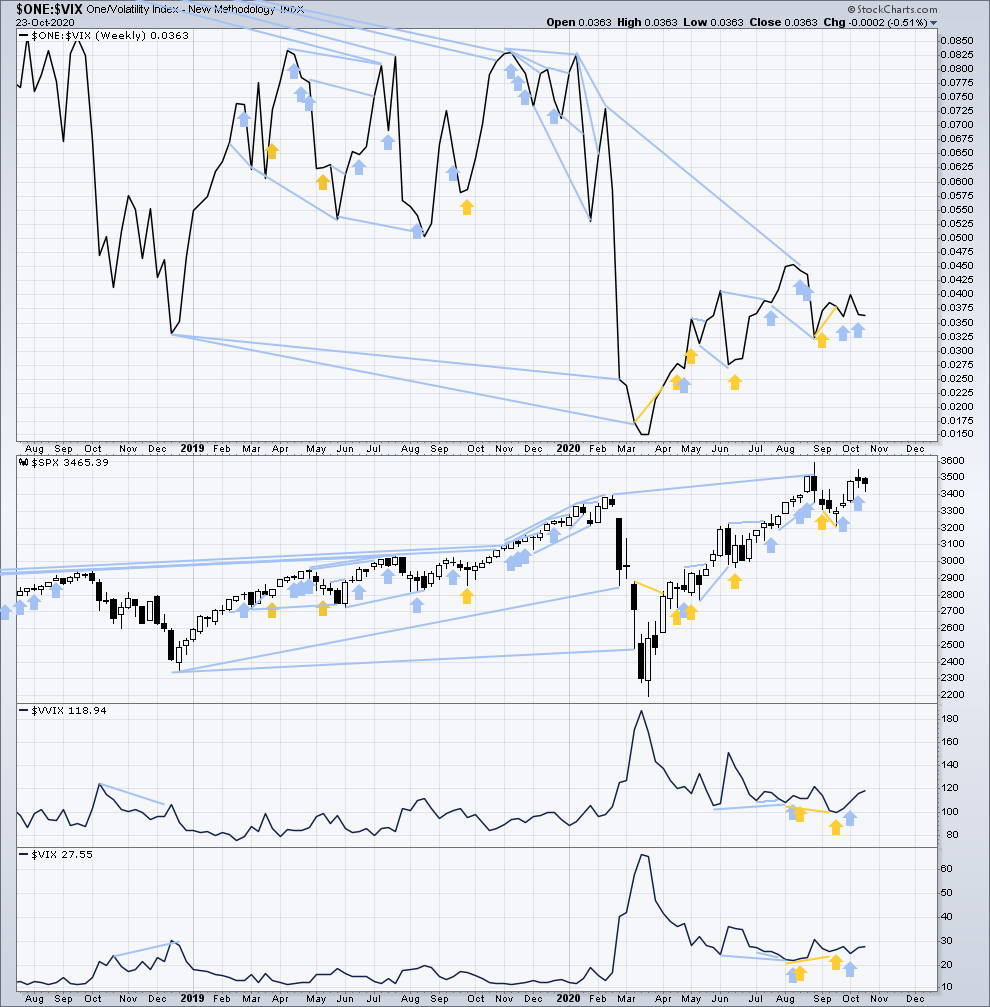
Click chart to enlarge. Chart courtesy of StockCharts.com. So that colour blind members are included, bearish signals will be noted with blue and bullish signals with yellow.
Inverted VIX remains well below all time highs. The all time high for inverted VIX was in the week beginning October 30, 2017. There is nearly 3 years of bearish divergence between price and inverted VIX. There is all of long, mid and short-term bearish divergence.
Last week price and inverted VIX have moved lower. There is no new divergence.
Comparing VIX and VVIX: Last week both VIX and VVIX have moved higher. There is no new short-term divergence.
DAILY CHART
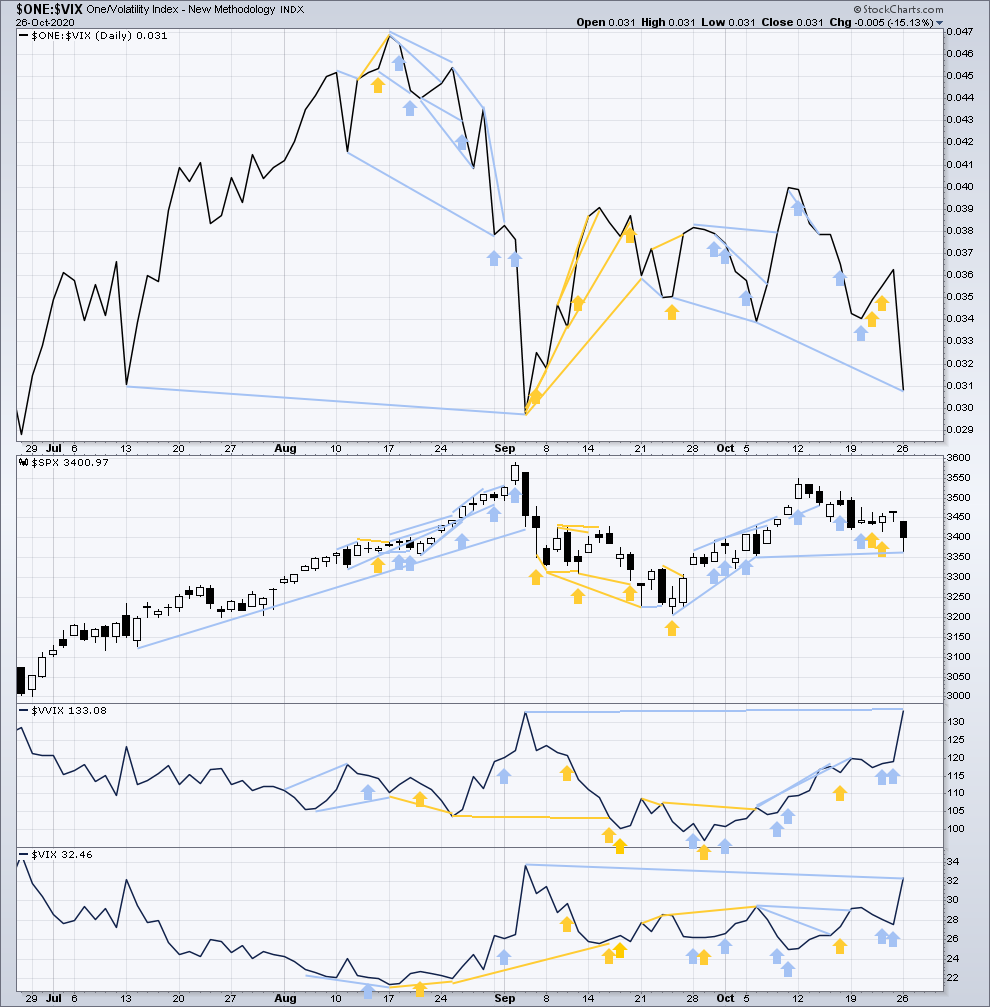
Click chart to enlarge. Chart courtesy of StockCharts.com. So that colour blind members are included, bearish signals will be noted with blue and bullish signals with yellow.
Today both price and inverted VIX have moved lower. Inverted VIX has made a new low below the prior low of the 8th of October, but price has not. This divergence is bearish.
Comparing VIX and VVIX at the daily chart level: Today VVIX has made a new high above the prior high of the 3rd of September, but VIX has not. This divergence is bearish for price.
DOW THEORY
Dow Theory still concludes a bear market is in place.
Dow Theory confirmed a bear market with the following lows made on a closing basis:
DJIA: 21,712.53 – a close below this point was been made on the March 12, 2020.
DJT: 8,636.79 – a close below this point was been made on March 9, 2020.
Adding in the S&P and Nasdaq for an extended Dow Theory, a bear market was confirmed:
S&P500: 2,346.58 – a close below this point was made on March 20, 2020.
Nasdaq: 7,292.22 – a close below this point was made on the March 12, 2020.
At this time, to shift Dow Theory from viewing a bear market to confirmation of a new bull market would require new highs made on a closing basis:
DJIA: 29,568.57
DJT: 11,623.58 – closed above on 7th October 2020.
Adding in the S&P and Nasdaq for an extended Dow Theory, confirmation of a bull market would require new highs made on a closing basis:
S&P500: 3,393.52 – closed above on 21st August 2020.
Nasdaq: 9,838.37 – closed above on June 8, 2020.
Published @ 07:51 p.m. ET.
—
Careful risk management protects your trading account(s).
Follow my two Golden Rules:
1. Always trade with stops.
2. Risk only 1-5% of equity on any one trade.
—
New updates to this analysis are in bold.