by Lara | Aug 20, 2021 | S&P 500, S&P 500 + DJIA
S&P 500: Elliott Wave and Technical Analysis | Video – August 20,...
by Lara | Aug 20, 2021 | S&P 500, S&P 500 + DJIA
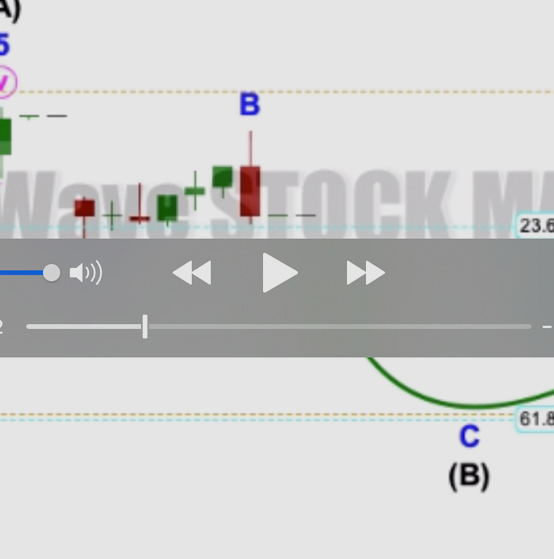
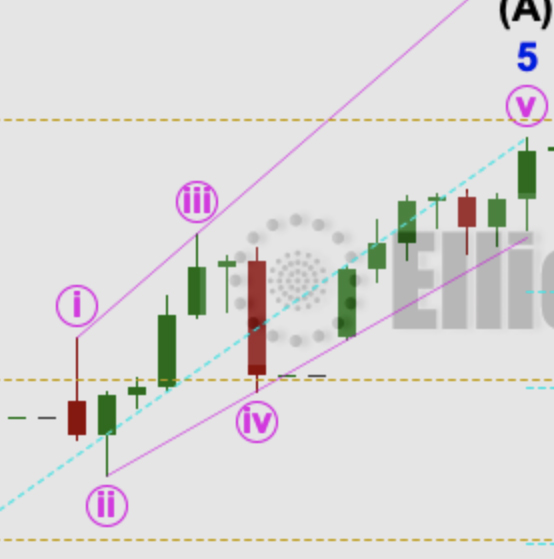
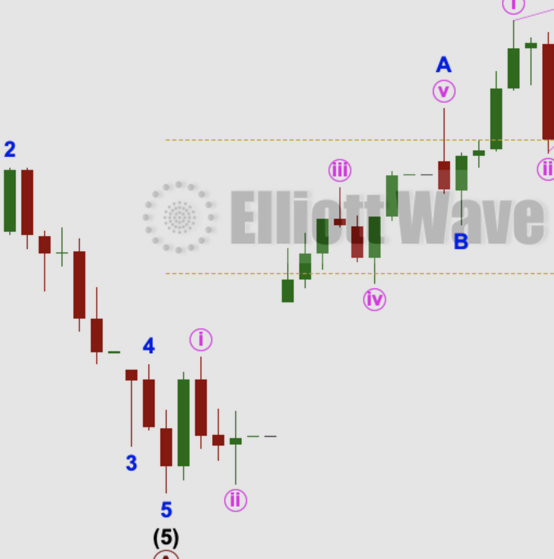
S&P 500: Elliott Wave and Technical Analysis | Charts – August 20, 2021 A bounce on Friday remains below the short-term invalidation point but does not fit expectations for the short term picture. The last third wave up is relabelled and a problem with the last...
by Lara | Aug 19, 2021 | S&P 500, S&P 500 + DJIA
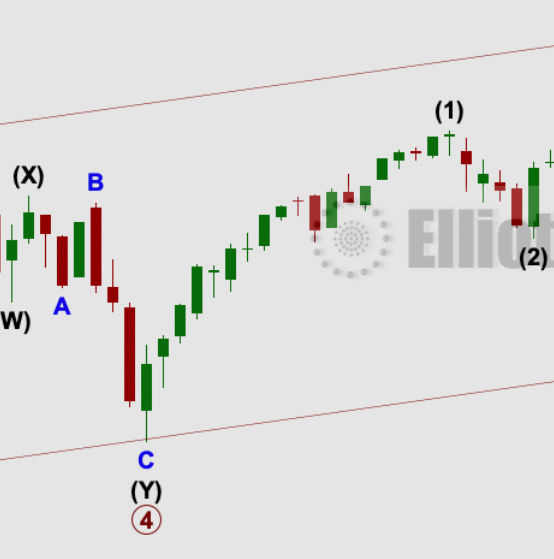
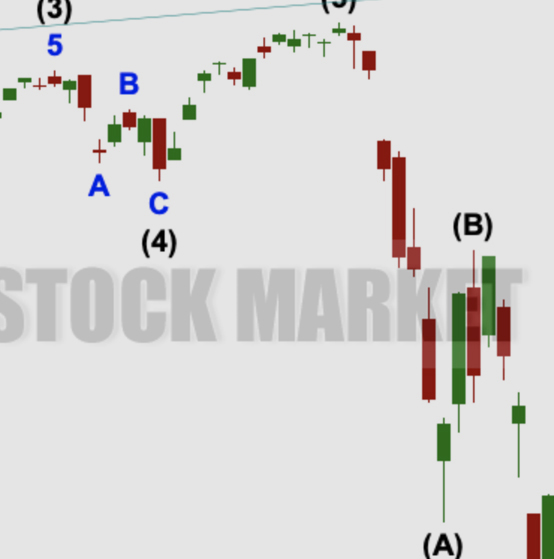
S&P 500: Elliott Wave and Technical Analysis | Charts – August 19, 2021 Downwards movement continues as all three Elliott wave counts expected. The first two Elliott wave counts have a reasonable probability. The second alternate remains highly unlikely. Summary:...
by Lara | Aug 18, 2021 | S&P 500, S&P 500 + DJIA
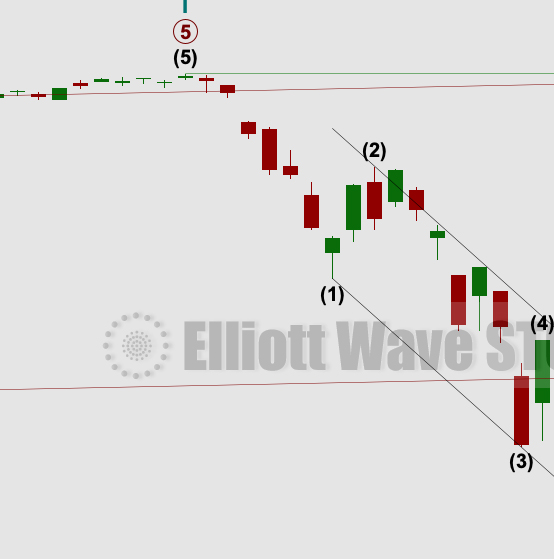
S&P 500: Elliott Wave and Technical Analysis | Charts – August 18, 2021 All three Elliott wave counts yesterday expected more downwards movement, which is what has happened. Summary: Bearish divergence between price and both of the AD line and inverted VIX...
by Lara | Aug 17, 2021 | S&P 500, S&P 500 + DJIA
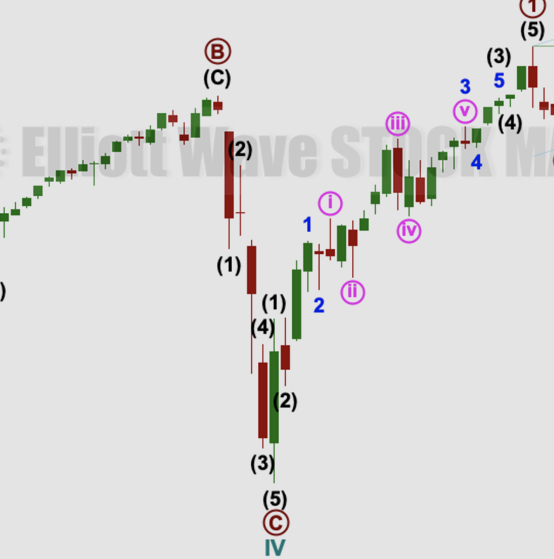
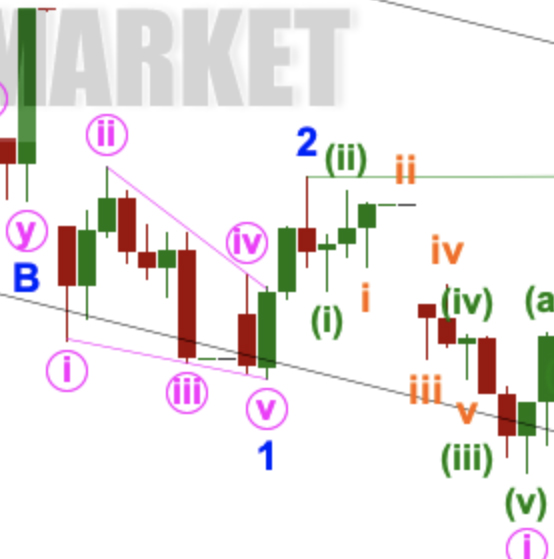
S&P 500: Elliott Wave and Technical Analysis | Charts – August 17, 2021 Today the first alternate Elliott wave count was invalidated. Three Elliott wave counts remain. They all expect the same direction next for price. Summary: There is an increasingly strong...
by Lara | Aug 16, 2021 | S&P 500, S&P 500 + DJIA
S&P 500: Elliott Wave and Technical Analysis | Charts – August 16, 2021 All four Elliott wave counts remain valid at the end of Monday’s session. A reasonably strong upwards day for price has some concerning underlying weakness. Summary: There is an...
by Lara | Aug 13, 2021 | S&P 500, S&P 500 + DJIA
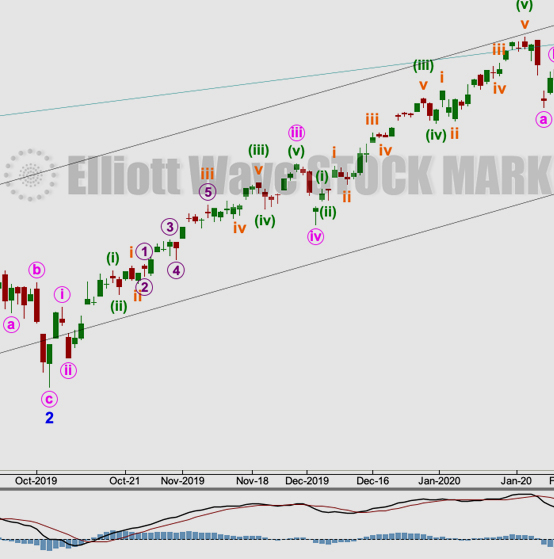
S&P 500: Elliott Wave and Technical Analysis | Charts – August 13, 2021 Four Elliott wave counts are considered at the end of this week. The main Elliott wave count remains the same because of technical evidence of weakness. Summary: There is still a reasonably...
by Lara | Aug 12, 2021 | S&P 500, S&P 500 + DJIA
S&P 500: Elliott Wave and Technical Analysis | Charts – August 12, 2021 The inclination is to switch to a bullish Elliott wave count as upwards movement continues. However, increasing bearish divergence from the AD line still suggests the main Elliott wave count,...
by Lara | Aug 11, 2021 | S&P 500, S&P 500 + DJIA
S&P 500: Elliott Wave and Technical Analysis | Charts – August 11, 2021 A little more upwards movement fits the first alternate Elliott wave count best, but classic technical analysis, particularly weakness in breadth as measured by the AD line, suggests the main...
