
S&P 500: Elliott Wave and Technical Analysis | Charts – August 18, 2021
All three Elliott wave counts yesterday expected more downwards movement, which is what has happened.
Summary: Bearish divergence between price and both of the AD line and inverted VIX strongly suggests more downwards movement and supports the Elliott wave analysis. Three Elliott wave counts are considered in order of probability:
1 – A minor degree fourth wave may see a pullback continue. The pullback would likely end below 4,233.13. A target is at 4,220.
2 – An intermediate degree fourth wave on the weekly chart may move suddenly lower to find support about the lower edge of the Elliott channel, which sits about 3,998 (first alternate).
3 – A primary degree second wave may begin. It may meet the technical definition of a bear market in that it may correct to 20% or more of market value at its eventual low. Also, it may find support about 3,066 and may not make a new low below 2,191.86 (second alternate – highly unlikely).
The biggest picture, Grand Super Cycle analysis, is here.
Monthly charts are last updated here with video here.
MAIN ELLIOTT WAVE COUNT
WEEKLY CHART
Click chart to enlarge.
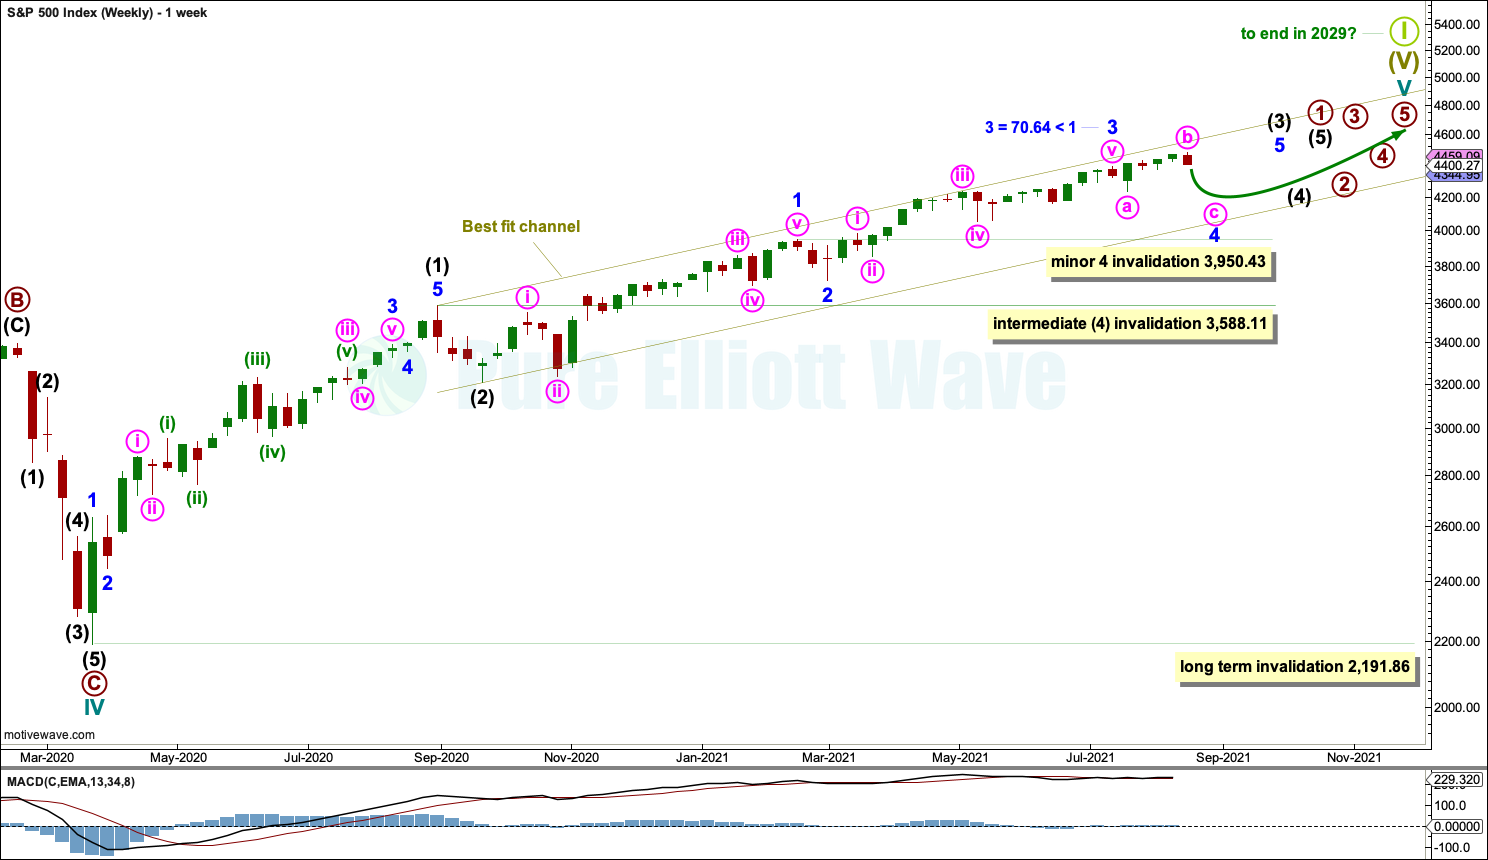
Cycle wave V may last from one to several years. So far it is in its seventeenth month.
This wave count may allow time for the AD line to diverge from price as price makes final highs before the end of the bull market. The AD line most commonly diverges a minimum of 4 months prior to the end of a bull market. A longer divergence is positively correlated with a deeper bear market. A shorter divergence is positively correlated with a more shallow bear market. There is now only eighteen days of divergence.
A longer divergence between price and the AD line would be expected towards the end of Grand Super Cycle wave I.
It is possible that cycle wave V may continue until 2029, if the 2020s mirror the 1920s. Either March or October 2029 may be likely months for the bull market to end.
Cycle wave V would most likely subdivide as an impulse. But if overlapping develops, then an ending diagonal should be considered. This chart considers the more common impulse.
There is already a Fibonacci ratio between cycle waves I and III within Super Cycle wave (V). The S&P500 often exhibits a Fibonacci ratio between two of its actionary waves but rarely between all three; it is less likely that cycle wave V would exhibit a Fibonacci ratio. The target for Super Cycle wave (V) to end would best be calculated at primary degree, but that cannot be done until all of primary waves 1, 2, 3 and 4 are complete.
Primary wave 1 within cycle wave V may be incomplete. This gives a very bullish wave count, expecting a long duration for cycle wave V which has not yet passed its middle strongest portion.
Within primary wave 1: Intermediate waves (1) and (2) may be complete, and intermediate wave (3) may now be approaching an end.
Intermediate wave (4) may not move into intermediate wave (1) price territory below 3,588.11.
Within intermediate wave (3), minor waves 1, 2 and 3 may be complete. Minor wave 3 may be shorter than minor wave 1 by 70.64 points. This limits minor wave 5 to no longer than equality in length with minor wave 3. Minor wave 4 may not move into minor wave 1 price territory below 3,950.43.
A best fit channel is drawn about cycle wave V. Draw the first trend line from the end of intermediate wave (1) to the end of minute wave iii within minor wave 3, then place a parallel copy on the end of intermediate wave (2). The channel may need to be redrawn as price continues higher. The channel may show where price may find resistance and support along the way up.
DAILY CHART
Click chart to enlarge.
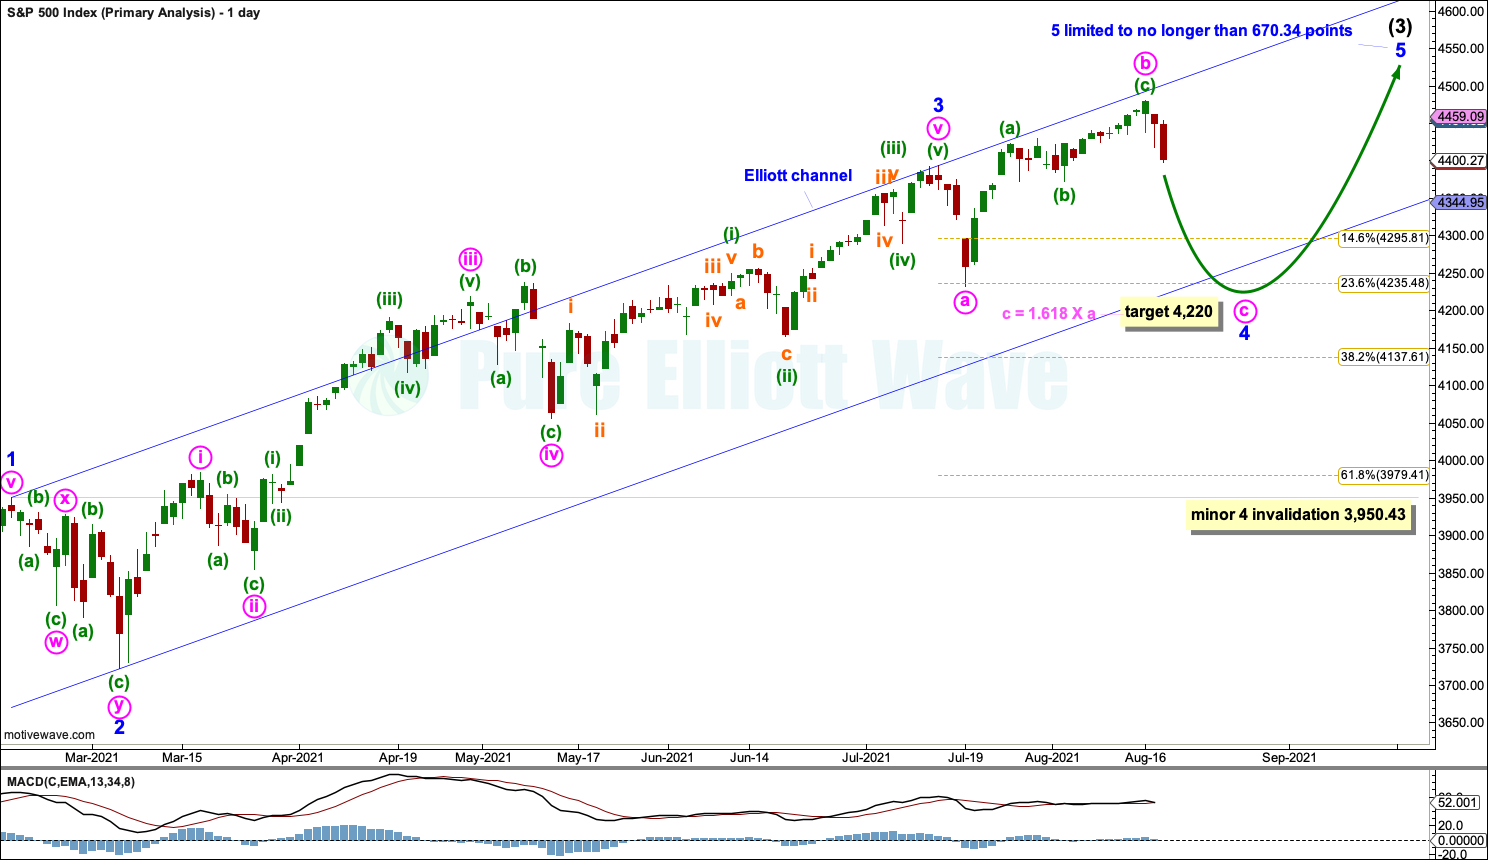
Minor wave 2 subdivided as a double zigzag and lasted 12 sessions. Minor wave 4 may last about 3 to 6 weeks and may most likely subdivide as a flat, triangle or combination, which are often longer lasting than zigzags.
The most likely structure for minor wave 4 at this stage looks like an expanded flat, which is a very common structure. Minute wave c within minor wave 4 would be likely to make at least a slight new low below the end of minute wave a at 4,233.13 to avoid a truncation and a very rare running flat.
Draw an Elliott channel. Draw the first trend line from the ends of minor waves 1 to 3, then place a parallel copy on the end of minor wave 2. Minor wave 4 may find support about the lower edge of this channel. It may also overshoot the channel.
Minor wave 4 may not move into minor wave 1 price territory below 3,950.43.
If minor wave 3 is over, then it would be 70.64 points shorter than minor wave 1. This limits minor wave 5 to no longer than equality in length with minor wave 3, so that the core Elliott rule stating a third wave may never be the shortest is met.
When expanded flats unfold, it is extremely difficult to identify them as their B waves make new price extremes beyond the start of their A waves. In a bull market that means price continues higher while a correction for wave C is expected. The key to identifying expanded flats is to look for reasonable weakness within the B wave. In this case there is reasonable technical evidence of weakness in breadth, volume and divergence with price and RSI. While this weakness remains, this must remain the main wave count based upon a judgement of balance of probability.
HOURLY CHART
Click chart to enlarge.
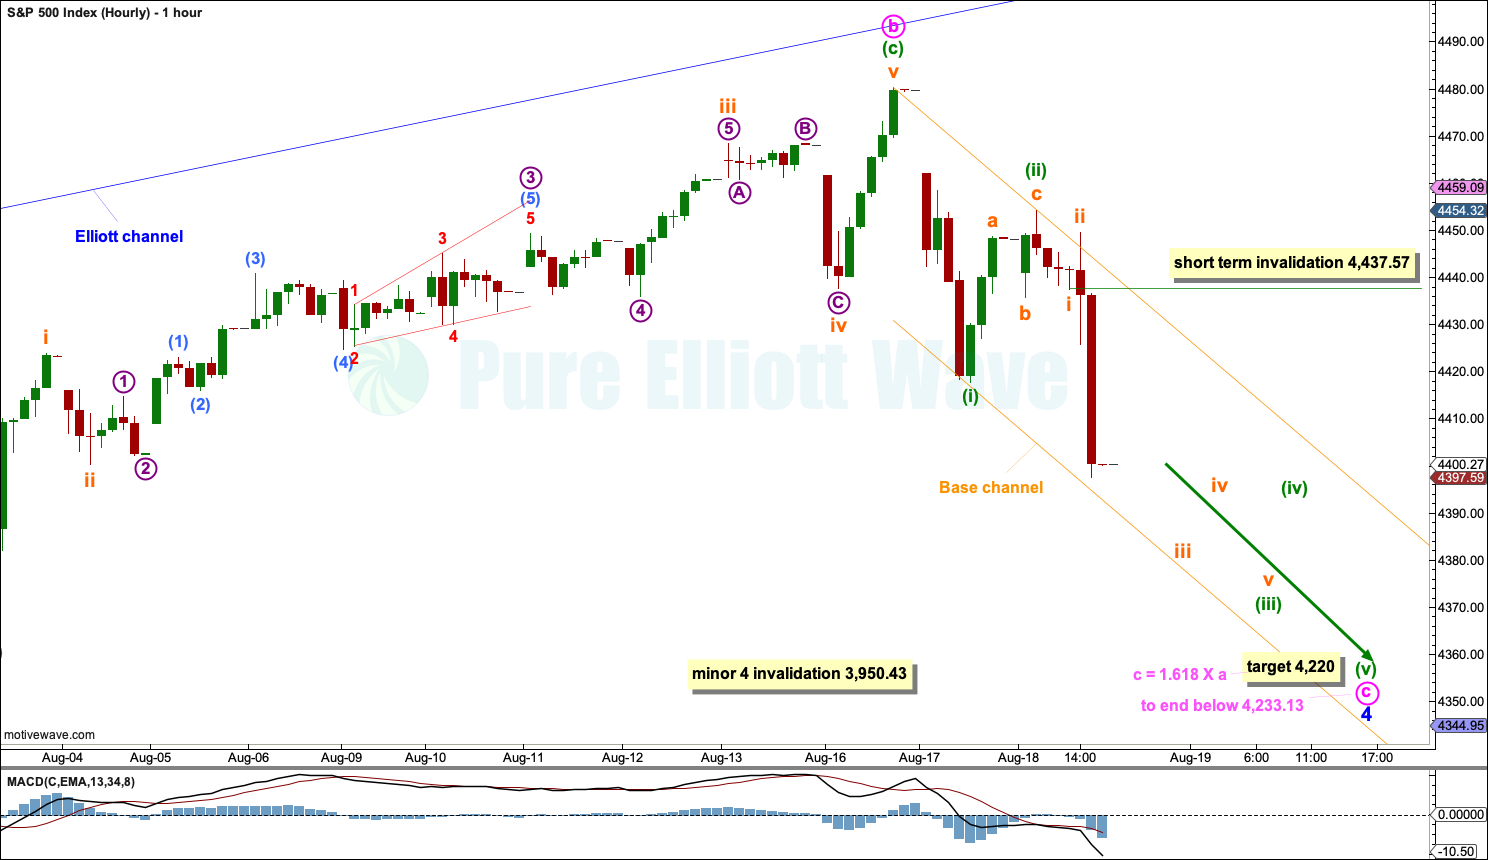
Minor wave 4 may be unfolding sideways as an expanded flat.
Minute wave b within minor wave 4 may be complete. If minute wave b is over at the last high, then it would be a 1.54 length of minute wave a, beyond the most common length. There is no rule stating a limit for B waves within flats, but there is a guideline that states that beyond twice the length of wave A the idea of a flat should be discarded based upon a very low probability. That price point is at 4,554.23.
Minute wave c would be very likely to make at least a slight new low below the end of minute wave a at 4,233.13 to avoid a truncation and a very rare running flat. A target is now calculated for minute wave c to complete minor wave 4.
Minute wave c must subdivide as a five wave motive structure, either an impulse or an ending diagonal. An impulse is more likely by a wide margin.
Within minute wave c: Minuette waves (i) and (ii) may be complete, and minuette wave (iii) may only subdivide as an impulse. Within minuette wave (iii): Subminuette waves i and ii may be complete, and subminuette wave iv may not move into subminuette wave i price territory above 4,437.57.
Minor wave 4 may not move into minor wave 1 price territory below 3,950.43.
FIRST ALTERNATE
WEEKLY CHART
Click chart to enlarge.
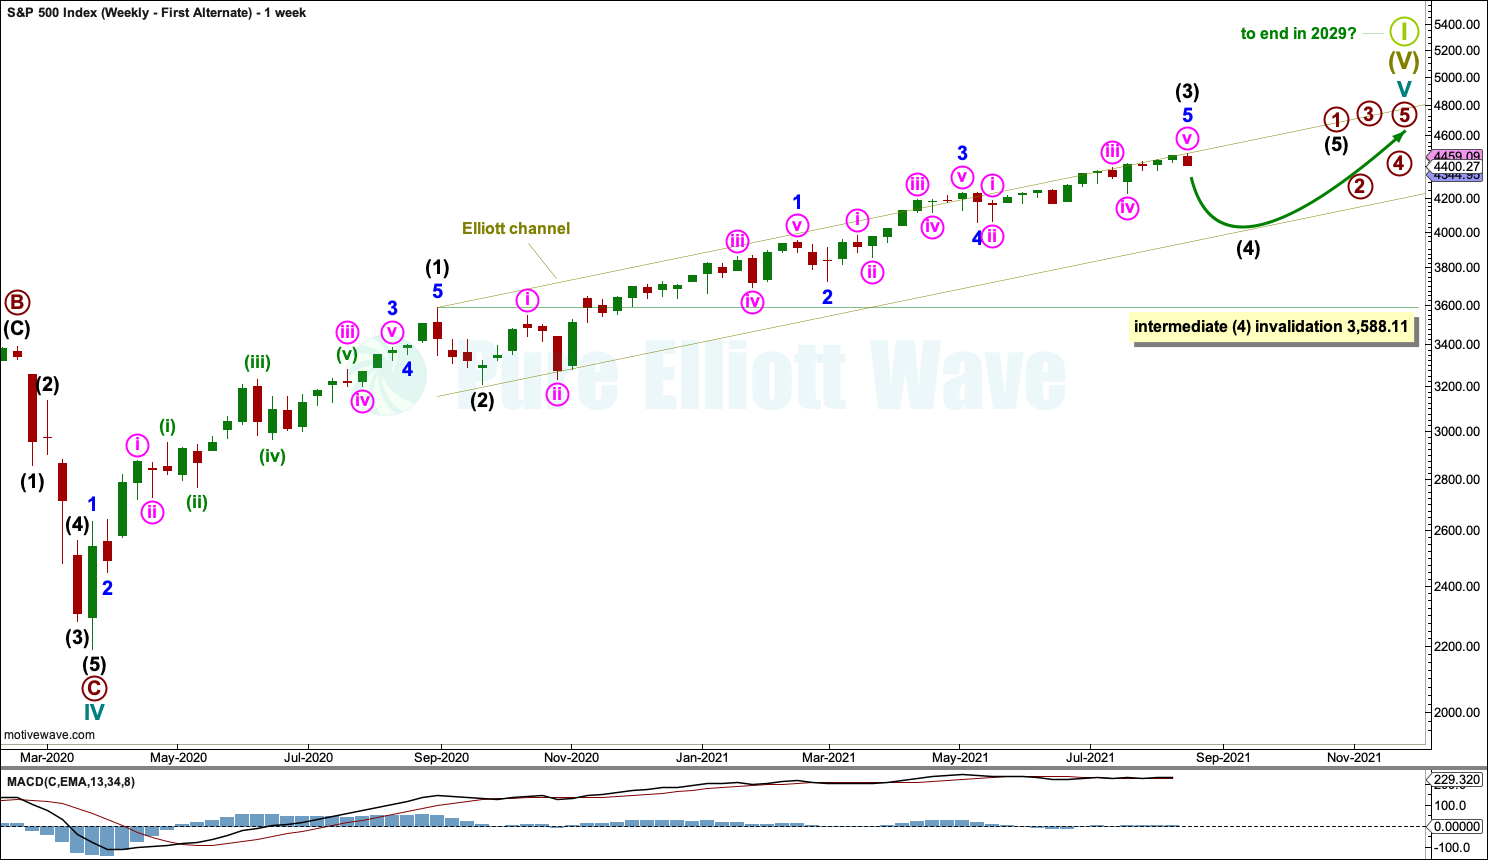
This weekly chart is still considered.
It is possible that intermediate wave (3) is over at the last high. However, it may also continue a little higher.
Intermediate wave (4) may last from three to several weeks and may find support about the lower edge of the Elliott channel. Intermediate wave (4) may not move into intermediate wave (1) price territory below 3,588.11.
Intermediate wave (3) is shorter than intermediate wave (1) by 125.44 points. It is unusual for third waves to be shorter than first waves for the S&P, particularly of a higher degree such as intermediate. This reduces the probability of this alternate wave count.
This alternate wave count is considered because the bearish divergence between price and the AD line is strong.
SECOND ALTERNATE
WEEKLY CHART
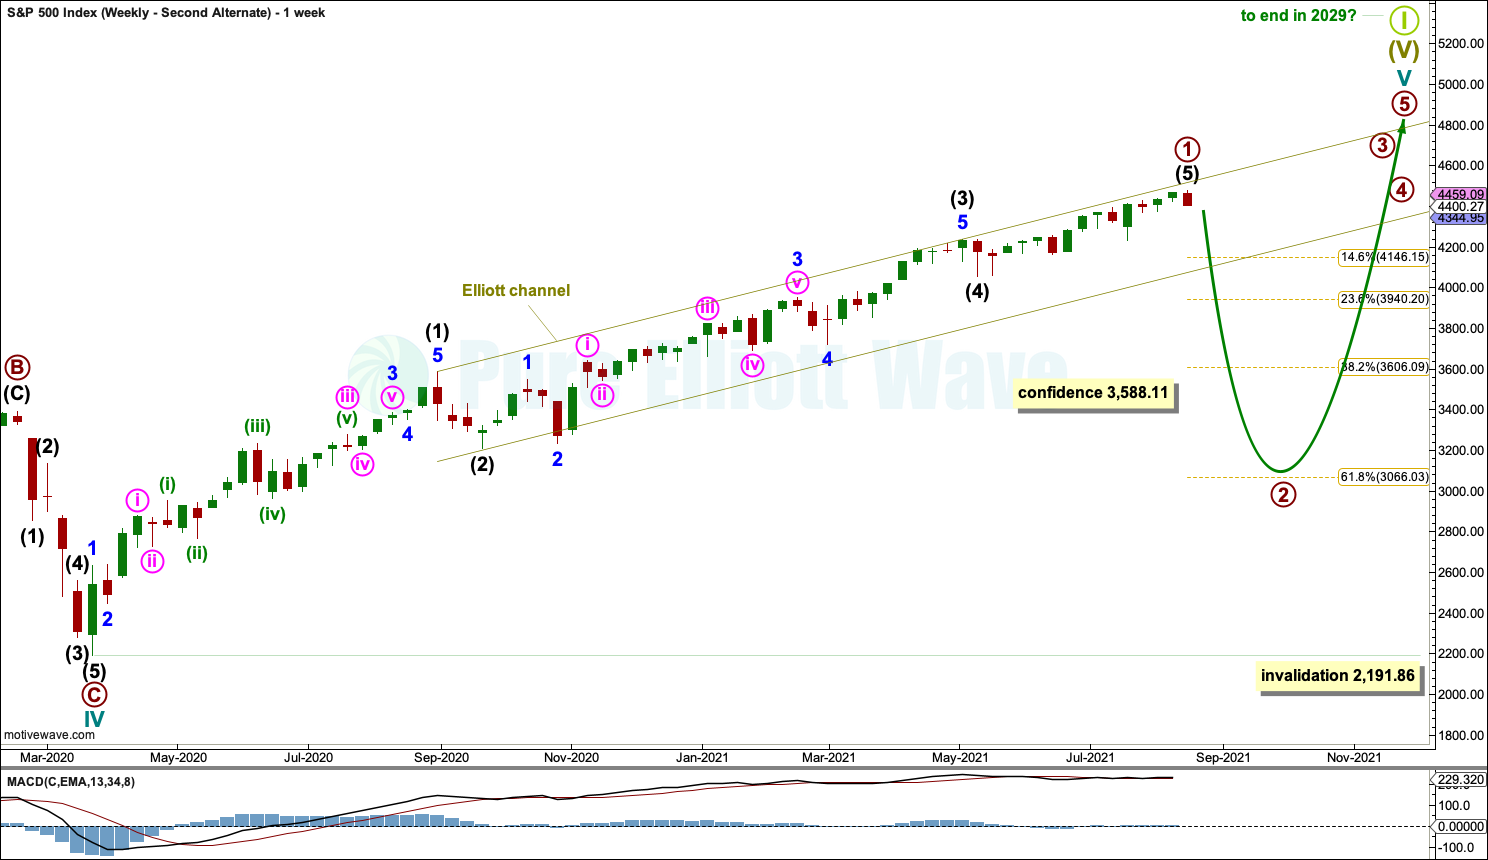
Click chart to enlarge.
This third alternate Elliott wave count is considered because it is technically possible. However, primary wave 2 may correct to the 0.618 Fibonacci ratio, which would be a 31.6% reduction in market value and meet the technical definition of a bear market. This is possible but has a very low probability as there is only 31 days of bearish divergence between price and the AD line. Within the last (almost) 100 years, only three bear markets have occurred following less than 4 months bearish divergence between price and the AD line. If this wave count is correct, then it would exhibit bearish divergence of less than 4 months a fourth time in almost 100 years; the probability of this alternate is rather low.
Primary wave 2 may last one to a few months. It may not move beyond the start of primary wave 1 below 2,191.86.
TECHNICAL ANALYSIS
WEEKLY CHART
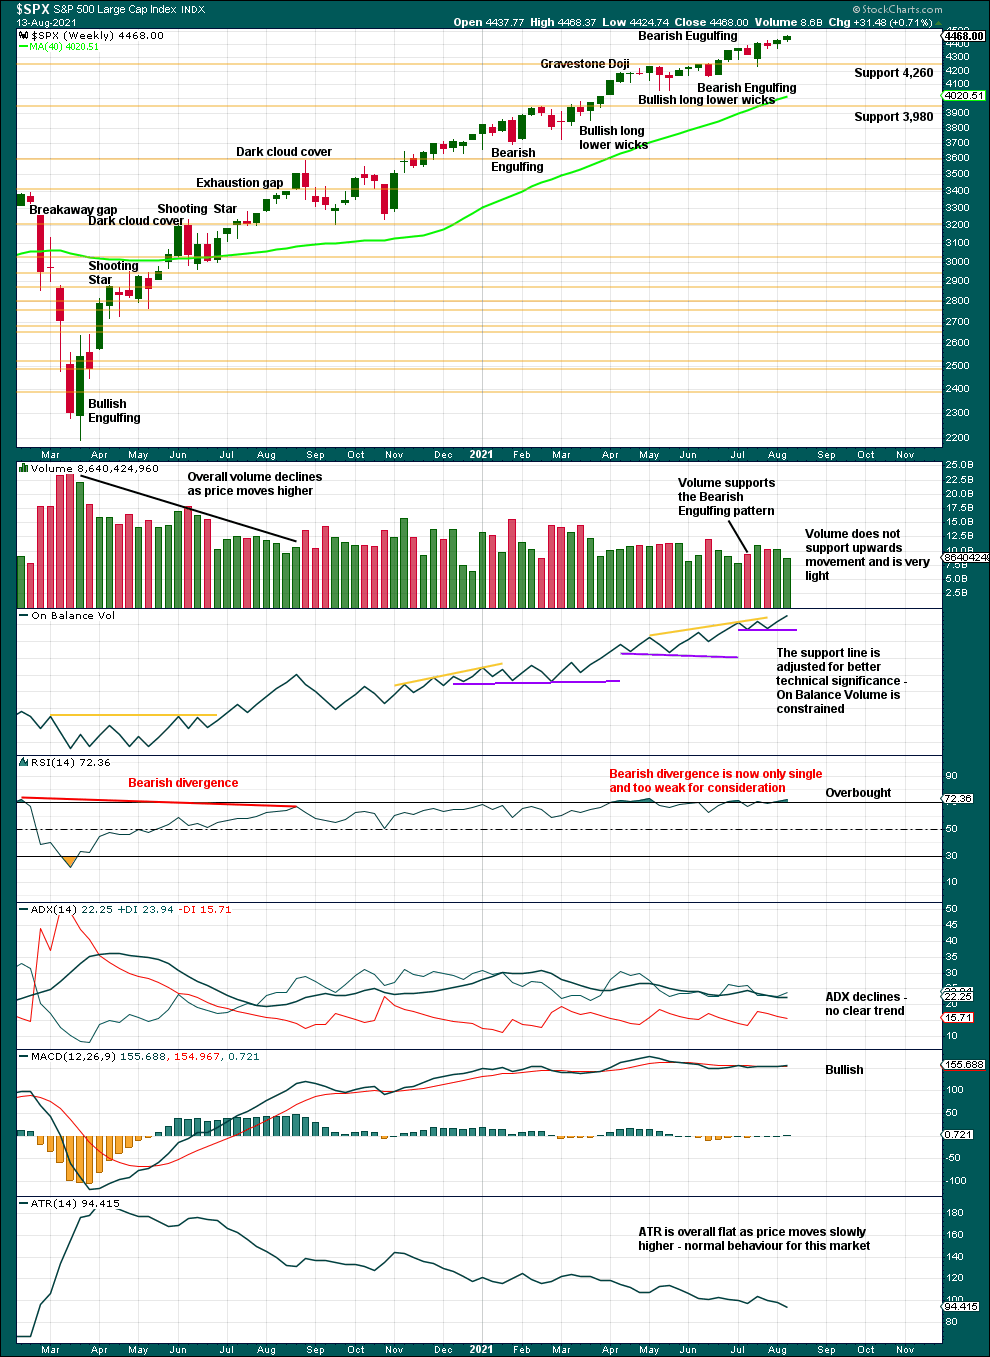
Click chart to enlarge. Chart courtesy of StockCharts.com.
Bearish divergence between price and RSI has almost disappeared this week. It is too small now for consideration.
This chart is bullish and does not support the main Elliott wave count. At this stage, it supports the first alternate Elliott wave count.
DAILY CHART
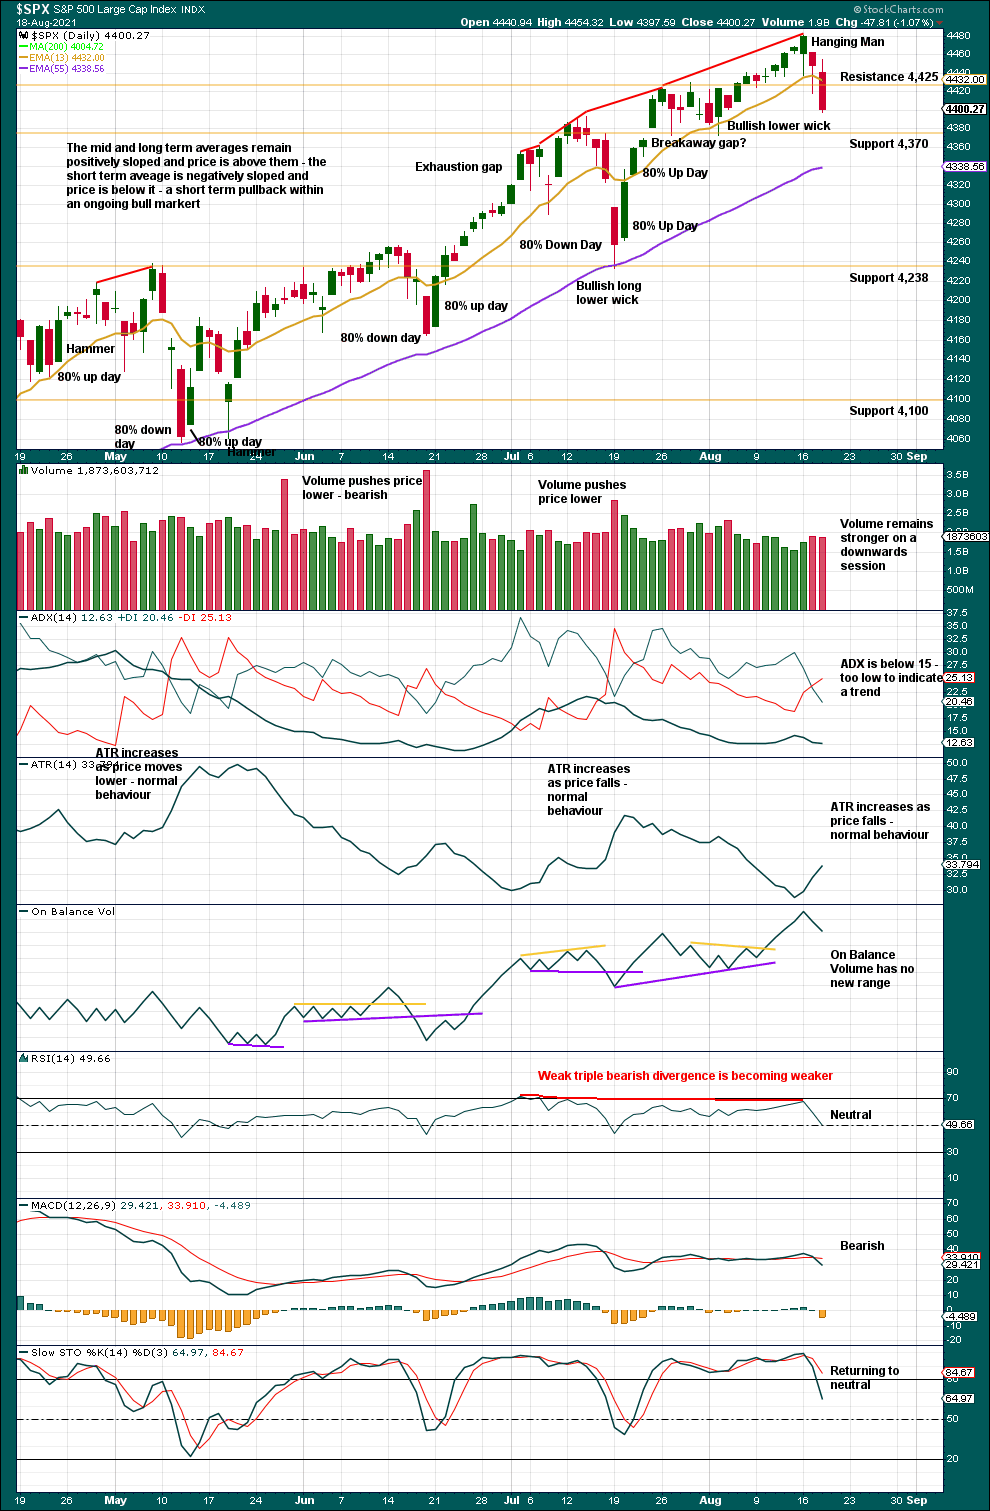
Click chart to enlarge. Chart courtesy of StockCharts.com.
Today the Hanging Man bearish reversal pattern receives bearish confirmation, so confidence in the reversal pattern may be had. Look for a downwards swing to continue until price finds support while Stochastics may reach below 50.
There is a potential trend change to down, but no clear trend at this stage.
BREADTH – AD LINE
WEEKLY CHART
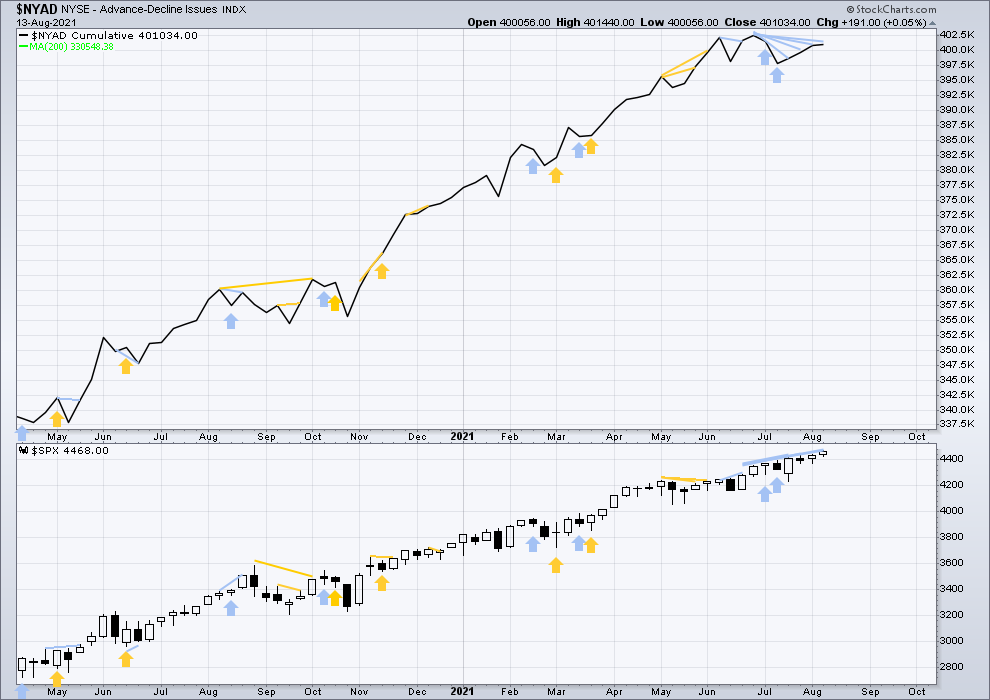
Click chart to enlarge. Chart courtesy of StockCharts.com. So that colour blind members are included, bearish signals will be noted with blue and bullish signals with yellow.
Breadth should be read as a leading indicator.
There are only 31 sessions of bearish divergence between the NYSE All Issues AD line and price. This supports the main and second alternate Elliott wave counts but not the third alternate Elliott wave count.
Large caps all time high: 4,480.26 on Aug 16, 2021.
Mid caps all time high: 2,780.08 on May 10, 2021.
Small caps all time high: 1,417.45 on June 8, 2021.
With 3 months of weakness in mid caps and 2 months of weakness in small caps, some pullback or consolidation may result soon.
Again, price has made new all time highs, but the AD line has not. The last all time high from the AD line was now six weeks ago. The gap is narrowing, but bearish divergence remains and supports the main Elliott wave count.
DAILY CHART
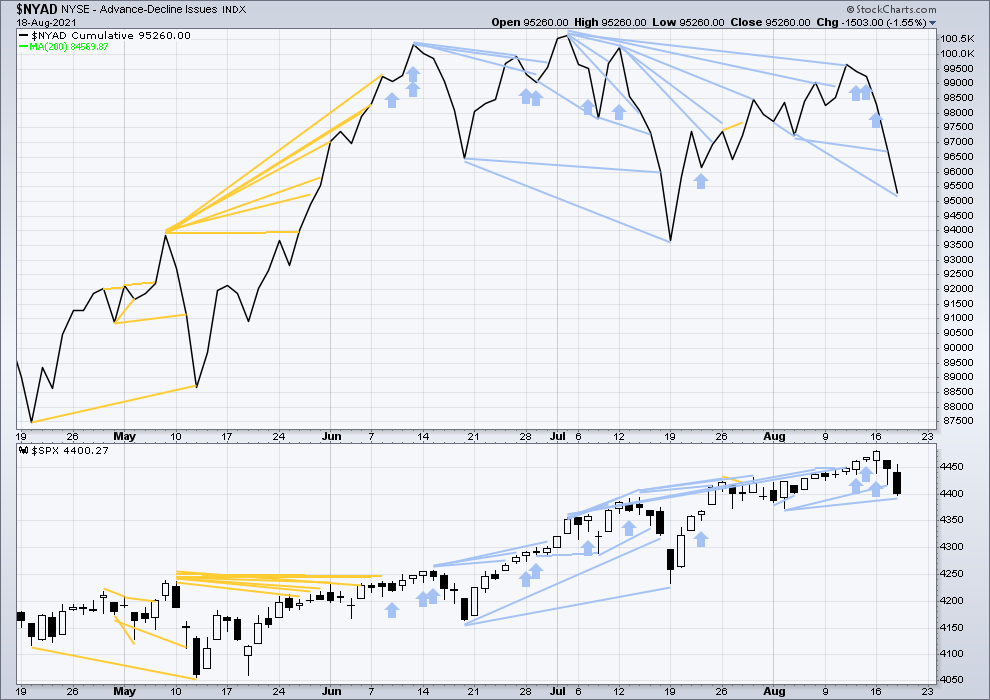
Click chart to enlarge. Chart courtesy of StockCharts.com. So that colour blind members are included, bearish signals will be noted with blue and bullish signals with yellow.
The NYSE All Issues AD line made its last all time high on July 2nd, 2021. There is over one month of bearish divergence. This suggests the market is currently vulnerable to a short-term pullback within the ongoing upwards trend. This is what the main Elliott wave count expects.
Again, price and the AD line have moved lower. The AD line has made another new low below the prior swing low of the 3rd / 4th August, but price has not. This divergence is bearish, and it is strong. This supports either the main or first alternate Elliott wave counts.
VOLATILITY – INVERTED VIX CHART
WEEKLY CHART
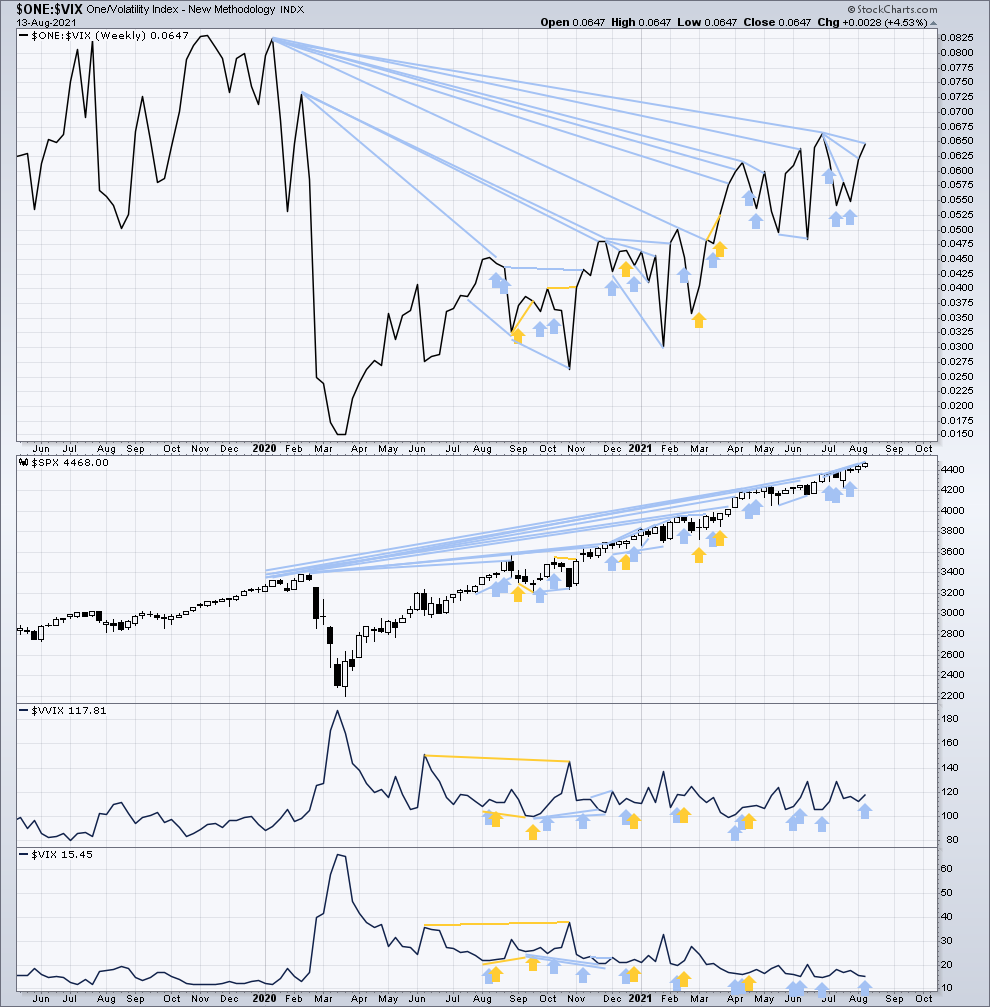
Click chart to enlarge. Chart courtesy of StockCharts.com. So that colour blind members are included, bearish signals will be noted with blue and bullish signals with yellow.
Inverted VIX remains well below all time highs. The all time high for inverted VIX was in the week beginning October 30, 2017. There is over 3 years of bearish divergence between price and inverted VIX. This bearish divergence may develop further before the bull market ends. It may be a very early indicator of an upcoming bear market, but it is not proving to be useful in timing. It may support the third alternate Elliott wave count.
Price and inverted VIX have moved higher last week. Price has made a new all time high, but inverted VIX exhibits all of short, mid and long-term bearish divergence. This supports the main or second alternate Elliott wave counts.
Comparing VIX and VVIX at the weekly chart level:
Last week VIX has moved lower, but VVIX has moved higher. Volatility of VIX this week increased, which is bearish for price for the short term. This supports the main Elliott wave count.
DAILY CHART
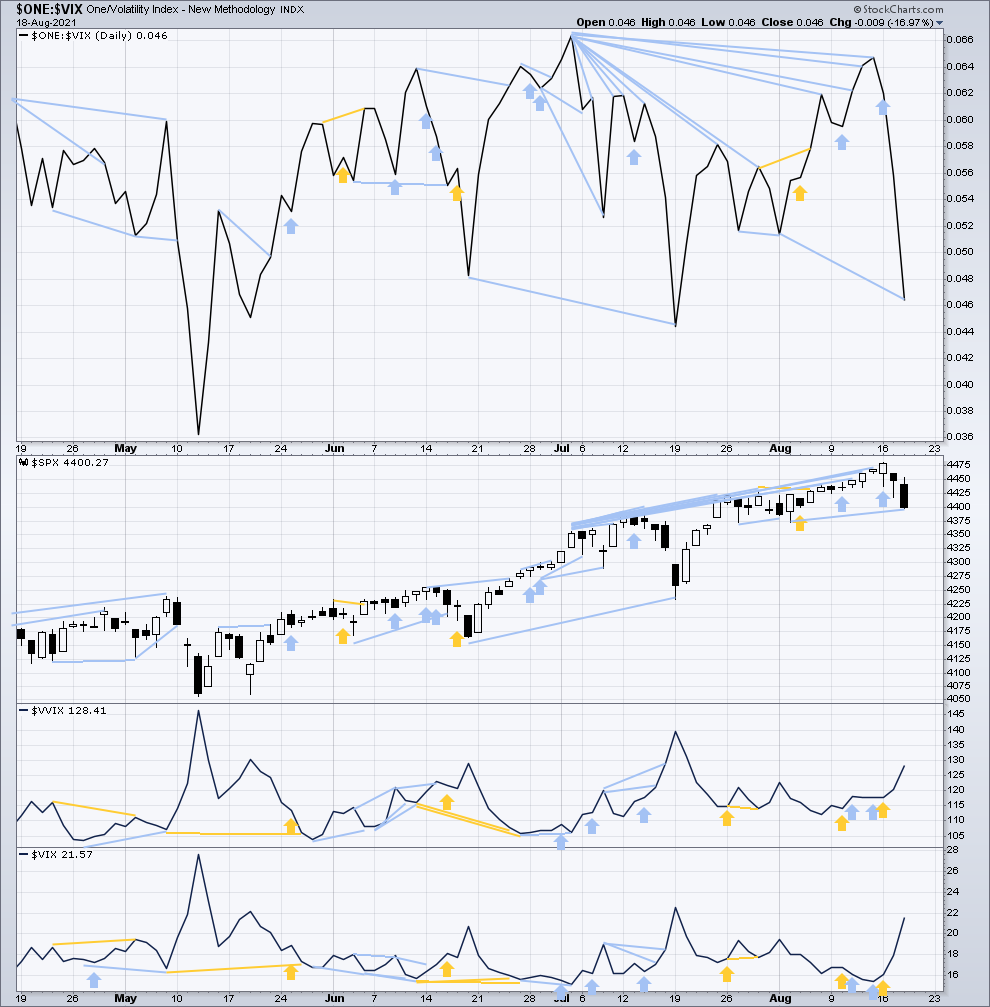
Click chart to enlarge. Chart courtesy of StockCharts.com. So that colour blind members are included, bearish signals will be noted with blue and bullish signals with yellow.
Again, both price and inverted VIX moved lower. Today inverted VIX has made a new swing low below the prior low of the 2nd / 3rd August, but price has not. This divergence is bearish and supports the Elliott wave analysis.
A remaining cluster of short, mid and long-term divergence supports either the main, first alternate or second alternate Elliott wave counts.
Comparing VIX and VVIX at the daily chart level:
Both VIX and VVIX have increased today. There is no new divergence.
DOW THEORY
Dow Theory confirms a new bull market with new highs made on a closing basis:
DJIA: 29,568.57 – closed above on 16th November 2020.
DJT: 11,623.58 – closed above on 7th October 2020.
Most recently, on 10th May 2021 both DJIA and DJT have made new all time highs. An ongoing bull market is again confirmed by Dow Theory.
Adding in the S&P and Nasdaq for an extended Dow Theory, confirmation of a bull market would require new highs made on a closing basis:
S&P500: 3,393.52 – closed above on 21st August 2020.
Nasdaq: 9,838.37 – closed above on June 8, 2020.
The following major swing lows would need to be seen on a closing basis for Dow Theory to confirm a change from bull to a bear market:
DJIA: 18,213.65
DJT: 6,481.20
Adding in the S&P and Nasdaq for an extended Dow Theory, confirmation of a new bear market would require new lows on a closing basis:
S&P500: 2,191.86
Nasdaq: 6,631.42
Published @ 06:34 p.m. ET.
—
Careful risk management protects your trading account(s).
Follow my two Golden Rules:
1. Always trade with stops.
2. Risk only 1-5% of equity on any one trade.
—
New updates to this analysis are in bold.
—