
S&P 500: Elliott Wave and Technical Analysis | Charts – August 20, 2021
A bounce on Friday remains below the short-term invalidation point but does not fit expectations for the short term picture. The last third wave up is relabelled and a problem with the last Elliott wave count is now resolved.
Summary: Bearish divergence between price and both of the AD line and inverted VIX strongly suggests more downwards movement and supports the Elliott wave analysis. Three Elliott wave counts are considered in order of probability:
1 – A minor degree fourth wave may see a pullback continue. The pullback may end about 4,301, or it may turn into a sideways consolidation.
2 – An intermediate degree fourth wave on the weekly chart may move suddenly lower to find support about the lower edge of the Elliott channel, which sits about 3,998 (first alternate).
3 – A primary degree second wave may begin. It may meet the technical definition of a bear market in that it may correct to 20% or more of market value at its eventual low. Also, it may find support about 3,066 and may not make a new low below 2,191.86 (second alternate – highly unlikely).
The biggest picture, Grand Super Cycle analysis, is here.
Monthly charts are last updated here with video here.
MAIN ELLIOTT WAVE COUNT
WEEKLY CHART
Click chart to enlarge.
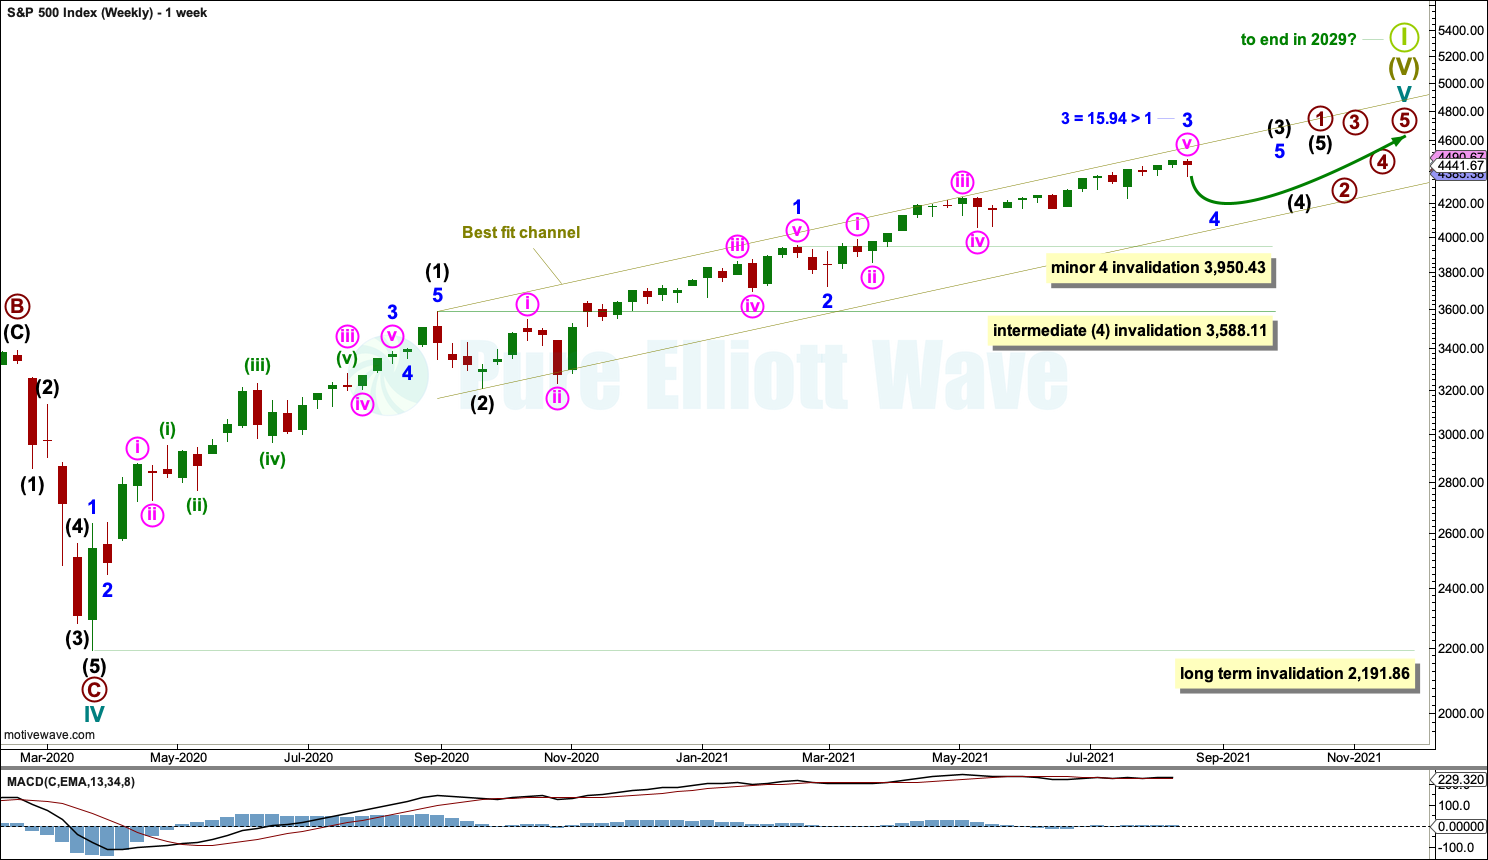
Cycle wave V may last from one to several years. So far it is in its seventeenth month.
This wave count may allow time for the AD line to diverge from price as price makes final highs before the end of the bull market. The AD line most commonly diverges a minimum of 4 months prior to the end of a bull market. A longer divergence is positively correlated with a deeper bear market. A shorter divergence is positively correlated with a more shallow bear market. There is now only eighteen days of divergence.
A longer divergence between price and the AD line would be expected towards the end of Grand Super Cycle wave I.
It is possible that cycle wave V may continue until 2029, if the 2020s mirror the 1920s. Either March or October 2029 may be likely months for the bull market to end.
Cycle wave V would most likely subdivide as an impulse. But if overlapping develops, then an ending diagonal should be considered. This chart considers the more common impulse.
There is already a Fibonacci ratio between cycle waves I and III within Super Cycle wave (V). The S&P500 often exhibits a Fibonacci ratio between two of its actionary waves but rarely between all three; it is less likely that cycle wave V would exhibit a Fibonacci ratio. The target for Super Cycle wave (V) to end would best be calculated at primary degree, but that cannot be done until all of primary waves 1, 2, 3 and 4 are complete.
Primary wave 1 within cycle wave V may be incomplete. This gives a very bullish wave count, expecting a long duration for cycle wave V which has not yet passed its middle strongest portion.
Within primary wave 1: Intermediate waves (1) and (2) may be complete, and intermediate wave (3) may now be approaching an end.
Intermediate wave (4) may not move into intermediate wave (1) price territory below 3,588.11.
Within intermediate wave (3), minor waves 1, 2 and 3 may be complete. Minor wave 3 is now relabelled as complete at the last high and is now longer than equality in length with minor wave 1. This has a higher probability than prior labelling with minor wave 3 shorter than minor wave 1.
Minor wave 4 may not move into minor wave 1 price territory below 3,950.43.
A best fit channel is drawn about cycle wave V. Draw the first trend line from the end of intermediate wave (1) to the end of minute wave iii within minor wave 3, then place a parallel copy on the end of intermediate wave (2). The channel may need to be redrawn as price continues higher. The channel may show where price may find resistance and support along the way up.
DAILY CHART
Click chart to enlarge.
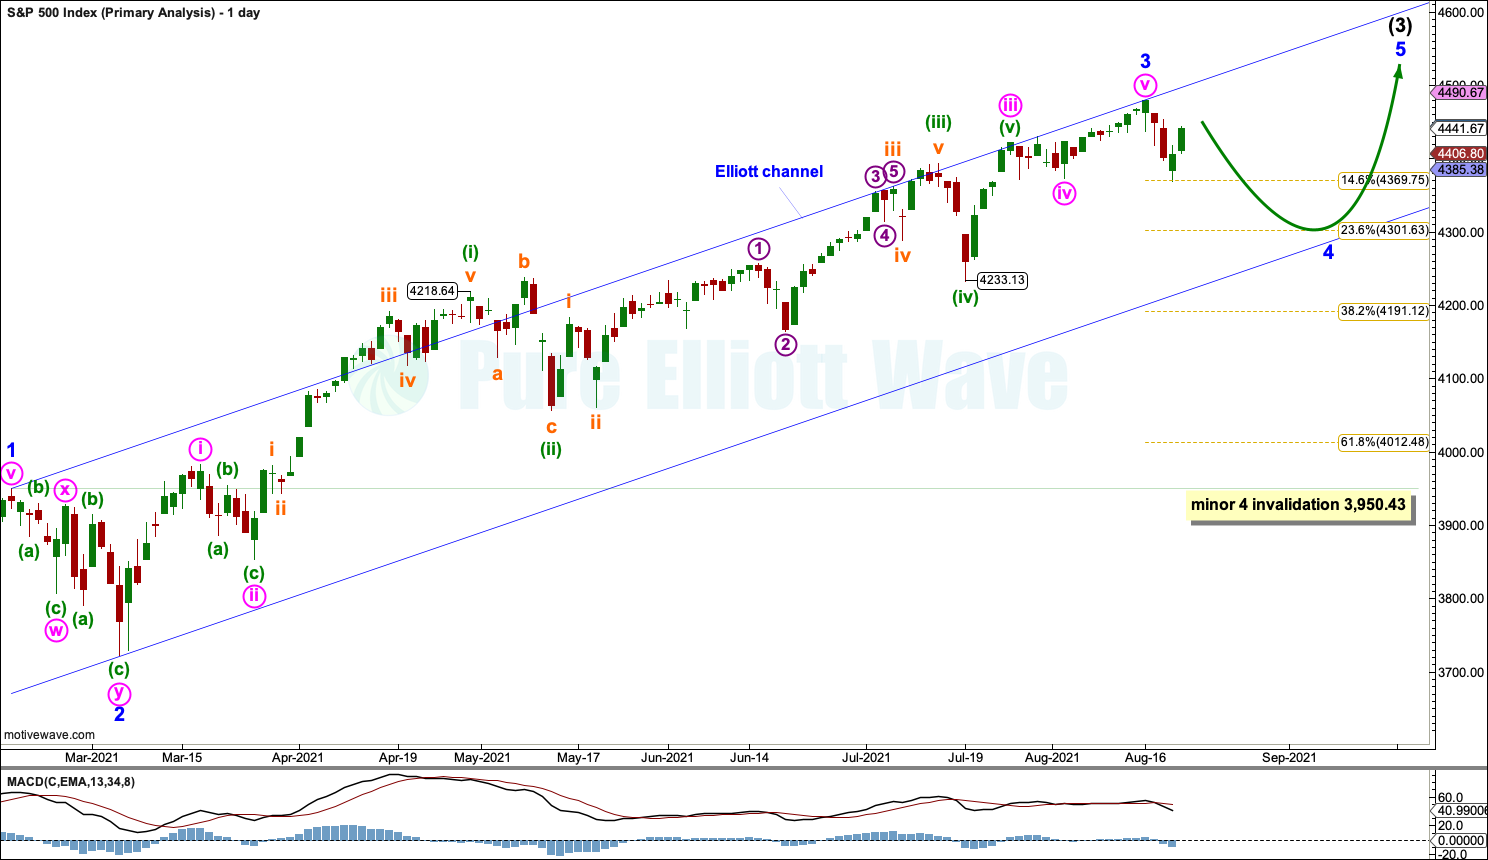
Minor wave 2 subdivided as a double zigzag and lasted 12 sessions. Minor wave 4 may have just begun.
Minor wave 4 may continue for another one to more likely two or three weeks. Minor wave 4 may unfold as any one of more than 23 possible corrective structures. It may find support about the 0.236 Fibonacci ratio of minor wave 3 at 4,201.63.
A zigzag within minor wave 4 may be complete at this week’s low. This may be the first zigzag of a double zigzag, a double combination, a flat or a triangle. The only structure which looks unlikely at this stage is a single zigzag for minor wave 4.
Flexibility is essential when corrections may be unfolding. Alternate wave counts need to be considered. The focus should not be on identifying exactly which structure may be unfolding, but when a corrective structure may be complete with reasonable proportion and when an opportunity for the next bull run may begin.
HOURLY CHART
Click chart to enlarge.
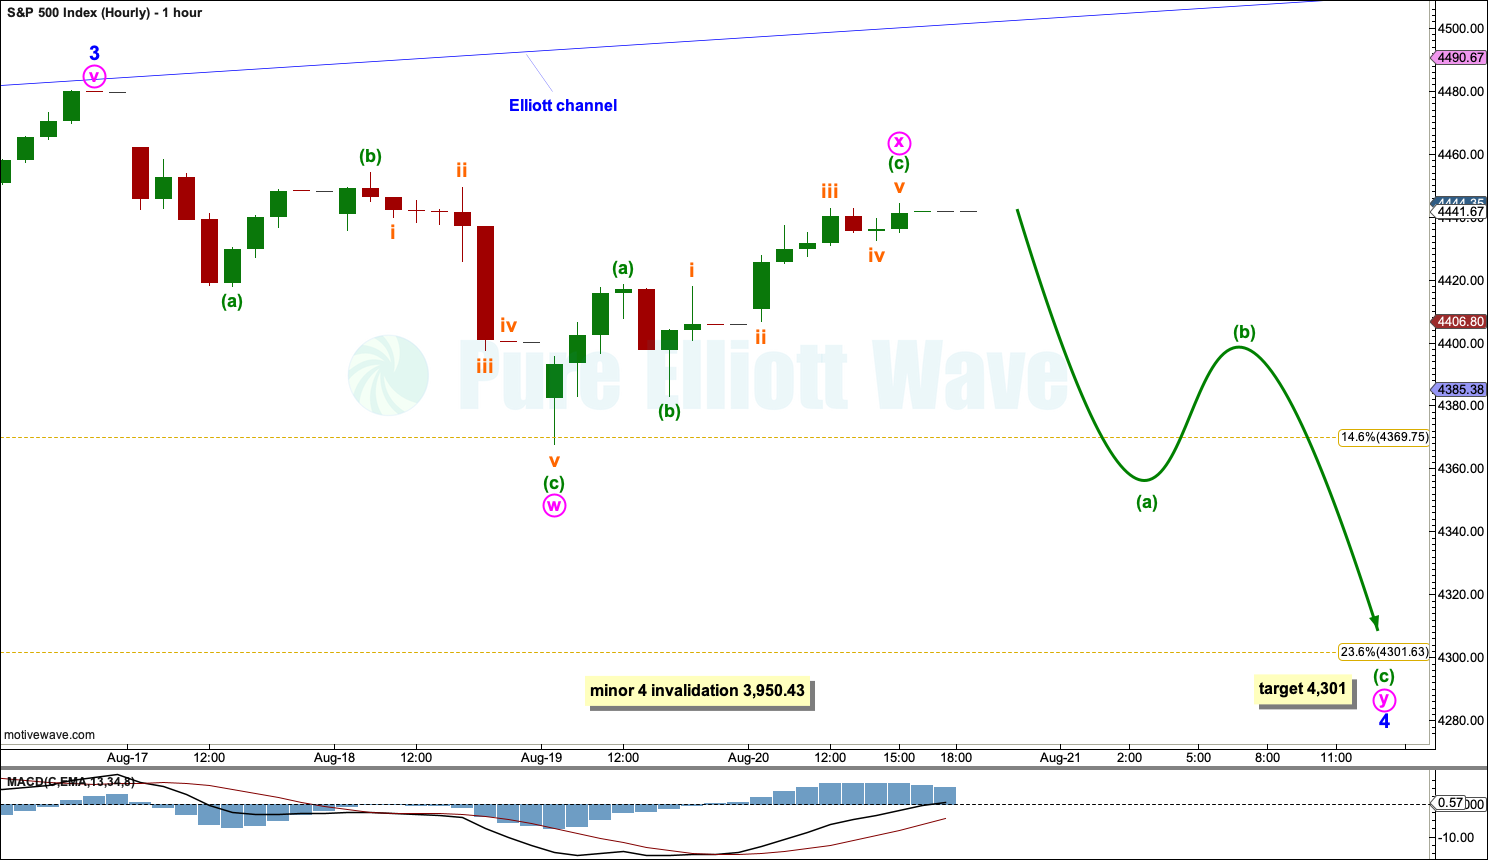
Minor wave 4 may have begun at the last high. The first wave down may be a complete zigzag labelled minute wave w.
Minor wave 4 is labelled on this chart as a possible double zigzag, but that would not offer good alternation with the double zigzag of minor wave 2. Alternation is a guideline and not a rule; both minor waves 2 and 4 may be double zigzags, but there may be alternation within them.
However, it will be essential in coming days to work with alternate wave counts.
Minor wave 4 may also be beginning as a sideways consolidation to sub-divide as a flat, combination or a triangle.
Wave B or X within an expanded flat, running triangle or combination may make a new price extreme beyond the start of the correction. Unfortunately, for this reason there can be no upper invalidation point for this wave count.
If price does make a new all time high and bearish divergence disappears, then minor wave 4 may be over. But a new all time high with continuing bearish divergence should be considered wave B or X within minor wave 4.
Minor wave 4 may not move into minor wave 1 price territory below 3,950.43.
FIRST ALTERNATE
WEEKLY CHART
Click chart to enlarge.
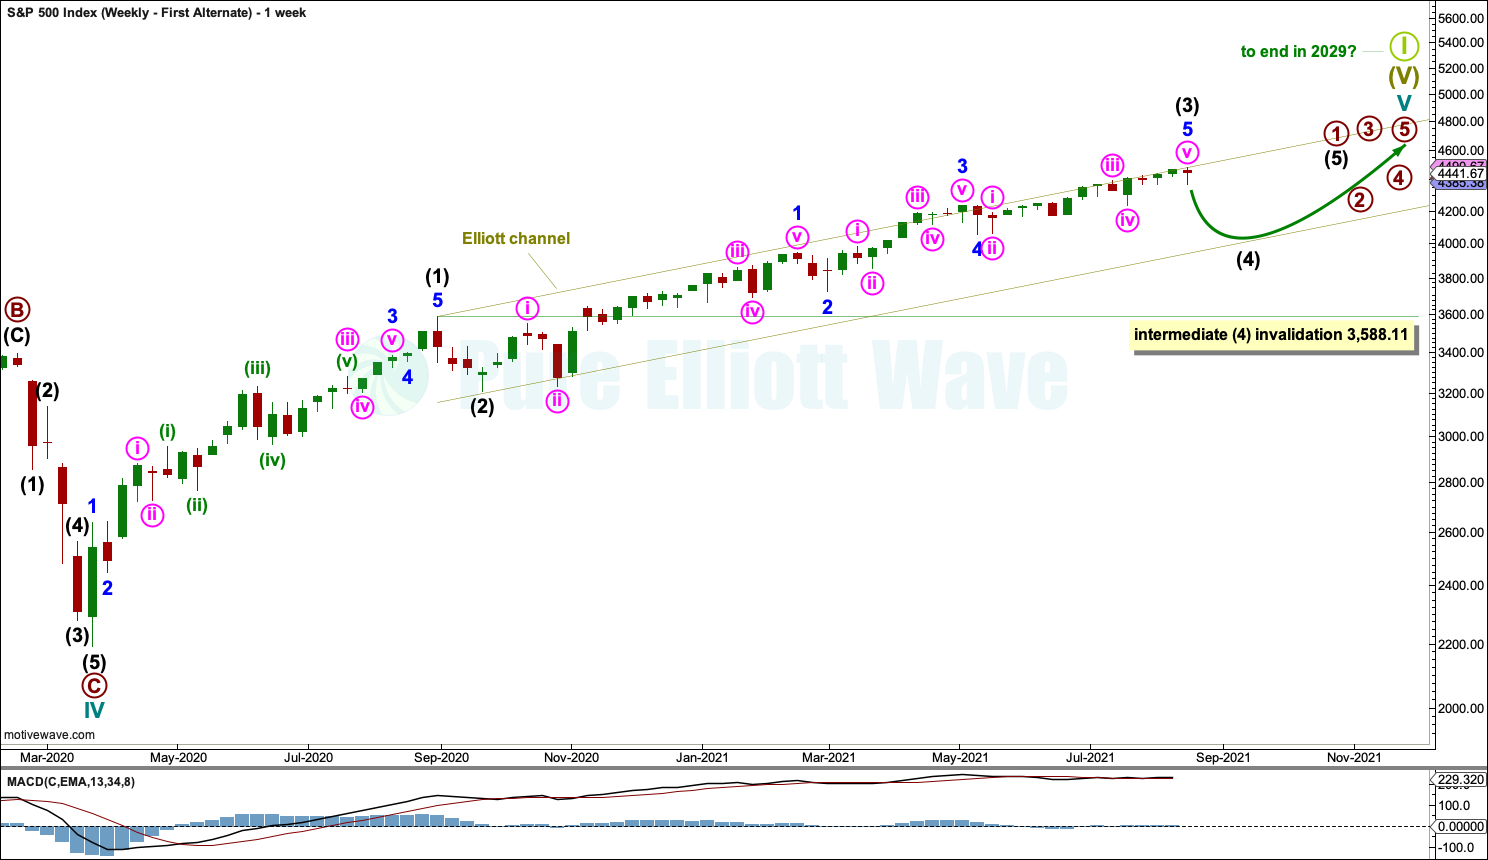
This weekly chart is still considered.
It is possible that intermediate wave (3) is over at the last high. However, it may also continue a little higher.
Intermediate wave (4) may last from three to several weeks and may find support about the lower edge of the Elliott channel. Intermediate wave (4) may not move into intermediate wave (1) price territory below 3,588.11.
Intermediate wave (3) is shorter than intermediate wave (1) by 125.44 points. It is unusual for third waves to be shorter than first waves for the S&P, particularly of a higher degree such as intermediate. This reduces the probability of this alternate wave count.
This alternate wave count is considered because the bearish divergence between price and the AD line is strong.
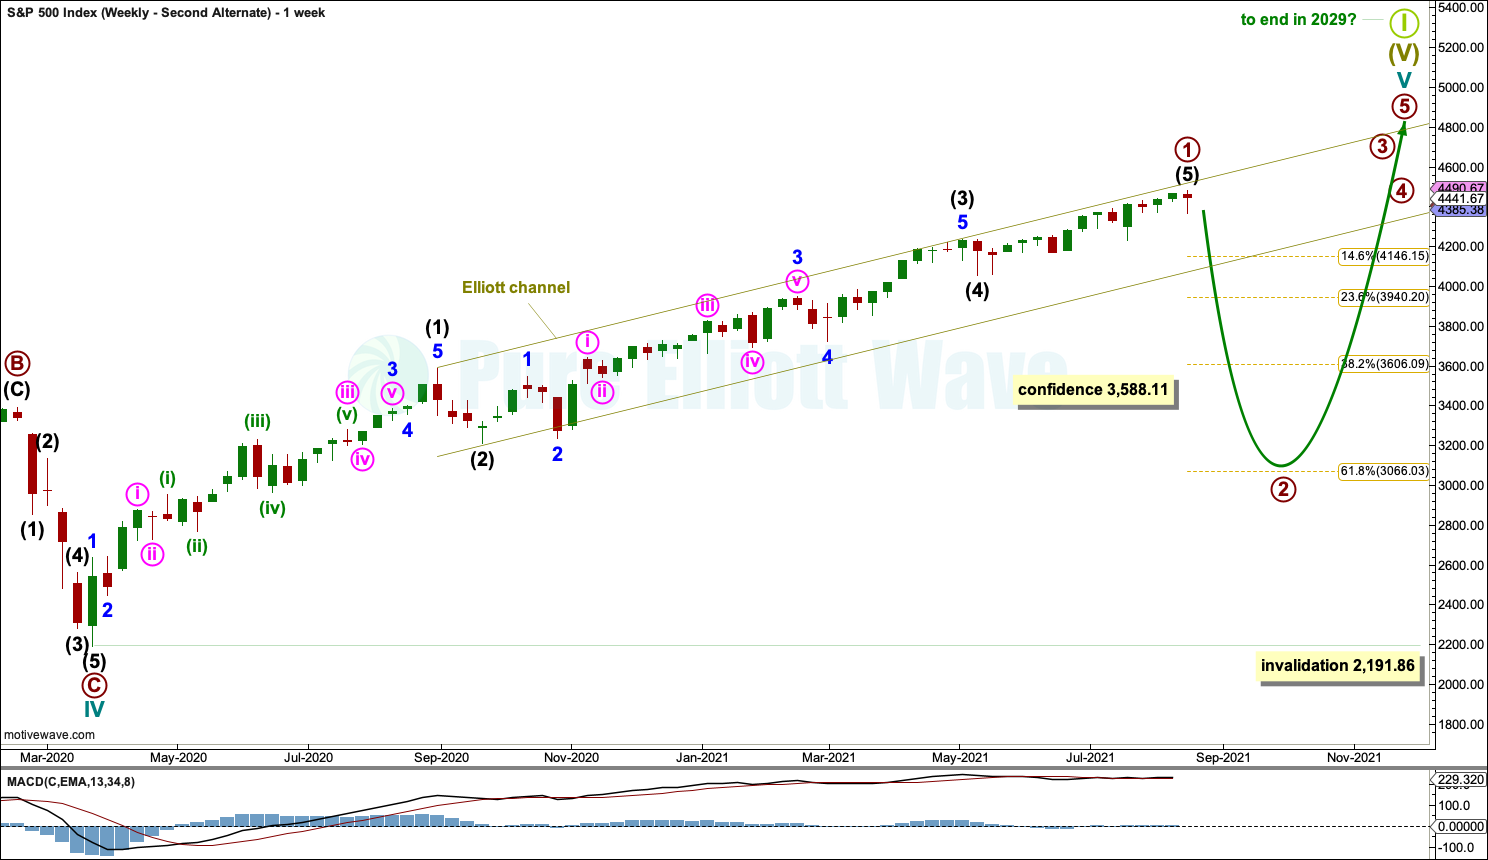
SECOND ALTERNATE
WEEKLY CHART
Click chart to enlarge.
This third alternate Elliott wave count is considered because it is technically possible. However, primary wave 2 may correct to the 0.618 Fibonacci ratio, which would be a 31.6% reduction in market value and meet the technical definition of a bear market. This is possible but has a very low probability as there is only 31 days of bearish divergence between price and the AD line. Within the last (almost) 100 years, only three bear markets have occurred following less than 4 months bearish divergence between price and the AD line. If this wave count is correct, then it would exhibit bearish divergence of less than 4 months a fourth time in almost 100 years; the probability of this alternate is rather low.
Primary wave 2 may last one to a few months. It may not move beyond the start of primary wave 1 below 2,191.86.
TECHNICAL ANALYSIS
WEEKLY CHART
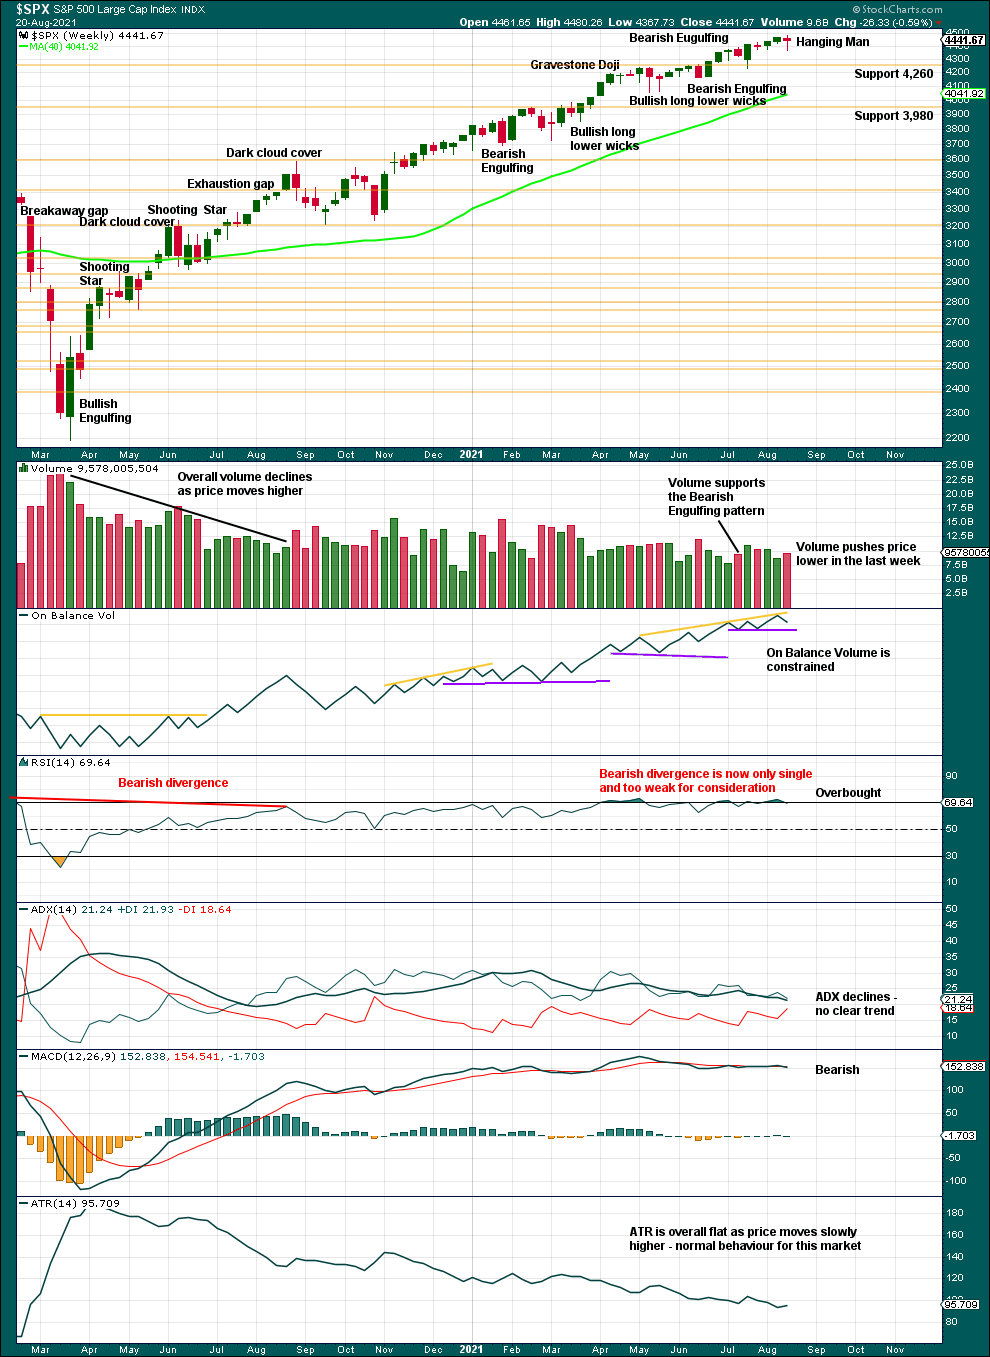
Click chart to enlarge. Chart courtesy of StockCharts.com.
Bearish divergence between price and RSI has almost disappeared. It is too small now for consideration.
A Hanging Man candlestick this week supports the main Elliott wave count or the first alternate. However, that is the only support for a short-term pullback in this chart. Overall, this chart is bullish.
DAILY CHART
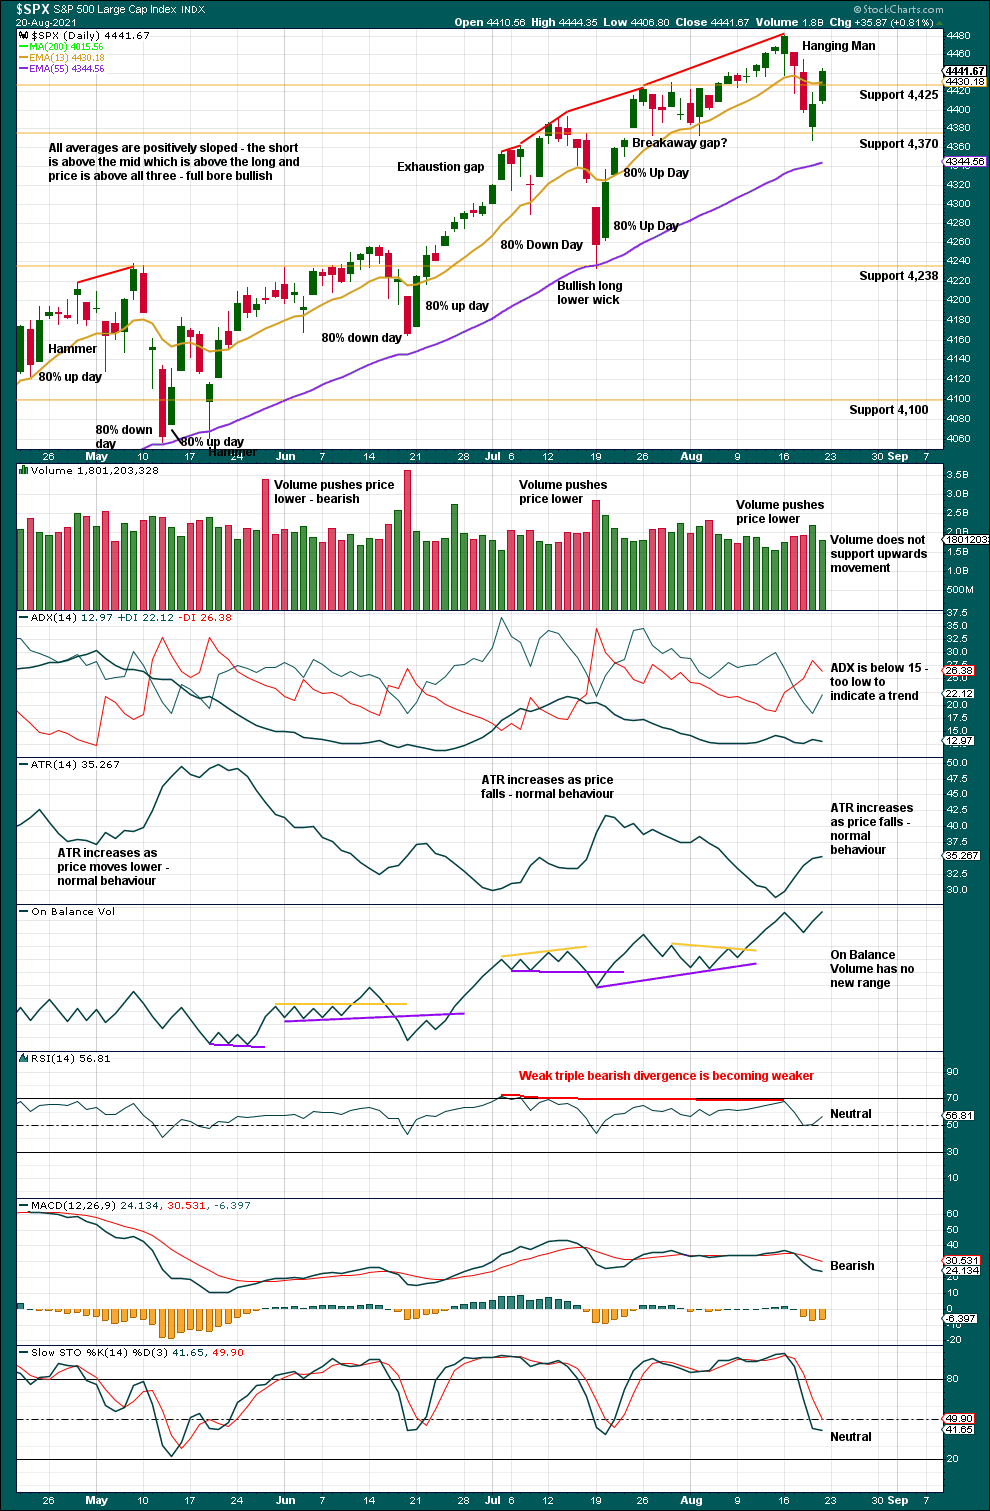
Click chart to enlarge. Chart courtesy of StockCharts.com.
The Hanging Man bearish reversal pattern receives bearish confirmation, so confidence in the reversal pattern may be had. A downwards swing could possibly be complete as Stochastics reached below 50. An upwards swing within a consolidation may have begun, or it is possible that the bull market has resumed.
There is a potential trend change to down, but no clear trend at this stage.
BREADTH – AD LINE
WEEKLY CHART
Click chart to enlarge. Chart courtesy of StockCharts.com. So that colour blind members are included, bearish signals will be noted with blue and bullish signals with yellow.
Breadth should be read as a leading indicator.
There are only 31 sessions of bearish divergence between the NYSE All Issues AD line and price. This supports the main and second alternate Elliott wave counts but not the third alternate Elliott wave count.
Large caps all time high: 4,480.26 on Aug 16, 2021.
Mid caps all time high: 2,780.08 on May 10, 2021.
Small caps all time high: 1,417.45 on June 8, 2021.
With 3 months of weakness in mid caps and 2 months of weakness in small caps, some pullback or consolidation may continue.
This week the AD line has made a new swing low below the prior low of 4-5 weeks ago, but price has not. This bearish divergence adds to a cluster of existing bearish divergence and supports either the main or first alternate Elliott wave counts.
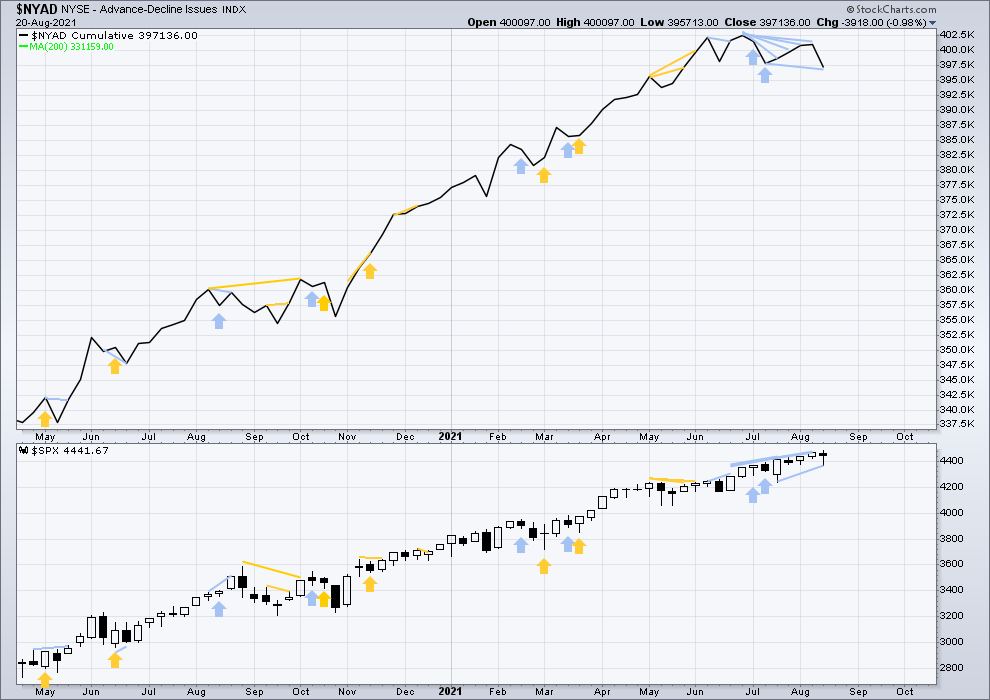
DAILY CHART
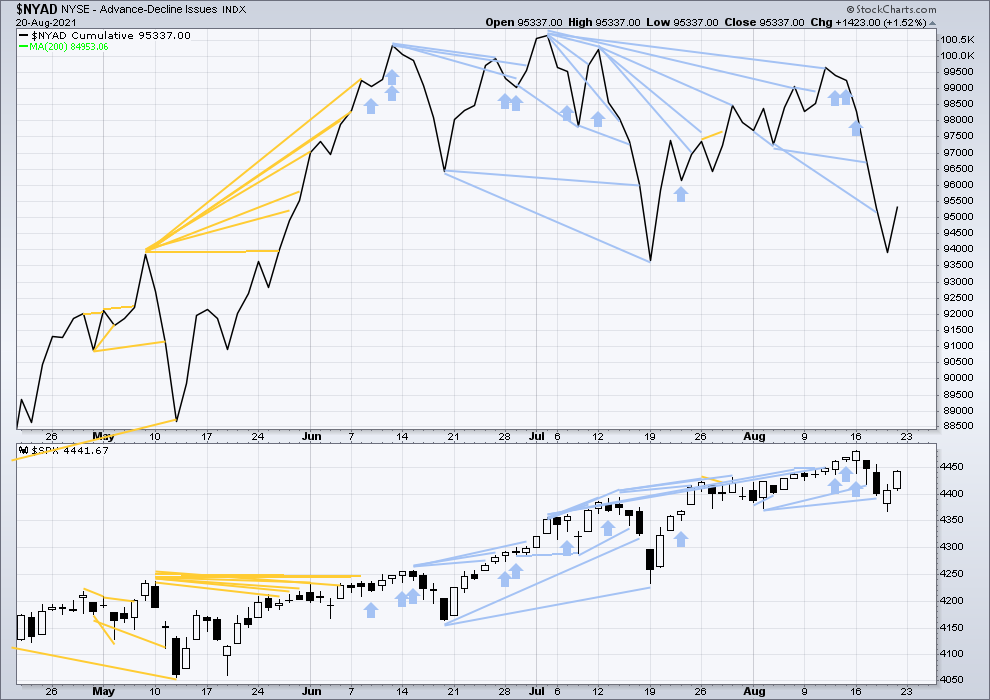
Click chart to enlarge. Chart courtesy of StockCharts.com. So that colour blind members are included, bearish signals will be noted with blue and bullish signals with yellow.
The NYSE All Issues AD line made its last all time high on July 2nd, 2021. There is over one month of bearish divergence. This suggests the market is currently vulnerable to a short-term pullback within the ongoing upwards trend. This is what the main Elliott wave count expects.
Both price and the AD line have moved higher on Friday. There is no new divergence.
A cluster of short and mid-term bearish divergence remains. This suggests further downwards or sideways movement may be required to resolve it; a pullback of just three days looks insufficient. This chart supports the main or first alternate Elliott wave counts.
VOLATILITY – INVERTED VIX CHART
WEEKLY CHART
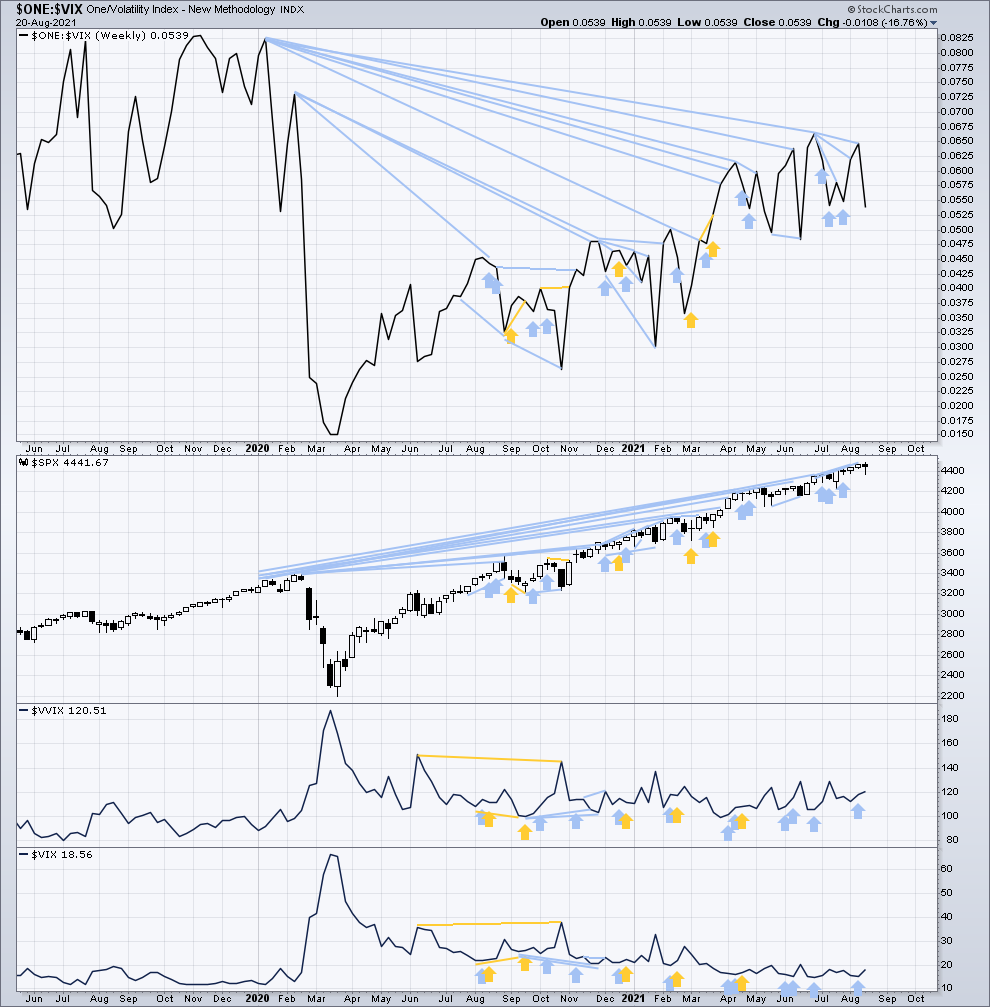
Click chart to enlarge. Chart courtesy of StockCharts.com. So that colour blind members are included, bearish signals will be noted with blue and bullish signals with yellow.
Inverted VIX remains well below all time highs. The all time high for inverted VIX was in the week beginning October 30, 2017. There is over 3 years of bearish divergence between price and inverted VIX. This bearish divergence may develop further before the bull market ends. It may be a very early indicator of an upcoming bear market, but it is not proving to be useful in timing. It may support the third alternate Elliott wave count.
Price and inverted VIX have moved lower this week. There is no new divergence. Inverted VIX still exhibits a cluster of of short, mid and long-term bearish divergence. This supports the main or either of the alternate Elliott wave counts.
Comparing VIX and VVIX at the weekly chart level:
This week both VIX and VVIX have moved higher. There is no new divergence.
DAILY CHART
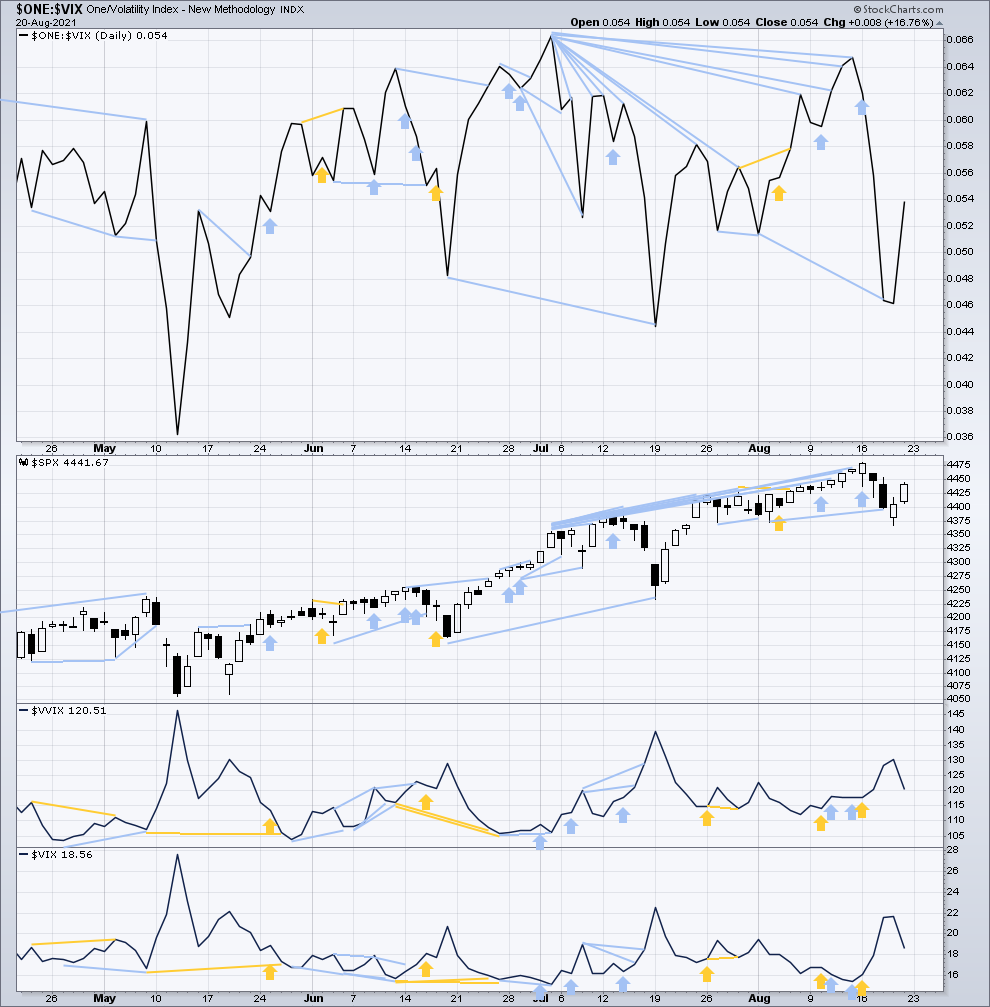
Click chart to enlarge. Chart courtesy of StockCharts.com. So that colour blind members are included, bearish signals will be noted with blue and bullish signals with yellow.
Both price and inverted VIX have moved higher on Friday. There is no new divergence.
A cluster of short, mid and long-term divergence supports either the main, first alternate or second alternate Elliott wave counts.
Comparing VIX and VVIX at the daily chart level:
Both VIX and VVIX have declined today. There is no new divergence.
DOW THEORY
Dow Theory confirms a new bull market with new highs made on a closing basis:
DJIA: 29,568.57 – closed above on 16th November 2020.
DJT: 11,623.58 – closed above on 7th October 2020.
Most recently, on 10th May 2021 both DJIA and DJT have made new all time highs. An ongoing bull market is again confirmed by Dow Theory.
Adding in the S&P and Nasdaq for an extended Dow Theory, confirmation of a bull market would require new highs made on a closing basis:
S&P500: 3,393.52 – closed above on 21st August 2020.
Nasdaq: 9,838.37 – closed above on June 8, 2020.
The following major swing lows would need to be seen on a closing basis for Dow Theory to confirm a change from bull to a bear market:
DJIA: 18,213.65
DJT: 6,481.20
Adding in the S&P and Nasdaq for an extended Dow Theory, confirmation of a new bear market would require new lows on a closing basis:
S&P500: 2,191.86
Nasdaq: 6,631.42
Published @ 08:35 p.m. ET.
—
Careful risk management protects your trading account(s).
Follow my two Golden Rules:
1. Always trade with stops.
2. Risk only 1-5% of equity on any one trade.
—
New updates to this analysis are in bold.
—