by Lara | May 1, 2020 | S&P 500, S&P 500 + DJIA
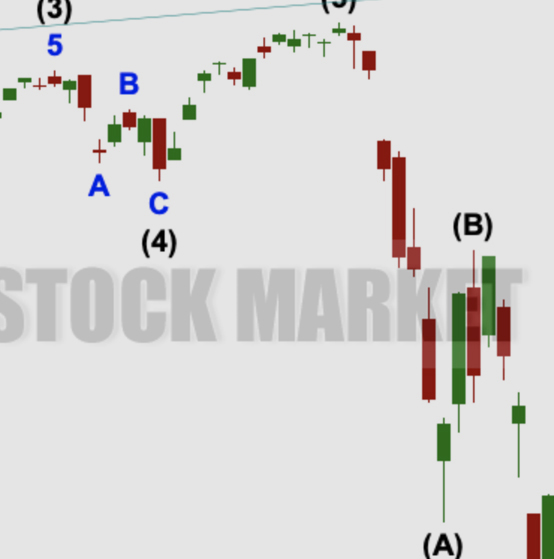
S&P 500: Elliott Wave and Technical Analysis | Charts – May 1, 2020 Downwards movement to end the week has been enough to invalidate a short-term alternate Elliott wave count and provide some confidence in the main short-term Elliott wave count. Summary: A...
by Lara | Apr 30, 2020 | S&P 500, S&P 500 + DJIA
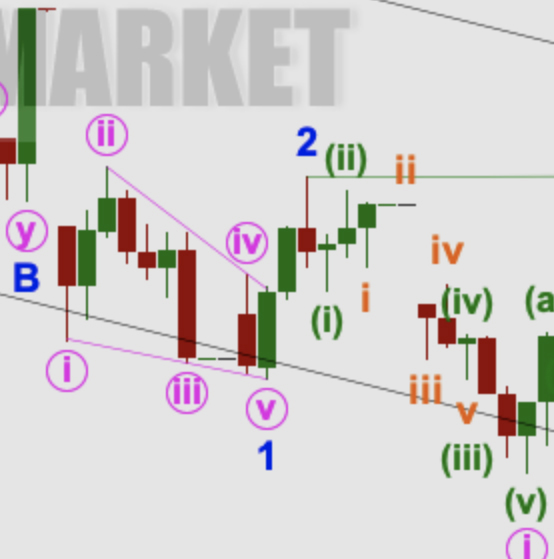
S&P 500: Elliott Wave and Technical Analysis | Charts – April 30, 2020 The main Elliott wave count expected some downwards movement, which is what has happened. Both the main and alternate short-term Elliott wave counts will reman valid while price remains within...
by Lara | Apr 29, 2020 | S&P 500, S&P 500 + DJIA
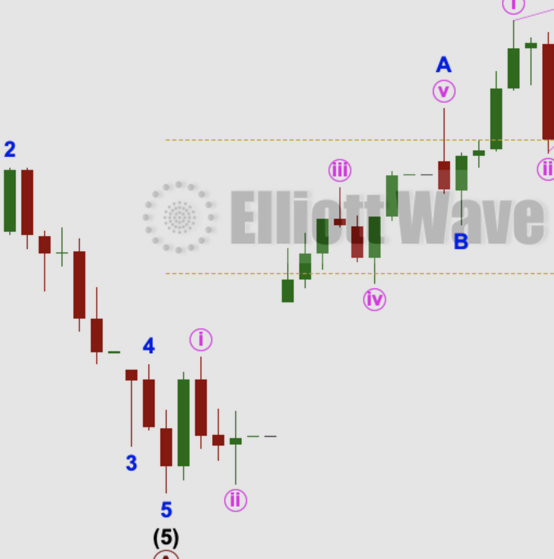
S&P 500: Elliott Wave and Technical Analysis | Charts – April 29, 2020 A short-term target was at 2,956. Today more upwards movement has reached up to 2,954.86, just 1.14 points short of the target. Summary: A downwards or sideways movement may develop here,...
by Lara | Apr 28, 2020 | S&P 500, S&P 500 + DJIA
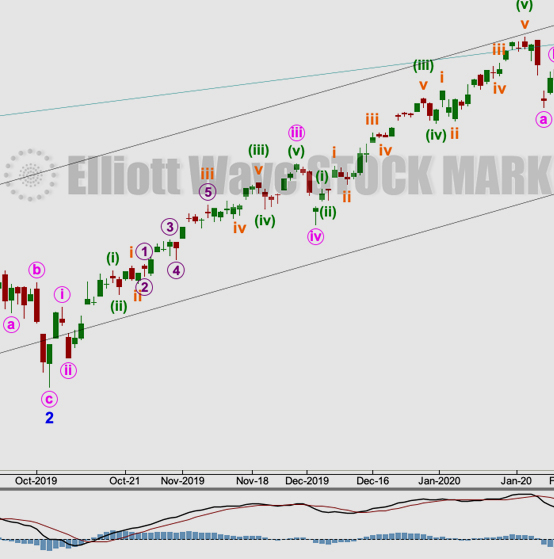
S&P 500: Elliott Wave and Technical Analysis | Charts – April 28, 2020 Another upwards day continues a multi-week bounce, which is what this analysis has been expecting. Summary: A new short-term target for intermediate wave (A) to end is at 2,956. About this...
by Lara | Apr 27, 2020 | S&P 500, S&P 500 + DJIA
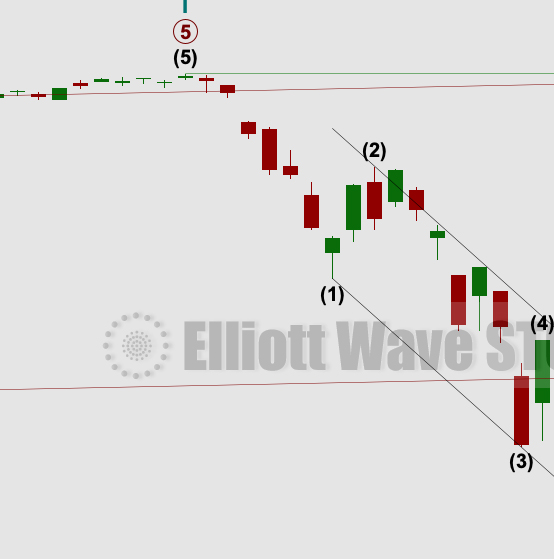
S&P 500: Elliott Wave and Technical Analysis | Charts – April 27, 2020 This analysis has expected since the close of the 24th of March session upwards movement to continue, which it has. Summary: The bounce may now end about 3,069 to 3,261. Thereafter, the...

by Lara | Apr 24, 2020 | Gold, Lara's Weekly, S&P 500, US Oil
Lara’s Weekly: Elliott Wave and Technical Analysis of S&P500 and Gold and US Oil | Charts – April 24, 2020 Commentary and charts of Lara’s Weekly, an end of week Elliott Wave and Technical Analysis of the S&P 500 and GOLD and USOIL, for week...
by Lara | Apr 24, 2020 | S&P 500, S&P 500 + DJIA
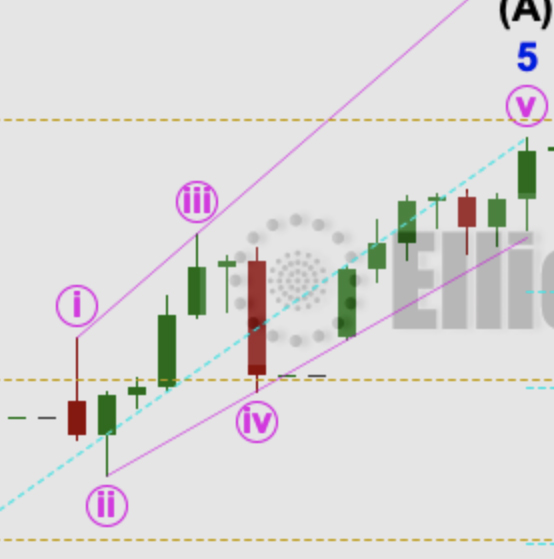
S&P 500: Elliott Wave and Technical Analysis | Charts – April 24, 2020 Sideways movement this week sees price remain within the channel and above the invalidation point. The target zone remains the same. Summary: The bounce may now end about 3,069 to 3,261....
by Lara | Apr 23, 2020 | Public Analysis, TSLA
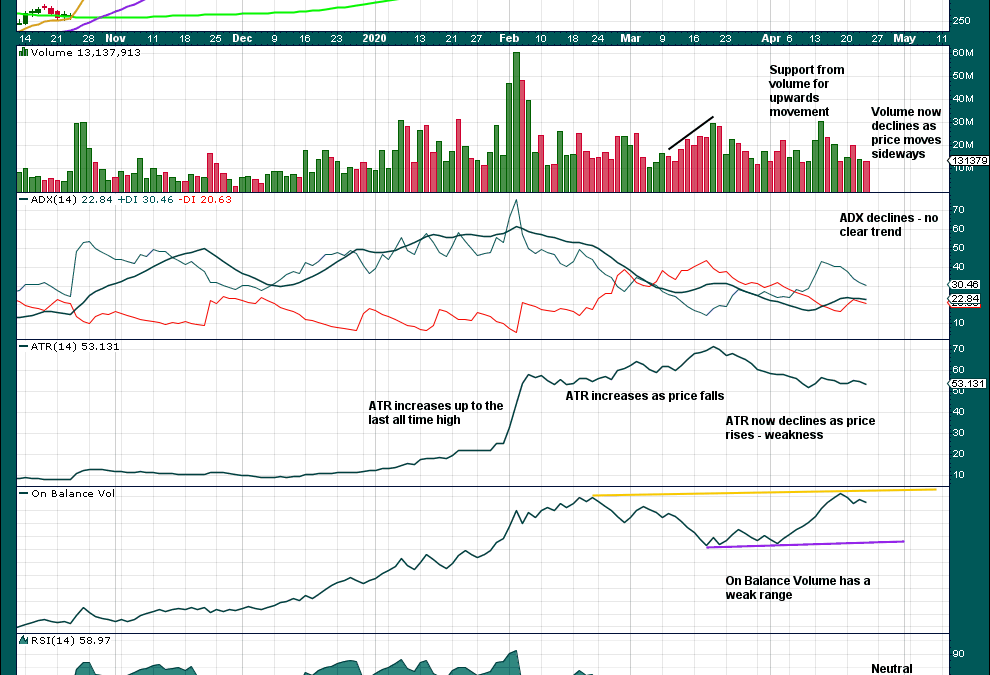
TSLA: Technical Analysis | Charts – April 23, 2020 It is possible that TSLA may have a sustainable high in place. Summary: There is reasonable risk here of more downwards movement. A new low below 652 would indicate a bounce may be over. However, expect more upwards...
by Lara | Apr 23, 2020 | NVDA, Public Analysis
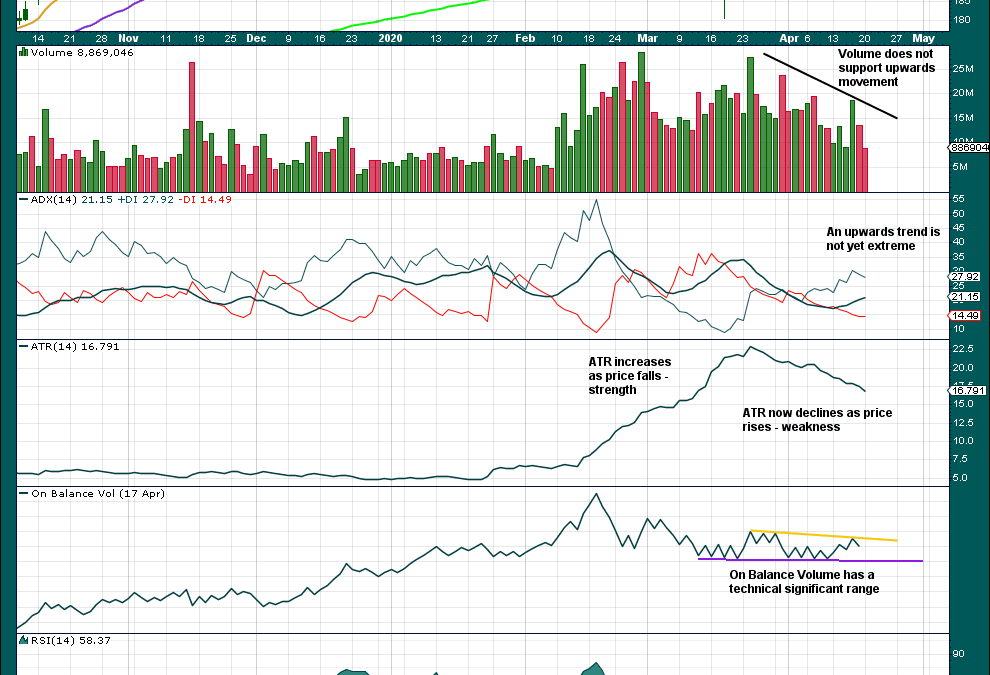
NVDA: Technical Analysis | Charts – April 23, 2020 For the short term, expect more upwards movement while price remains above 284.17. Summary: There is enough weakness at the all time high and in this upwards movement, and strength in prior downwards movement, to...


