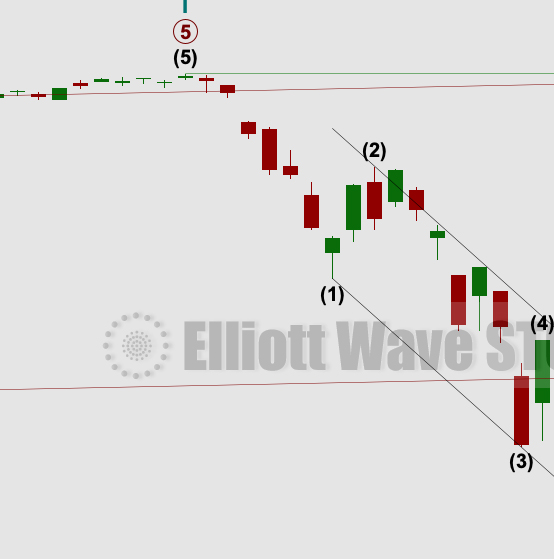
by Lara | Jul 22, 2020 | S&P 500, S&P 500 + DJIA
S&P 500: Elliott Wave and Technical Analysis | Charts – July 22, 2020 A target is now calculated for upwards movement to end for the main wave count. Summary: A short-lived upwards breakout may continue for another one to few days, before a trend change. The...

by Lara | Jul 22, 2020 | Trading Tips
MotiveWave is having a Summer Sale for 7 DAYS ONLY starting Tuesday, July 21, 2020, with 25% off most products.* This means 25% off Lifetime Licenses, 25% off Leases, 25% off Instalment Plans, and 25% off Add-On Modules.* This sale is for 7 days only! Sale ends...
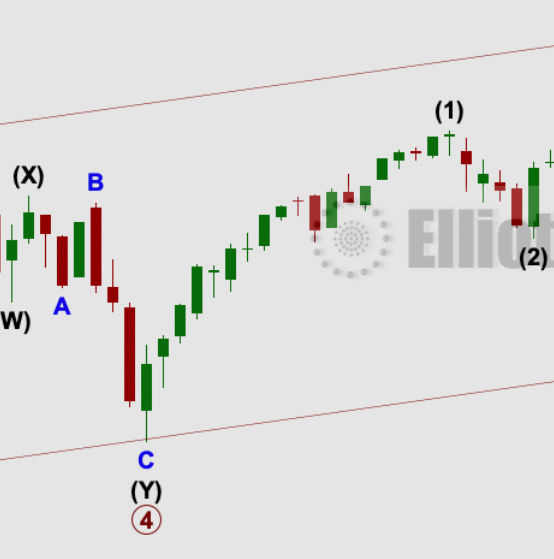
by Lara | Jul 21, 2020 | S&P 500, S&P 500 + DJIA
S&P 500: Elliott Wave and Technical Analysis | Charts – July 21, 2020 Another upwards day continues as expected. Summary: A short-lived upwards breakout may continue for another one to few days, before a trend change. The upwards breakout may not make a new all...
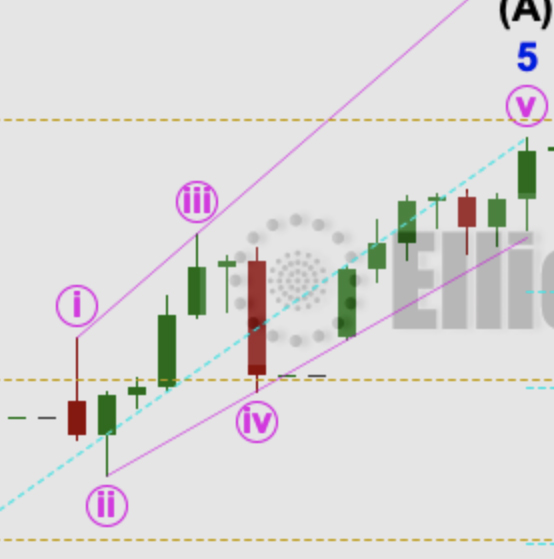
by Lara | Jul 20, 2020 | S&P 500, S&P 500 + DJIA
S&P 500: Elliott Wave and Technical Analysis | Charts – July 20, 2020 Today price has closed to a new swing high, but volume and breadth suggest weakness. Summary: A short-lived upwards breakout may continue for another one to very few days, before a trend...

by Lara | Jul 17, 2020 | Gold, Lara's Weekly, S&P 500, US Oil
Lara’s Weekly: Elliott Wave and Technical Analysis of S&P500 and Gold and US Oil | Charts – July 17, 2020 Commentary and charts of Lara’s Weekly, an end of week Elliott Wave and Technical Analysis of the S&P 500 and GOLD and USOIL, for week...
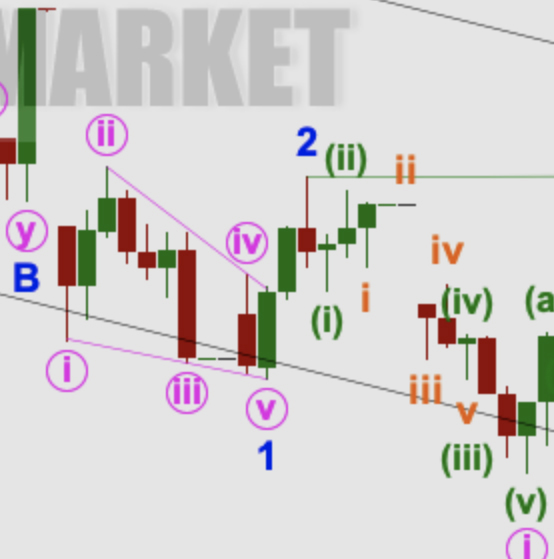
by Lara | Jul 17, 2020 | S&P 500, S&P 500 + DJIA
S&P 500: Elliott Wave and Technical Analysis | Charts – July 17, 2020 Sideways movement ends the week and sees the Elliott wave count remain the same. Summary: Sideways movement may continue next week. It may then be followed by a short lived upwards breakout...
by Lara | Jul 17, 2020 | Public Analysis, TSLA
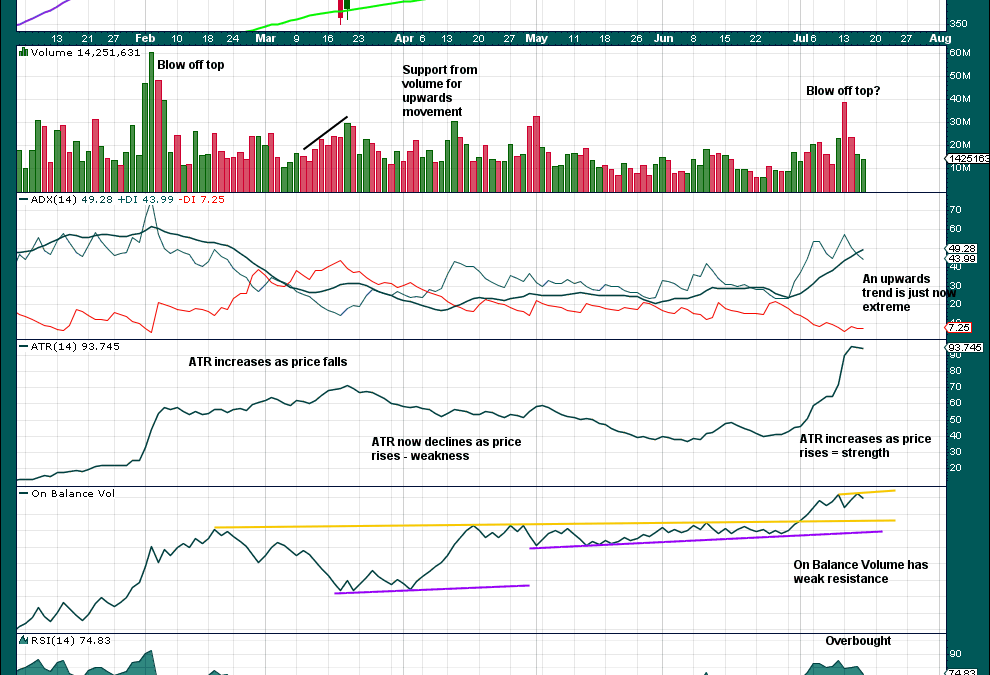
TSLA: Technical Analysis | Charts – July 16, 2020 Summary: While price remains above 1,228, it may be safest to assume the upwards trend remains intact. A target calculated from a pennant pattern is at 2,393. MONTHLY CHART Click chart to enlarge. Longer-term bearish...
by Lara | Jul 16, 2020 | S&P 500, S&P 500 + DJIA
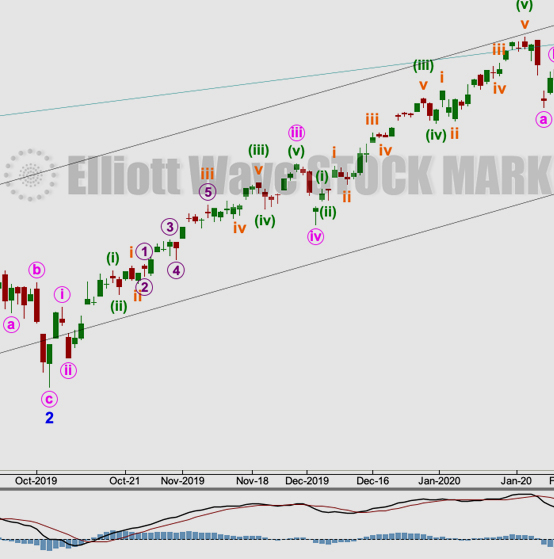
S&P 500: Elliott Wave and Technical Analysis | Charts – July 16, 2020 A very small range downwards day remains above support and above the short-term invalidation point for the Elliott wave count. Summary: A target for upwards movement to end is now at 3,245. The...

by Lara | Jul 15, 2020 | S&P 500, S&P 500 + DJIA
S&P 500: Elliott Wave and Technical Analysis | Charts – July 15, 2020 Price continues higher, but the AD line and inverted VIX have not made corresponding highs. Summary: A target for upwards movement to end is now at 3,247. The main wave count has two final...


