Last analysis expected a pullback or consolidation to begin the new trading week. A red daily candlestick fits this expectation perfectly.
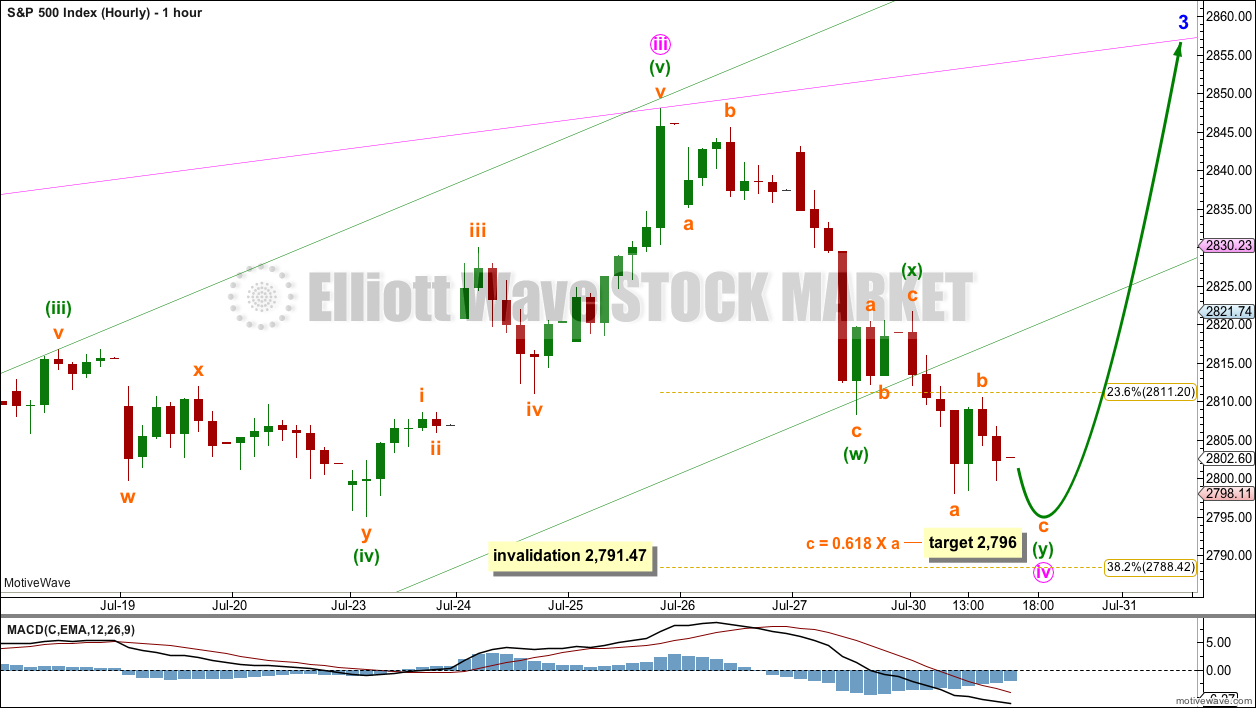
Summary: Expect that a shallow consolidation is most likely unfolding while price remains above 2,791.47. Expect the consolidation to continue a little lower tomorrow and maybe thereafter to continue sideways for a few days.
A new low below 2,791.47 would indicate a deeper pullback may continue. The target for it to end would then be about 2,752.
The bigger picture remains extremely bullish.
The next target is about 2,915, where another consolidation to last about two weeks may be expected.
The invalidation point remains at 2,743.26.
The mid to longer term target is at 2,922 (Elliott wave) or 3,045 (classic analysis). Another multi week to multi month correction is expected at one of these targets.
The final target for this bull market to end remains at 3,616.
Always practice good risk management. Always trade with stops and invest only 1-5% of equity on any one trade.
New updates to this analysis are in bold.
The biggest picture, Grand Super Cycle analysis, is here.
Last historic analysis with monthly charts is here, video is here.
ELLIOTT WAVE COUNT
WEEKLY CHART
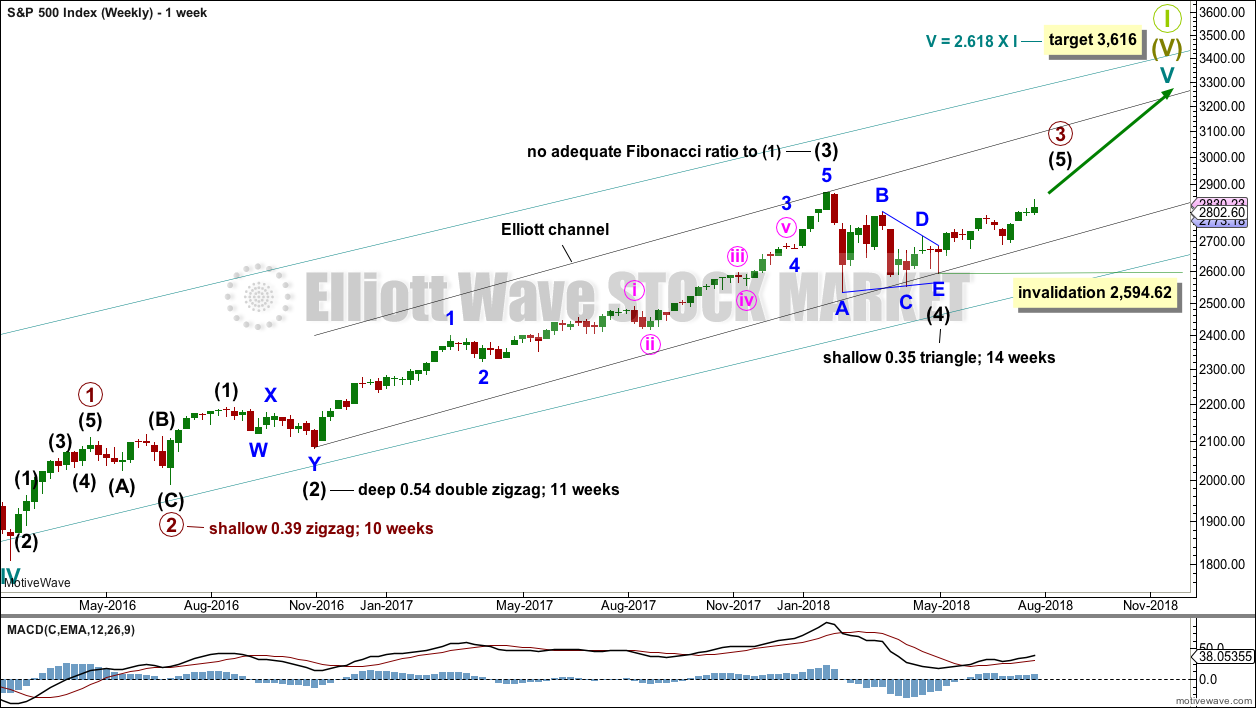
Cycle wave V must complete as a five structure, which should look clear at the weekly chart level and also now at the monthly chart level. It may only be an impulse or ending diagonal. At this stage, it is clear it is an impulse.
Within cycle wave V, the third waves at all degrees may only subdivide as impulses.
Intermediate wave (4) has breached an Elliott channel drawn using Elliott’s first technique. The channel is redrawn using Elliott’s second technique: the first trend line from the ends of intermediate waves (2) to (4), then a parallel copy on the end of intermediate wave (3). Intermediate wave (5) may end either midway within the channel, or about the upper edge.
Intermediate wave (4) may now be a complete regular contracting triangle lasting fourteen weeks, one longer than a Fibonacci thirteen. There is perfect alternation and excellent proportion between intermediate waves (2) and (4).
Within intermediate wave (5), no second wave correction may move beyond the start of its first wave below 2,594.62. However, the lower edge of the black Elliott channel drawn across the ends of intermediate degree waves should provide very strong support for any deeper pullbacks, holding price well above the invalidation point while intermediate wave (5) unfolds.
At this stage, the expectation is for the final target to me met in October 2019.
A multi week to multi month consolidation for primary wave 4 is expected on the way up to the final target.
The last bullish fifth wave of minor wave 5 to end intermediate wave (3) exhibited commodity like behaviour. It was strong and sustained. It is possible that the upcoming wave of minor wave 5 to end intermediate wave (5) to end primary wave 3 may exhibit similar behaviour, so we should be on the lookout for this possibility.
DAILY CHART
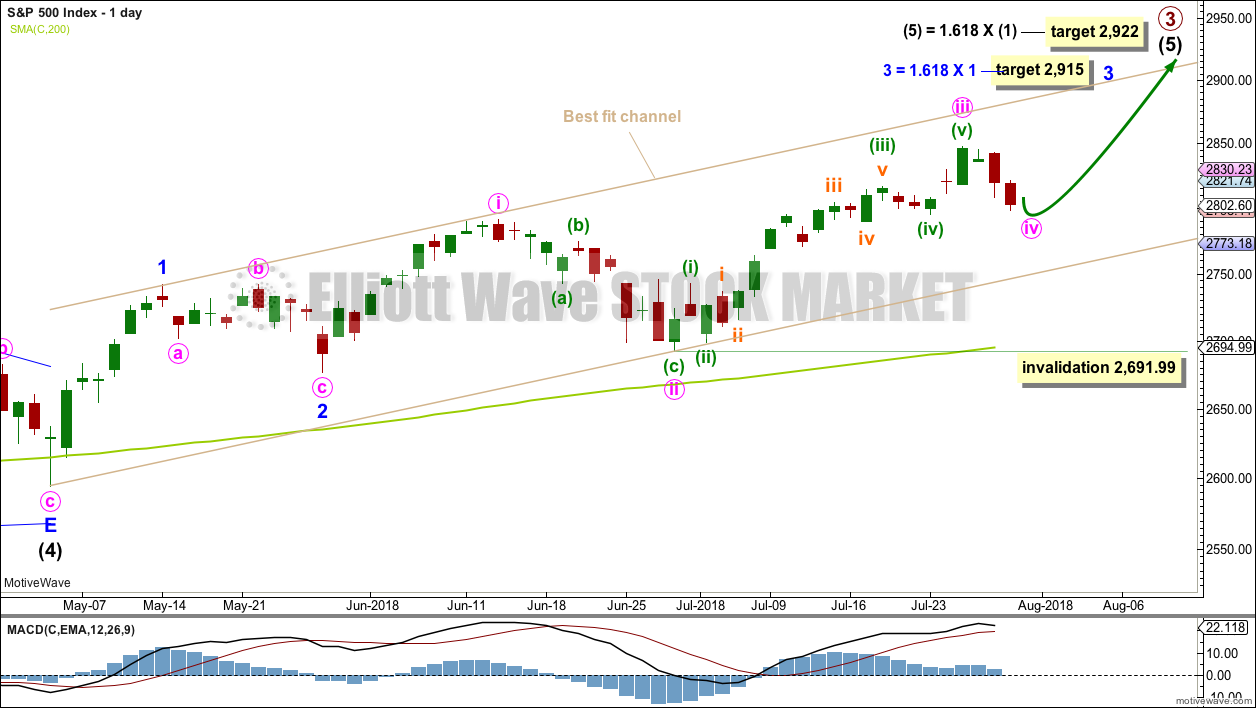
Intermediate wave (5) would be very likely to make at least a slight new high above the end of intermediate wave (3) at 2,872.87 to avoid a truncation.
Intermediate wave (3) exhibits no Fibonacci ratio to intermediate wave (1). It is more likely then that intermediate wave (5) may exhibit a Fibonacci ratio to either of intermediate waves (1) or (3). The most common Fibonacci ratio would be equality in length with intermediate wave (1), but in this instance that would expect a truncation. The next common Fibonacci ratio is used to calculate a target for intermediate wave (5) to end.
It is possible that minute wave iii could be over at last week’s high; if it is complete here, it would not exhibit a Fibonacci ratio to minute wave i. If minute wave iv unfolds here, then it must be very shallow to remain above minute wave i price territory at 2,791.47.
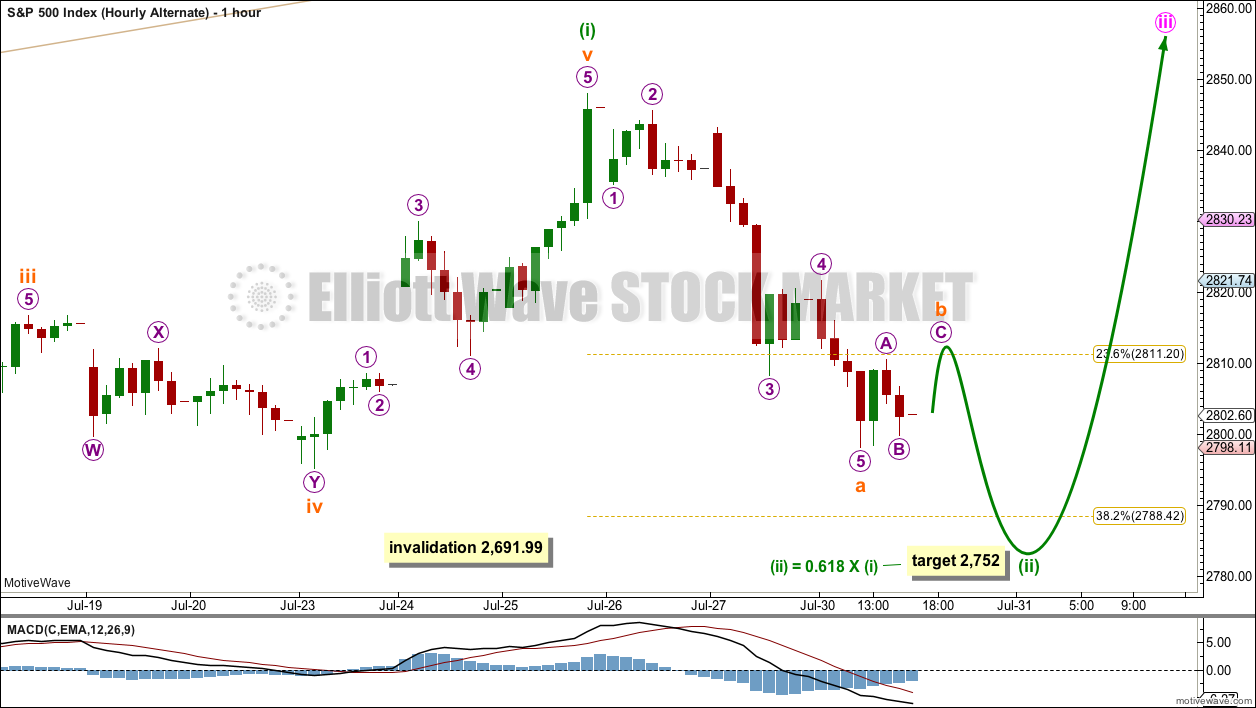
If downwards movement continues below 2,791.47, then the best alternate idea would be to move the degree of labelling within minute wave iii all down one degree and see only minuette wave (i) within minute wave iii complete at the last high. Downwards movement would then be labelled minuette wave (ii), which may not move beyond the start of minuette wave (i) below 2,691.99. However, downwards movement should find support reasonably above the invalidation point at support about the lower edge of the best fit channel.
A target is calculated for minor wave 3 to end, which expects to see the most common Fibonacci ratio to minor wave 1. Minor wave 3 may last several weeks in total and should look like an impulse at the daily chart level. When it is complete, then minor wave 4 may last about one to two weeks in order for it to exhibit reasonable proportion to minor wave 2. Minor wave 4 must remain above minor wave 1 price territory.
A best fit channel is added in taupe to this chart. It contains all of intermediate wave (5) so far. The lower edge may provide support for any deeper pullbacks. The upper edge may provide resistance.
MAIN HOURLY CHART
If minute wave iii was over at the last high, then there are reasonable Fibonacci ratios within it.
Minute wave ii was a very deep 0.87 single zigzag lasting 11 sessions. Minute wave iv may be a very shallow sideways type of correction: a flat, combination or triangle. These would exhibit alternation with minute wave ii.
All of a flat, combination or triangle may include a new high above the start of minute wave iv at 2,848.03, as in an expanded flat, running triangle or wave X of a combination. There is no upper invalidation point for this reason.
Minute wave iv may not move into minute wave i price territory below 2,791.47.
So far minute wave iv is labelled as an almost complete double zigzag. This would offer very little alternation in structure with minute wave ii, but would still offer good alternation in depth.
The labelling within minute wave iv may also be moved down one degree: a double zigzag may be wave A of a triangle or flat correction.
ALTERNATE HOURLY CHART
This alternate wave count moves the degree of labelling within minute wave iii all down one degree.
If minuette wave (i) was over at the last high, then downwards movement of the last two sessions may be the start of minuette wave (ii). A target for minuette wave (ii) would reasonably be the 0.618 Fibonacci ratio of minuette wave (i) about 2,752. However, if this target is wrong, it may be a little too low. There may be support just above this point at the lower edge of the best fit channel, which is seen on the daily chart.
Minuette wave (ii) may not move beyond the start of minuette wave (i) below 2,691.99.
TECHNICAL ANALYSIS
WEEKLY CHART
Click chart to enlarge. Chart courtesy of StockCharts.com.
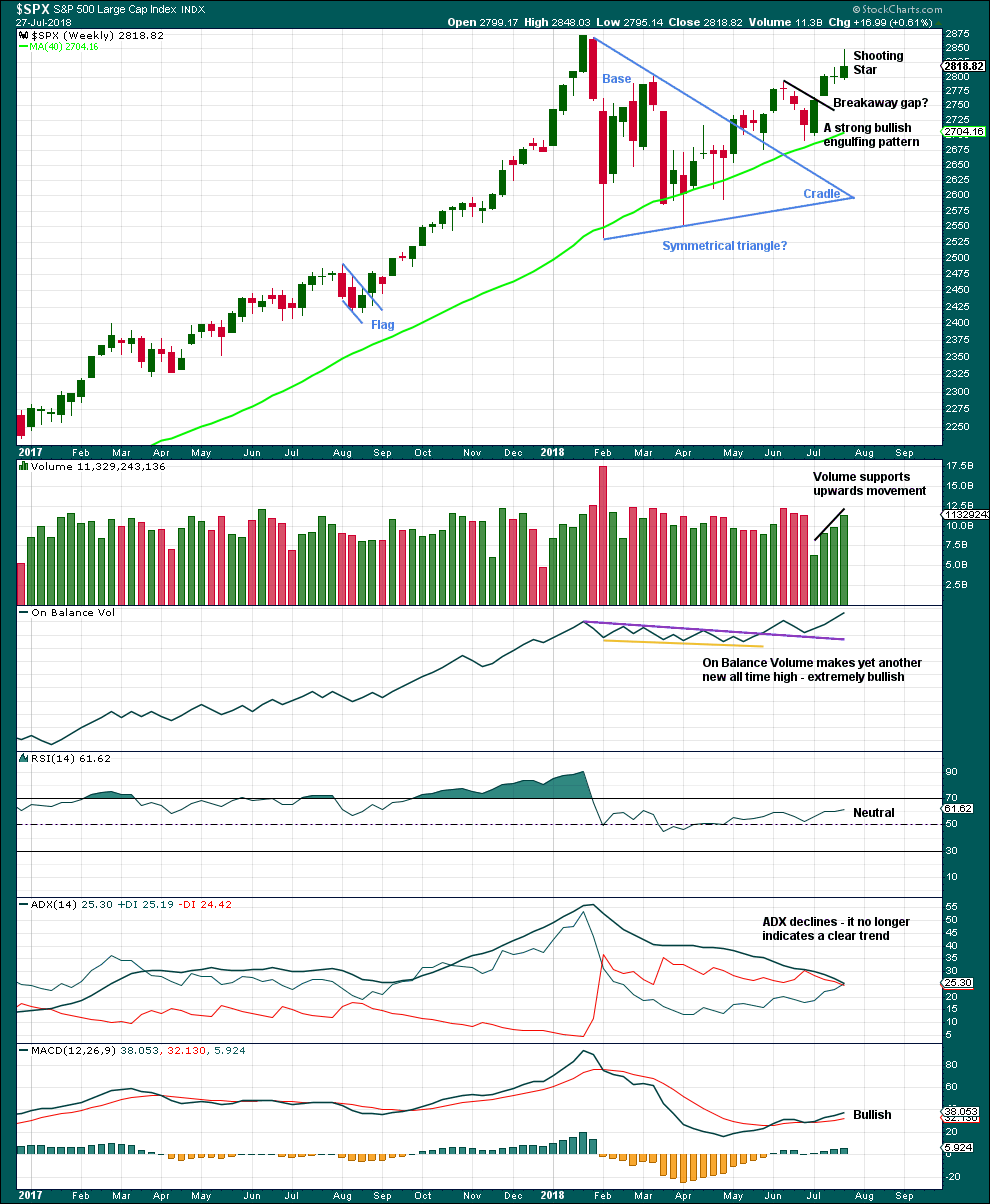
Recent new highs for On Balance Volume remains very bullish indeed, but that does not preclude another reasonable pullback within this developing upwards trend. It is still expected that price is very likely to make new all time highs, but it will not move in a straight line.
A Doji candlestick followed now by a Shooting Star, which did not gap higher, is reasonably bearish for the short term. A pullback or small consolidation may result.
Bullish volume and another new all time high from On Balance Volume are very strong bullish signals.
DAILY CHART
Click chart to enlarge. Chart courtesy of StockCharts.com.
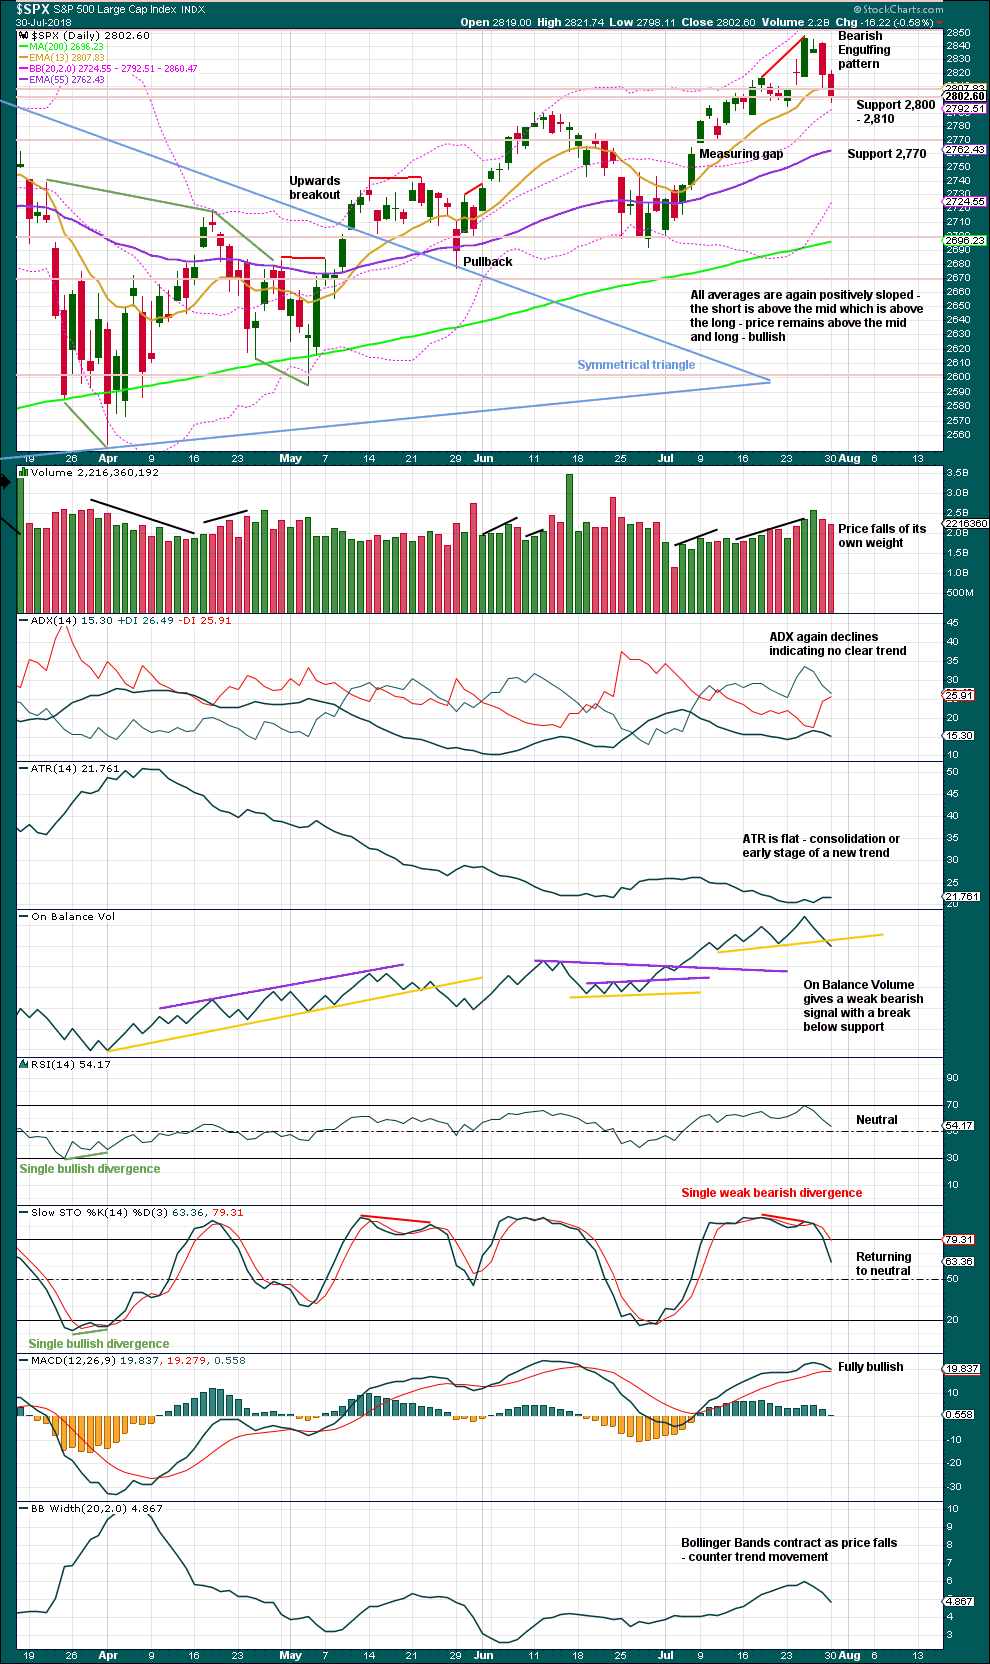
The symmetrical triangle may now be complete. The base distance is 340.18. Added to the breakout point of 2,704.54 this gives a target at 3,044.72. This is above the Elliott wave target at 2,922, so the Elliott wave target may be inadequate.
Since the low on the 2nd of April, 2018, price has made a series of higher highs and higher lows. This is the definition of an upwards trend. But trends do not move in perfectly straight lines; there are pullbacks and bounces along the way.
Stochastics may remain overbought for reasonable periods of time when this market has a strong bull run.
This bull run now has some support from volume and strong support from On Balance Volume making new all time highs.
RSI is almost overbought, and it can remain there for long periods of time for this market.
Monday’s session failed to close below support about 2,800. If tomorrow continues lower, then first support is about 2,770 and next support is with the measuring gap at 2,764.41.
Volume does not support downwards movement, but the market can fall of its own weight for a reasonable distance. The signal from On Balance Volume is weak because the trend line breached today has only two prior anchor points.
Overall, this looks very much like a pullback within an ongoing upwards trend. If price continues lower, then expect it may end when price is at support and Stochastics is oversold at the same time.
VOLATILITY – INVERTED VIX CHART
WEEKLY CHART
Click chart to enlarge. Chart courtesy of StockCharts.com. So that colour blind members are included, bearish signals
will be noted with blue and bullish signals with yellow.
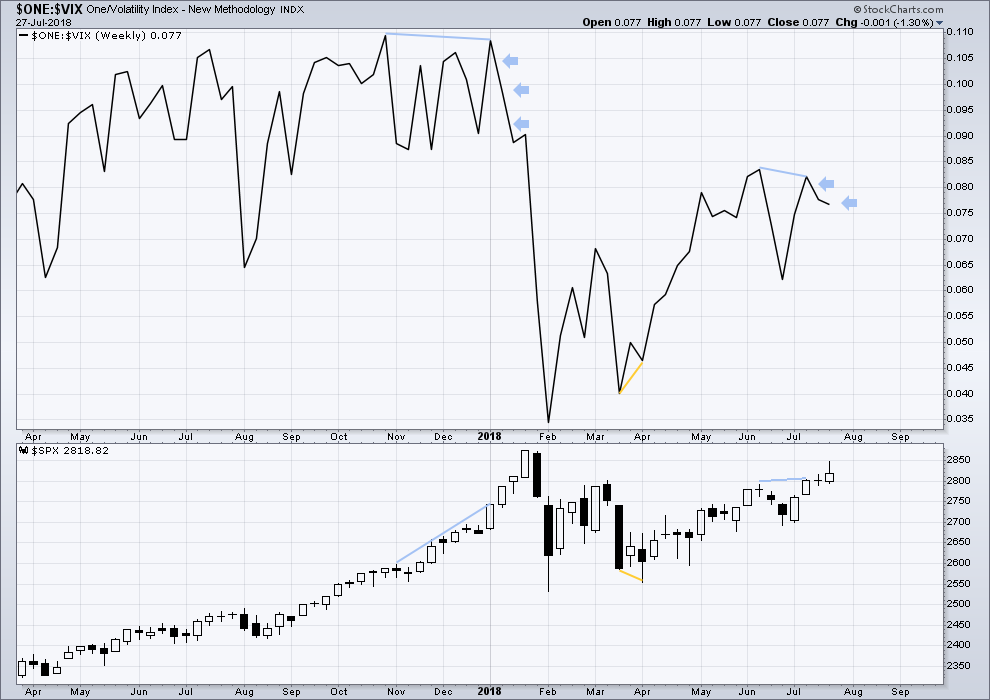
To keep an eye on the all time high for inverted VIX a weekly chart is required at this time.
Notice how inverted VIX has very strong bearish signals four weeks in a row just before the start of the last large fall in price. At the weekly chart level, this indicator may be useful again in warning of the end of primary wave 3.
There is bearish divergence at this time between swing highs of inverted VIX and price, and now two weeks in a row of upwards movement from price and downwards movement from inverted VIX. This is now a reasonable warning of a possible pullback or consolidation, but it is not as strong a warning as that back in January. The last two weeks of upwards movement in price is not particularly strong (completing a Doji and a Shooting Star, not strong upwards candlesticks), so this divergence is not as significant.
DAILY CHART
Click chart to enlarge. Chart courtesy of StockCharts.com. So that colour blind members are included, bearish signals
will be noted with blue and bullish signals with yellow.
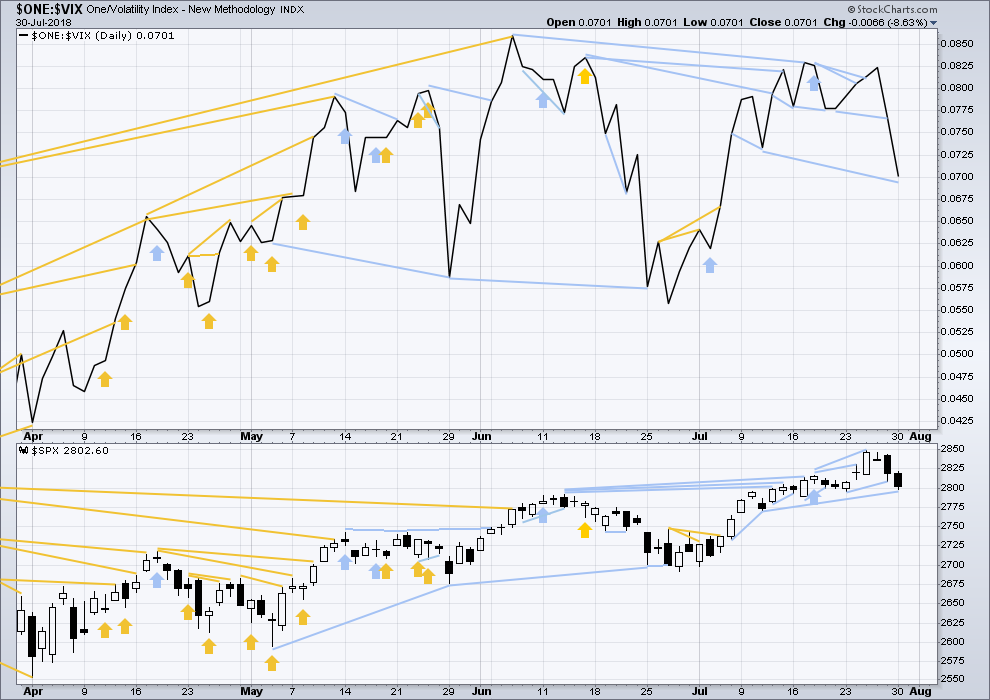
Normally, volatility should decline as price moves higher and increase as price moves lower. This means that normally inverted VIX should move in the same direction as price.
Bearish divergence is being followed by downwards movement. There is new mid term bearish divergence today: inverted VIX has made a strong new low below the prior low of the 11th of July, but price has not.
BREADTH – AD LINE
WEEKLY CHART
Click chart to enlarge. Chart courtesy of StockCharts.com.
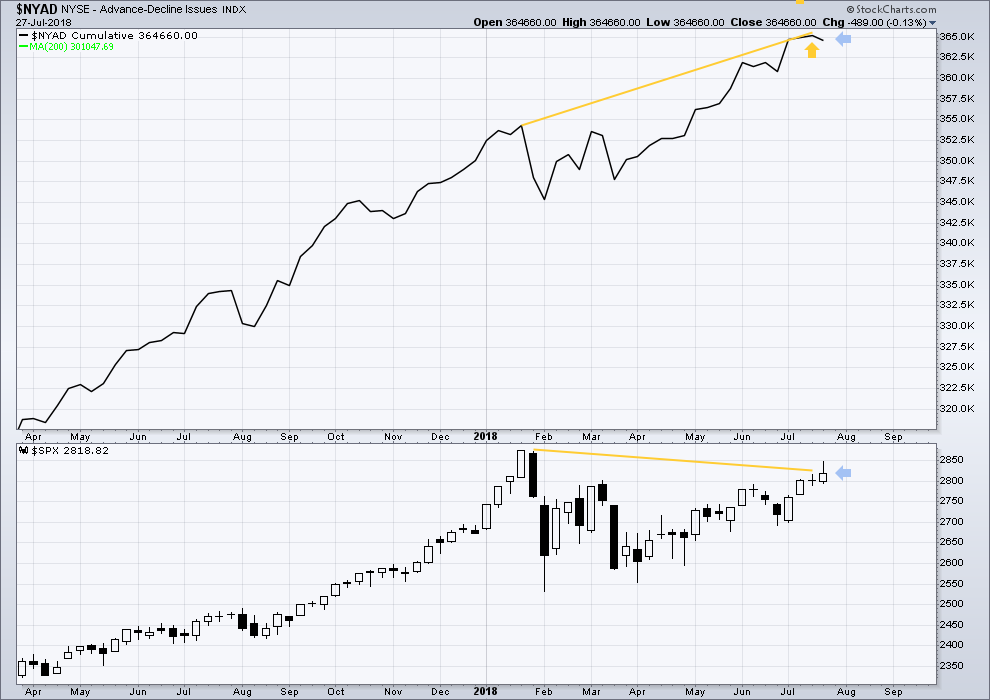
When primary wave 3 comes to an end, it may be valuable to watch the AD line at the weekly time frame as well as the daily.
At this stage, there is very strong bullish divergence between price and the AD line at the weekly time frame. With the AD line making new all time highs, expect price to follow through with new all time highs in coming weeks.
Price moved higher last week, but the AD line moved lower. This single week divergence is bearish for the short term.
DAILY CHART
Click chart to enlarge. Chart courtesy of StockCharts.com.
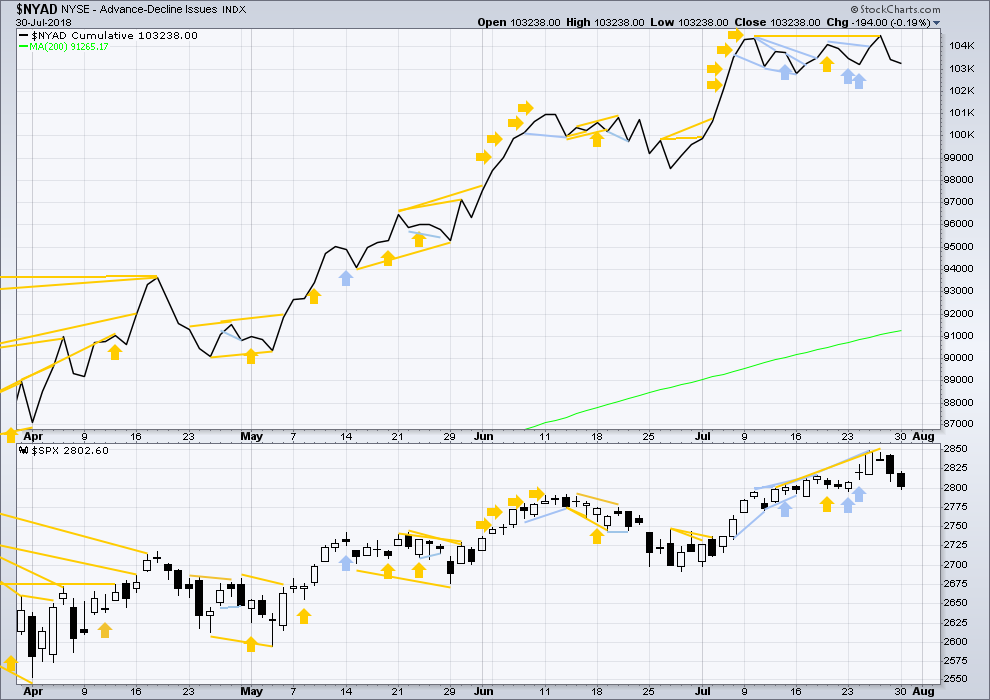
There is normally 4-6 months divergence between price and market breadth prior to a full fledged bear market. This has been so for all major bear markets within the last 90 odd years. With no longer term divergence yet at this point, any decline in price should be expected to be a pullback within an ongoing bull market and not necessarily the start of a bear market. New all time highs from the AD line means that any bear market may now be an absolute minimum of 4 months away. It may of course be a lot longer than that. My next expectation for the end of this bull market may now be October 2019.
Breadth should be read as a leading indicator.
A new all time high from the AD line on Thursday remains very bullish. For the short term, there is still no bearish divergence between price and the AD line at the daily chart time frame.
Small caps have made another slight new all time on Friday. Mid caps made a new all time high on the 10th of July. Only large caps have to follow through; they do usually lag in the latter stages of a bull market.
DOW THEORY
The following lows need to be exceeded for Dow Theory to confirm the end of the bull market and a change to a bear market:
DJIA: 23,360.29.
DJT: 9,806.79.
S&P500: 2,532.69.
Nasdaq: 6,630.67.
Only Nasdaq at this stage is making new all time highs, with another new all time high on Friday of last week. DJIA and DJT need to make new all time highs for the ongoing bull market to be confirmed.
Charts showing each prior major swing low used for Dow Theory may be seen at the end of this analysis here.
Published @ 09:11 p.m. EST.

updated hourly chart:
minute iv may have morphed into a double combination. so only one slight new low needed to end it.
I’ll also consider it could be over if upwards movement today shows strength.
and just in case anyone was wondering….
within the zigzag labelled minuette (w), on the five minute chart I can see subminuette c as a very nice five wave impulse.
Since you asked, and seeing I am also in such a generous move today, here is my best short term trading signal.
A cross of the 50 and 200 hour MAs.
The banksters GENERALLY, try to negate a sell signal with an artificial ramp…
My! Whatever has come over me today! 🙂
Gotta run. The posse will be tweaking the Apple trade just a tad and gotta crunch… 😀
Yesiree!! That was a timely tweak indeed by the bossman…Apple delivered the package!
Boo-Yah!
Double on puts…Thank You!
Selling half…
Here is another BIG hint:
On days like today, watch DAX…. 😉
Quite surprising how quiet Apple is today!
The RUT is awesomely “trendy” at the 1, 5 and 60 minute levels. I’m finding it very easy to trade, as it just runs and runs, once the 1 and 5 minute get going. I’m using IWM options, high delta, far away expiry (“synthetic longs”). I’ve noticed the tendency of the market before but haven’t really focused my money making on it until today, and I’m liking it.
These sharp counter-trend ramps offer some awesome scalping windows. I left some call money on the table this morning but I sure hope to scoop it up on the retrace!
Of course if you don’t buy the idea of bankster manipulation you are unlikely to look for any evidence it is happening…lol! 🙂
Can you define for us what “bankster manipulation” means, and share with us the evidence that it is happening?
Well, I don’t want to give away ALL my secrets but I will give a hint:
Look at the candles!
DIA 254 puts snagged on today’s ramp nicely in the money!
VIX on sale people! 🙂
So you “see” the evidence in the price bars.
I think I’m starting to understand.
Especially when you have little or no selling pressure and you start seeing big fat juicy candles in both directions ahead of the ramp….FADE IT! 😉
XLB is strong. In 10 weeks of squeeze, and just today has come out of 12 days of squeeze with upward movement. The hourly is also in a 7 period squeeze (still).
What it all means is anyone’s guess. My guess is that price is going up.
On the lunar front, we have a new moon on August 11, and a full moon on August 26. If the alternating pattern holds, this projects a market high of some kind around mid August, followed by a move down the rest of the month. Can’t wait to see how this unfolds!
Staying focused on the market itself, I see red turning to green all over the place. All of the FAANGM stocks were red…every one of them is green now. The move off the SPX support zone of 2790-2800 is strong and so far shows every indication of being the launch of a fresh v wave up. While I’ve been cashing very quick today (to good effect, I’m over target)…I’m going to be reentering a fair amount anticipating that we’ve got some motive wave action launching here, in general.
However, I’m a bit concerned that the finance sector is topping here, after it’s initial move off the recent lows. Lots of issues extended and hitting resistance levels, and bonds are moving up a bit. On the other hand, the payment processors are sold off and maybe starting to recover.
Price simply moving up to tag prior areas of support, now resistance. It has to clear that area prior to confidence in a new wave up. I think it is corrective…I could be wrong…. 🙂
Hyuk! Hyuk! 🙂
Very few traders are selling this rip…haha!
DJI moving up to re-test surrendered prior gap. Sound & fury….
It looks like someone else is noticing the remarkable complacency over the FB implosion. It truly is a head-scratcher!
https://www.zerohedge.com/news/2018-07-30/morgan-stanley-selling-has-just-begun-correction-will-be-biggest-february
I’d be amused to watch the face of the MS guy as SPX goes up to a new ATH over the next few days/weeks. Ooops!!! Lol!!!! Oh I suppose it may not happen…but we all know it almost certainly will.
Market pundits are hilarious. The worst thing you can do as a trader in my personal opinion is listen to others with anything other than detached bemusement. Everybody has an opinion. The danger is we listen to and act on those with the strongest voice or even just the last one we hear. I try hard to take every input as “pure entertainment” only. Let the market itself guide my outlook, combined with the support of truly professional analysis.
That is one reason why I have been absent a lot lately.
OT -I have seen no news about radiation on the northwest US Pacific coast. Of course they wouls not want the tourist industry to disappear. I have not tried any wine or local seafood.
Have a great day all. See you at SPX 2900+.
The question of the moment for me is whether this SPX movement up today is the start of a v wave or the B wave of a continuing ABC down iv wave. Hmmm….. Price is now coming up to test the underside of the broken up trend line; that may be key resistance and initiate C. Or, it it’s broken through with some authority…perhaps its v wave time.
this.
Wave up corrective. Gap will be filled.
I’m not at all convinced, myself.
Meanwhile, I’m dining for daily profits on the IWM move up. And a few other quick catch-and-release’s, like AMGN.
NFLX has touched it’s 61.8% retrace and shown a turn on the 5 minute. The hourly is close to polarity inverting to up. Another good “catch the falling knife” set up for those inclined.
oops…already took my NFLX profit. I am bad man! Lol!!!!
Gold and Silver in a real battle this morning… bouncing from negative to positive again and again like crazy!
When it breaks out of this, I am sure it will be powerful and big!
Too much shorts on both, I’m in across the board, NUGT included (Not Trading Advice)
Yeah, GLD and SLV are breaking out per MACD. They have the FED meeting tomorrow where we could see a whipsaw (hopefully moving up eventually) Really need a catalyst to get some giddy up. FED may hold some clues. Donald wants lower rates, the trade tariffs being walked back or the market getting a bit scary (prompting the FED to change its wording to a bit more dovish) could all get the ball rolling. ON the flip side FED coming out and saying it likes a strong dollar and is going to continue raising rates regardless of the market could subdue any rally.
For those enamored of catching falling knives, TWTR may be finding support at it’s 78.6% retrace, which it has tagged perfectly and is now skittering across the top of at the hourly and 5 minute tf’s.
I have to opine, looking at those ES 1 minute candles that these banksters are really starting to look beyond pathetic…!!
They’re so panicky and desperate it’s really starting to scare me….BOJ lol today!! The fact that the public tolerates inflation targeting, allowing bond yields to vacillate 20bps….is insane, and are you kidding me with abject market manipulation!! They’re making it so the crash will be 100% they’re fault and that seems to fit history IMHO.
Buying Aug 10 UVXY 9.00 strike calls for 0.90
Is this legal?! 🙂
Futures fading so we may follow DAX South.
A switch at the open may be in order with a re-purchase of short puts and converting calls to a bear call spread. We will see…. 🙂
Guten Morgen!
Apple’s earnings report after the bell could be a watershed event.
All the faang stocks that have already reported are now trading below their pre-report prices. If Apple knocks it out of the park, we will likely see an initial rally. The big question for traders is will it represent a lasting rebound for the sector, or an opportunity for more insider distribution. There will be a way to tell by looking at price vs volume.
A bad report would be ominous. Breadth has been narrowly focused in these stocks and if they are all breaking down, it spells certain trouble for indices in which they were responsible for most of the gains this year. We are trading the 190 straddle, and I would not be at all surprised to see both legs pop if we get an initial rally.
I think we get at least a relief rally today with at least 10-15 SPX points, good enough to cash out calls and buy back short calls of bull put credit spread. Have a great trading day!
Oops…short PUTS…
Have you noticed from in Shopify in last 3 days and today will be another 10%.
Meant drop not from
Yep. Carnage.
I don’t see much excitement from AAPL earnings as lack of products and in fact of the sales disappoints, watch out.. watching carefully as this is the domino that starts chain reaction ..
Better move quick Verne, the vol. unwind round 2 is about to begin, and Hedge Funds are blasting out of concentrated positions, meanwhile we’ve barely seen short interest budge. You know the drill….. I like the 190 straddle trade, looks like everyone’s in the 190 over 185 based on open interest. Implied vol. looks pretty low in my humble opinion.
Yep. Unloaded those calls in a jiffy for 1.25 and bought back
278 puts. Holding 276 for about 0.10 cost basis.
Pretty much what I expected…. AAPL is going to be REAL interesting… 🙂
Speaking of volocaust round 2, somebody claimed that what happened in Feb was a once-in-a-lifetime event….yeah…of a fruit fly! 🙂