Some more downwards movement, at least for the start of the session, was expected. This is exactly what happened.
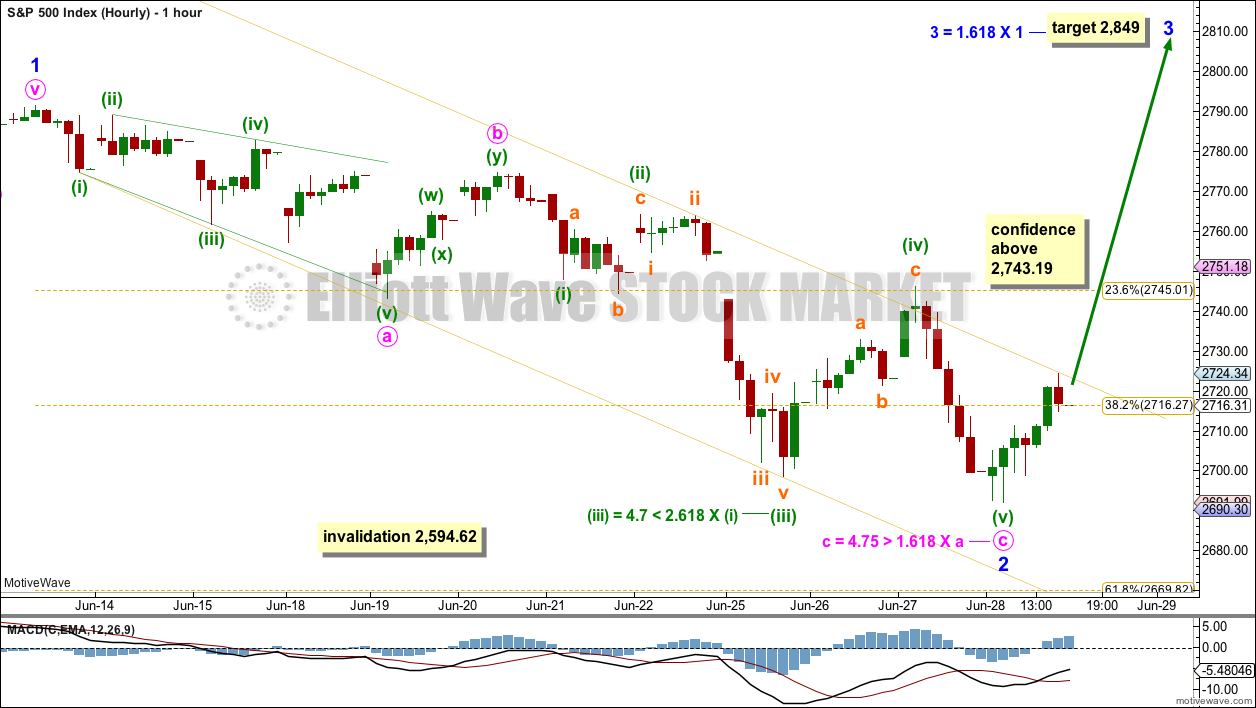
Summary: If price makes a new high above 2,743.19, then some confidence may be had that a low is in place. The target would be about 2,849 for the next consolidation.
If price makes a new low below 2,691.99, then it would look most likely to continue lower to end below 2,676.81. The target would be about 2,660 for the pullback to end.
The invalidation point must remain at 2,594.62.
The mid to longer term target is at 2,922 (Elliott wave) or 3,045 (classic analysis). Another multi week to multi month correction is expected at one of these targets.
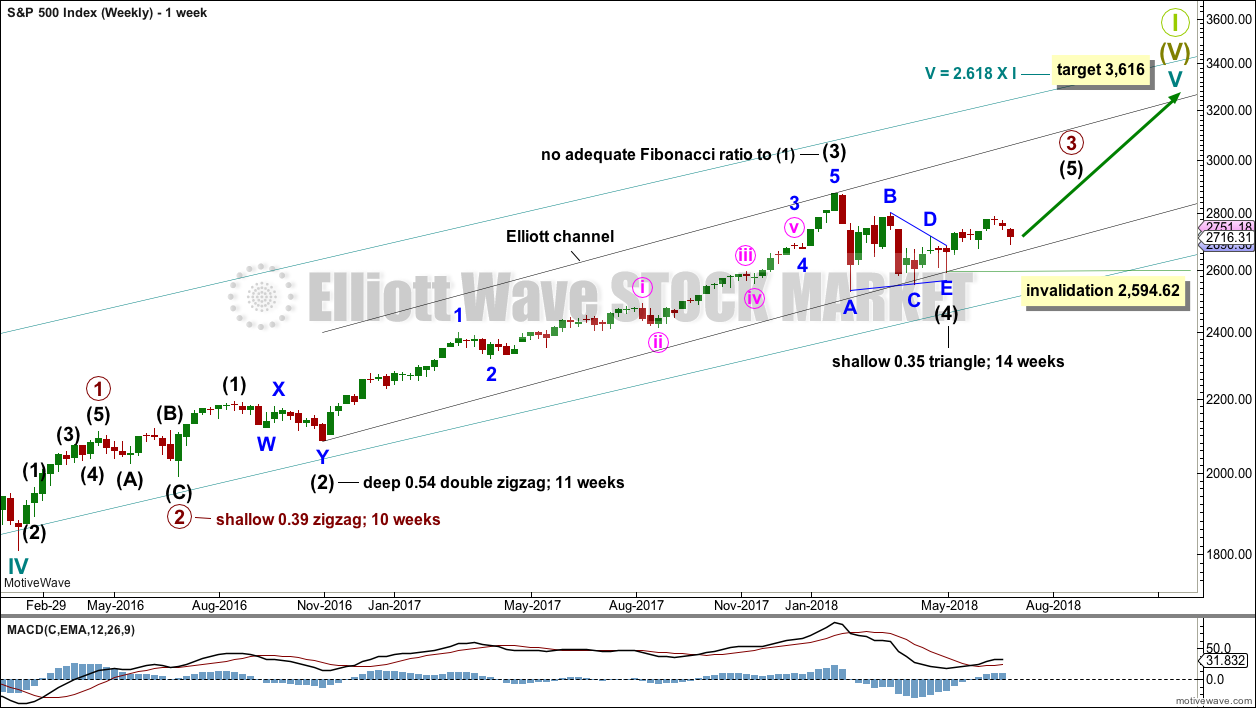
The final target for this bull market to end remains at 3,616.
Pullbacks are an opportunity to join the trend.
Always practice good risk management. Always trade with stops and invest only 1-5% of equity on any one trade.
New updates to this analysis are in bold.
The biggest picture, Grand Super Cycle analysis, is here.
Last historic analysis with monthly charts is here, video is here.
ELLIOTT WAVE COUNT
WEEKLY CHART
Cycle wave V must complete as a five structure, which should look clear at the weekly chart level and also now at the monthly chart level. It may only be an impulse or ending diagonal. At this stage, it is clear it is an impulse.
Within cycle wave V, the third waves at all degrees may only subdivide as impulses.
Intermediate wave (4) has breached an Elliott channel drawn using Elliott’s first technique. The channel is redrawn using Elliott’s second technique: the first trend line from the ends of intermediate waves (2) to (4), then a parallel copy on the end of intermediate wave (3). Intermediate wave (5) may end either midway within the channel, or about the upper edge.
Intermediate wave (4) may now be a complete regular contracting triangle lasting fourteen weeks, one longer than a Fibonacci thirteen. There is perfect alternation and excellent proportion between intermediate waves (2) and (4).
Within intermediate wave (5), no second wave correction may move beyond the start of its first wave below 2,594.62.
DAILY CHART
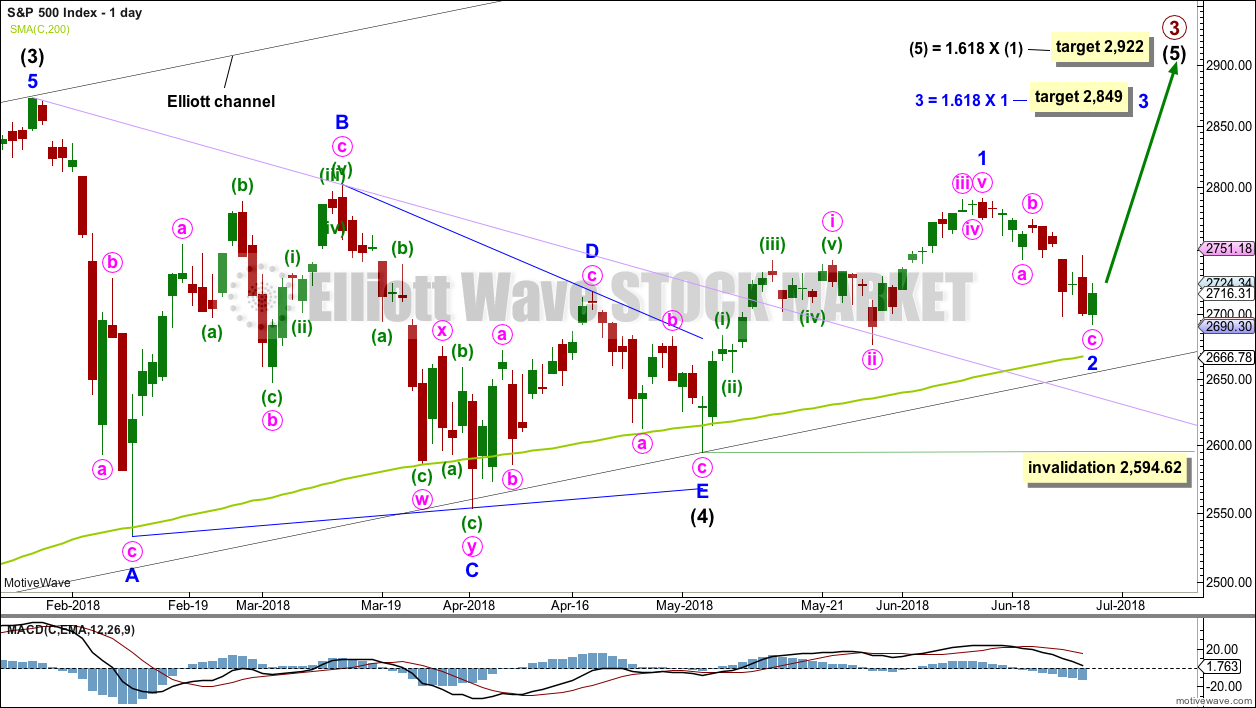
It is possible that intermediate wave (4) is a complete regular contracting triangle, the most common type of triangle. Minor wave E may have found support just below the 200 day moving average and ending reasonably short of the A-C trend line. This is the most common look for E waves of triangles.
Intermediate wave (3) exhibits no Fibonacci ratio to intermediate wave (1). It is more likely then that intermediate wave (5) may exhibit a Fibonacci ratio to either of intermediate waves (1) or (3). The most common Fibonacci ratio would be equality in length with intermediate wave (1), but in this instance that would expect a truncation. The next common Fibonacci ratio is used to calculate a target for intermediate wave (5) to end.
Price has clearly broken out above the upper triangle B-D trend line. This indicates that it should now be over if the triangle is correctly labelled.
A trend line in lilac is added to this chart. It is the same line as the upper edge of the symmetrical triangle on the daily technical analysis chart. Price found support about this line.
Minor wave 1 may have been over at the last high. Minor wave 1 will subdivide as a five wave impulse on the hourly chart; the disproportion between minute waves ii and iv gives it a three wave look at the daily chart time frame. The S&P does not always exhibit good proportions; this is an acceptable wave count for this market.
It looks like minor wave 2 for this first daily wave count should be over here. The structure at lower time frames looks complete.
A target is calculated for minor wave 3 to end.
Minor wave 2 may not move beyond the start of minor wave 1 below 2,594.62.
HOURLY CHART
Minor wave 2 may now be a complete zigzag; all subdivisions fit for a 5-3-5 downwards. A best fit channel is drawn about this downwards movement. It must be accepted that while price remains within the channel the fifth wave of minuette wave (v) could extend lower, so the invalidation point must remain the same.
A breach of the channel would be the first indication that a low may be in place. A new high above 2,743.19 would provide confidence that a low should be in place.
Minor wave 2 may not move beyond the start of minor wave 1 below 2,594.62.
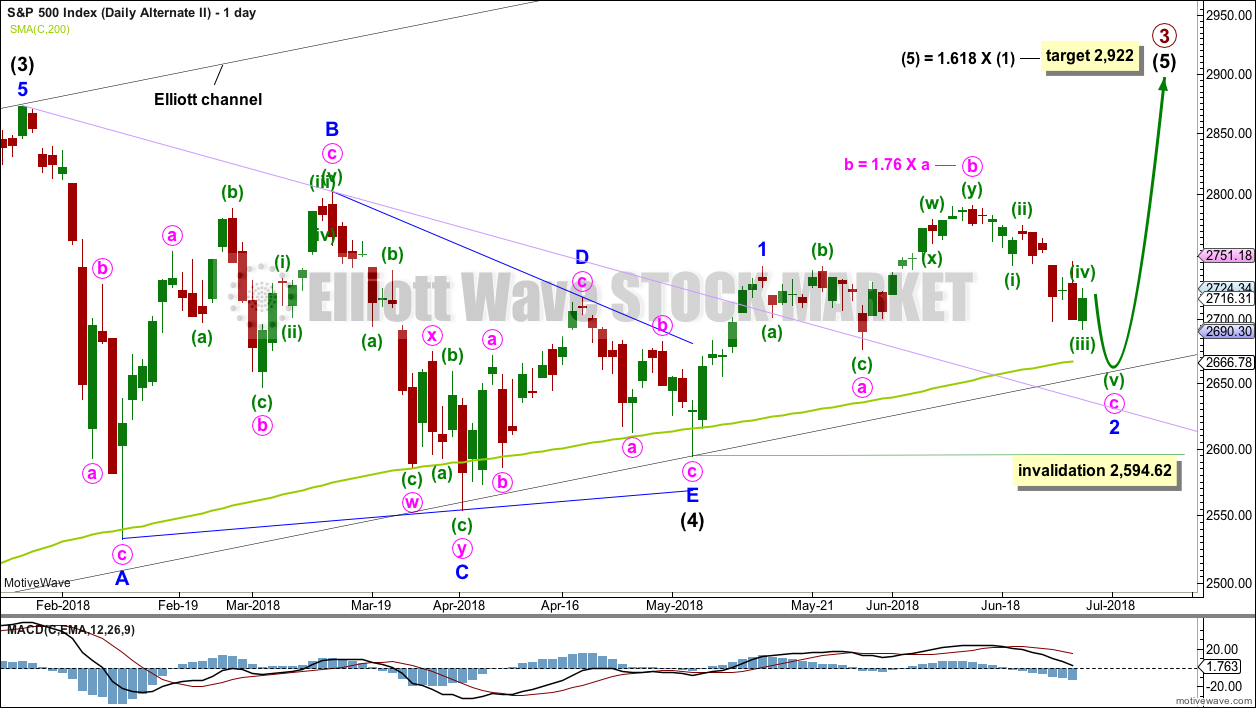
ALTERNATE DAILY CHART
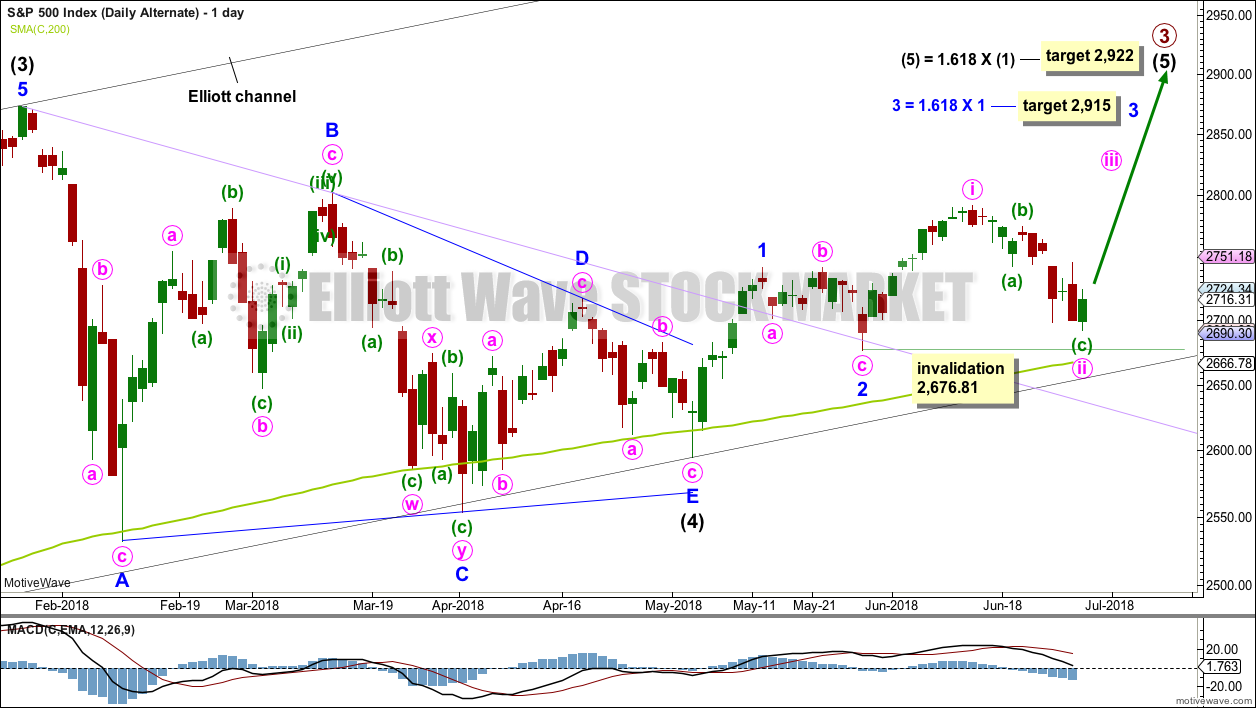
It is possible that minor waves 1 and 2 are already over. The last high may have been minute wave i. Minute wave ii may need one more low to be complete.
Minute wave ii may not move beyond the start of minute wave i below 2,676.81.
This alternate wave count resolves the problem of an odd looking minor wave 1 for the main wave count. The only problem with this alternate wave count is minute wave ii is not contained within a base channel which would be drawn about minor waves 1 and 2.
This wave count is very bullish. It expects to see a very strong upwards movement as the middle of a third wave begins here.
SECOND ALTERNATE DAILY CHART
It is also possible that minor wave 1 ended earlier and current downwards movement is the end of an expanded flat correction for minor wave 2.
The 0.618 Fibonacci ratio of minor wave 1 here would be about 2,660. This would be very slightly below the lower edge of the black Elliott channel and slightly below the 200 day moving average.
This second alternate wave count expects a somewhat deeper pullback about here to make a new low below the end of minute wave a at 2,676.81, so that minute wave c avoids a truncation and minor wave 2 avoids a running flat correction.
Minor wave 2 may not move beyond the start of minor wave 1 below 2,594.62.
SECOND ALTERNATE HOURLY CHART
A zigzag subdivides 5-3-5, exactly the same as waves 1-2-3 of an impulse. The subdivisions for both wave counts are seen in the same way at the hourly chart level.
If an impulse is continuing lower, then within it minuette wave (iv) may not move into minuette wave (i) price territory above 2,743.19.
A new low below today’s low at 2,691.99 would put the first two daily wave counts in doubt; at that stage, expect downwards movement to most likely continue to end below 2,676.81, and the target would be about 2,660.
TECHNICAL ANALYSIS
WEEKLY CHART
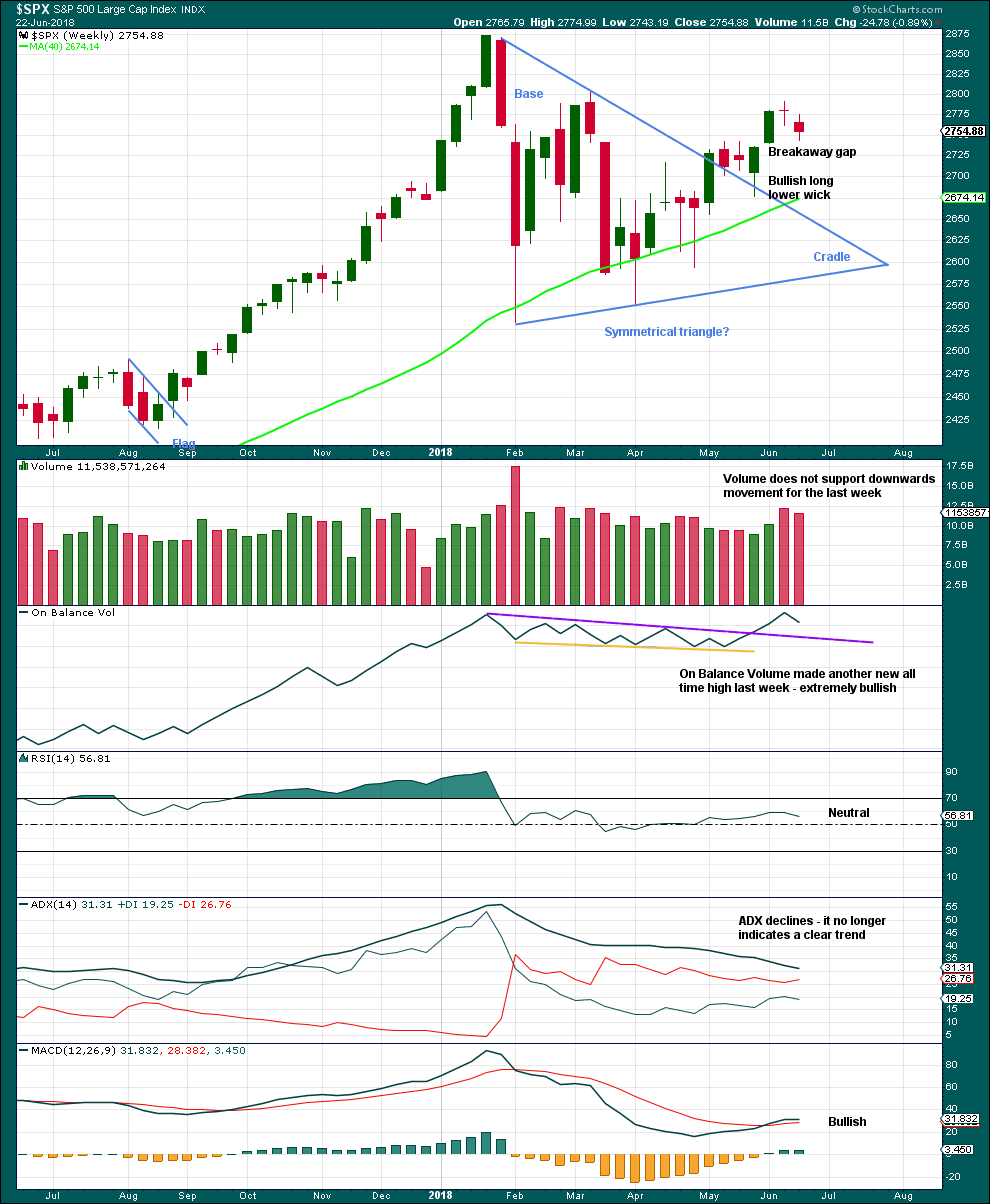
Click chart to enlarge. Chart courtesy of StockCharts.com.
Last week’s spinning top candlestick pattern again signals a balance of bulls and bears. With volume not supporting downwards movement, it looks like bears may be tiring.
This chart is very bullish.
DAILY CHART
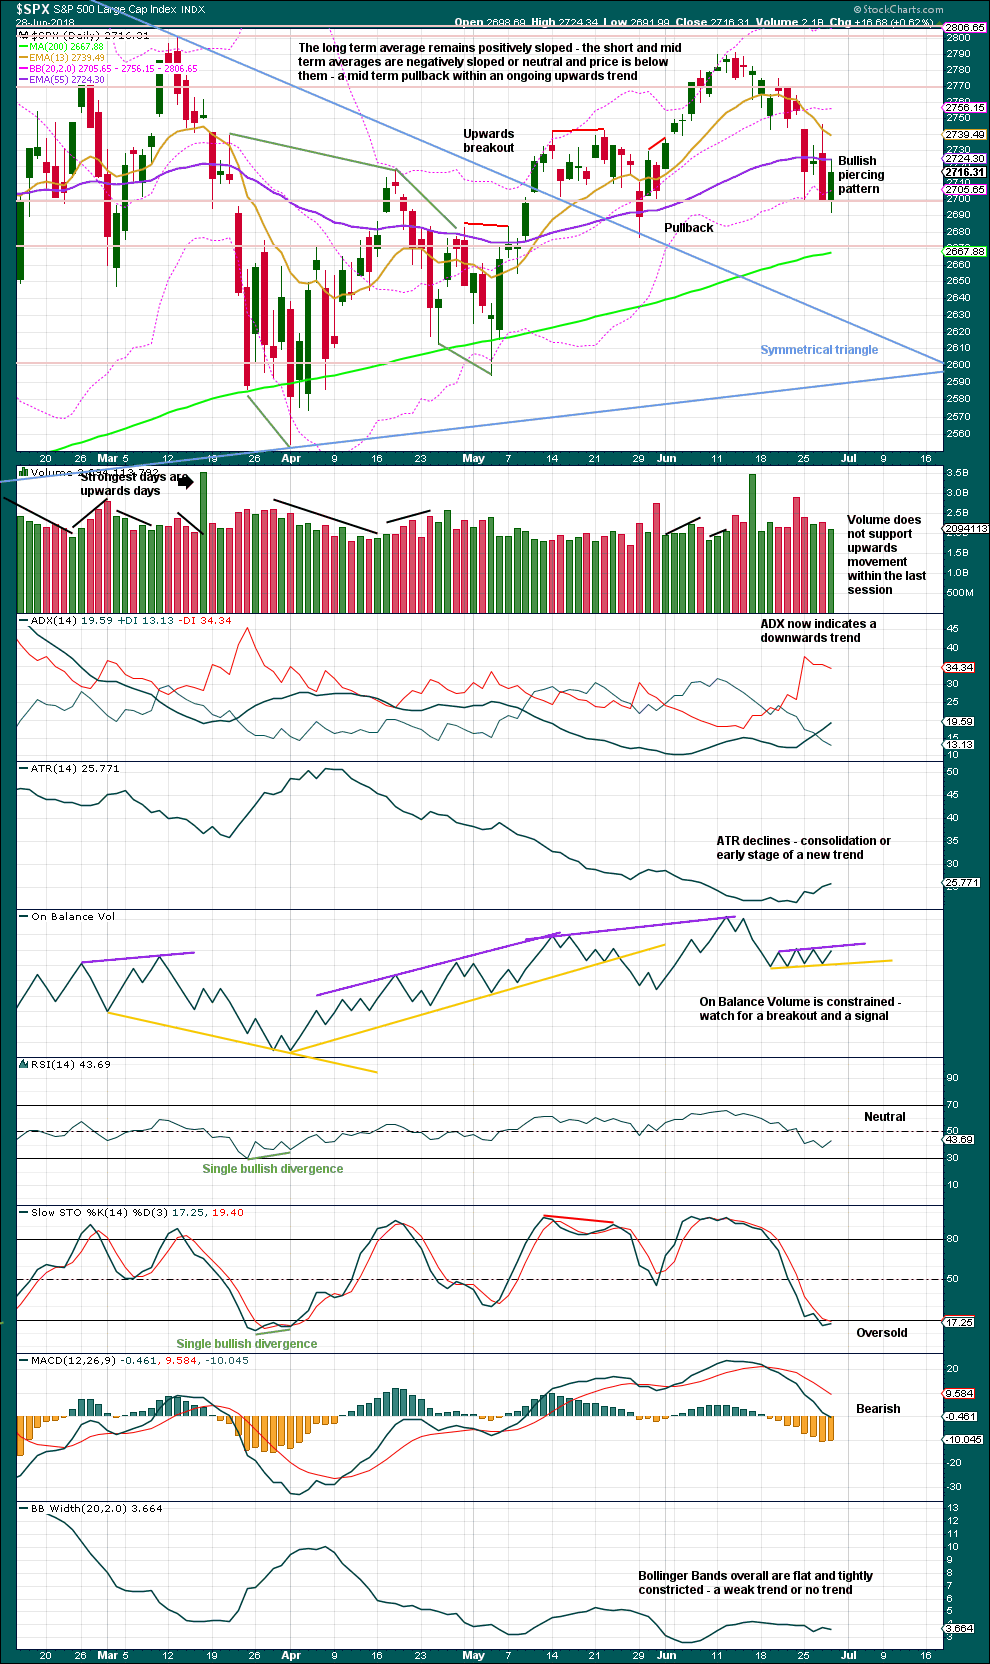
Click chart to enlarge. Chart courtesy of StockCharts.com.
The symmetrical triangle may now be complete. The base distance is 340.18. Added to the breakout point of 2,704.54 this gives a target at 3,044.72. This is above the Elliott wave target at 2,922, so the Elliott wave target may be inadequate.
Since the low on the 2nd of April, 2018, price has made a series of higher highs and higher lows. This is the definition of an upwards trend. But trends do not move in perfectly straight lines; there are pullbacks and bounces along the way. While price has not made a lower low below the prior swing low of the 29th of May, the view of a possible upwards trend in place should remain. Note though that the second alternate Elliott wave count allows for a new swing low yet expects a third wave upwards to begin from there. This is entirely possible.
On Balance Volume may be used as an early indicator of a low in place. If it gives a bullish signal with a break above the purple resistance line, then expect a low is in place.
While volume today does not support upwards movement within the session, this shall not be given much weight as low and declining volume is a feature of this bull market.
VOLATILITY – INVERTED VIX CHART
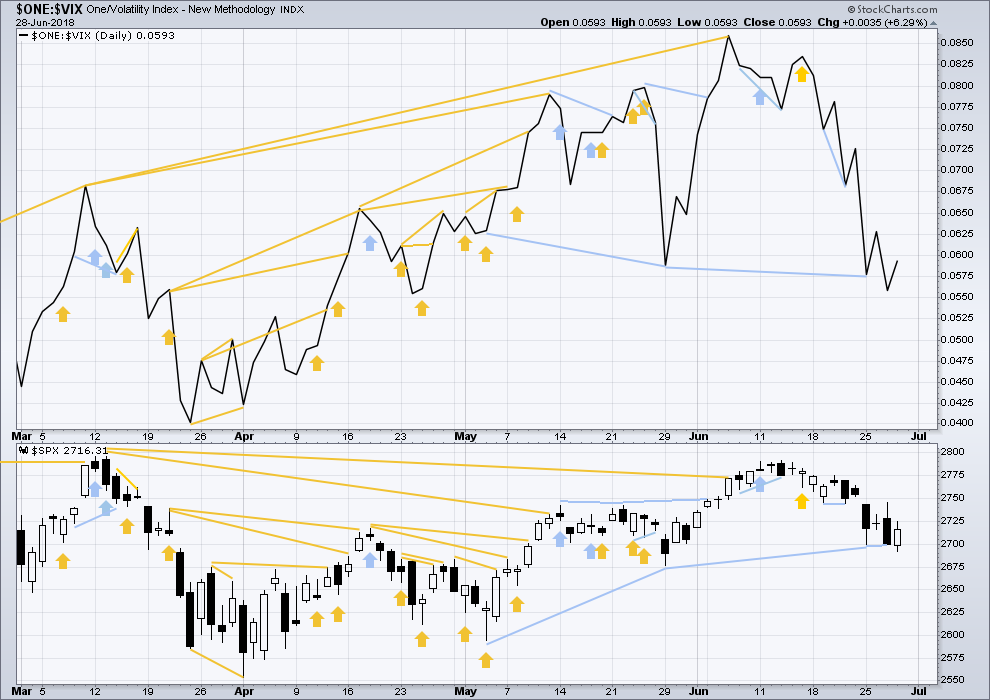
Click chart to enlarge. Chart courtesy of StockCharts.com. So that colour blind members are included, bearish signals
will be noted with blue and bullish signals with yellow.
Normally, volatility should decline as price moves higher and increase as price moves lower. This means that normally inverted VIX should move in the same direction as price.
Inverted VIX has made a new high above the prior swing high of the 9th of March, but price has not made a corresponding new swing high about the same point yet. This divergence is bullish. Inverted VIX is still a little way off making a new all time high.
There is mid term bearish divergence between price and inverted VIX: inverted VIX has made a new swing low below the prior swing low of the 29th of May, but price has not. Downwards movement has strong support from increasing market volatility; this divergence is bearish. However, it must be noted that the last swing low of the 29th of May also came with bearish divergence between price and inverted VIX, yet price went on to make new highs.
This divergence may not be reliable. As it contradicts messages given by On Balance Volume and the AD line, it shall not be given much weight in this analysis.
There is no new divergence between inverted VIX and price today.
BREADTH – AD LINE
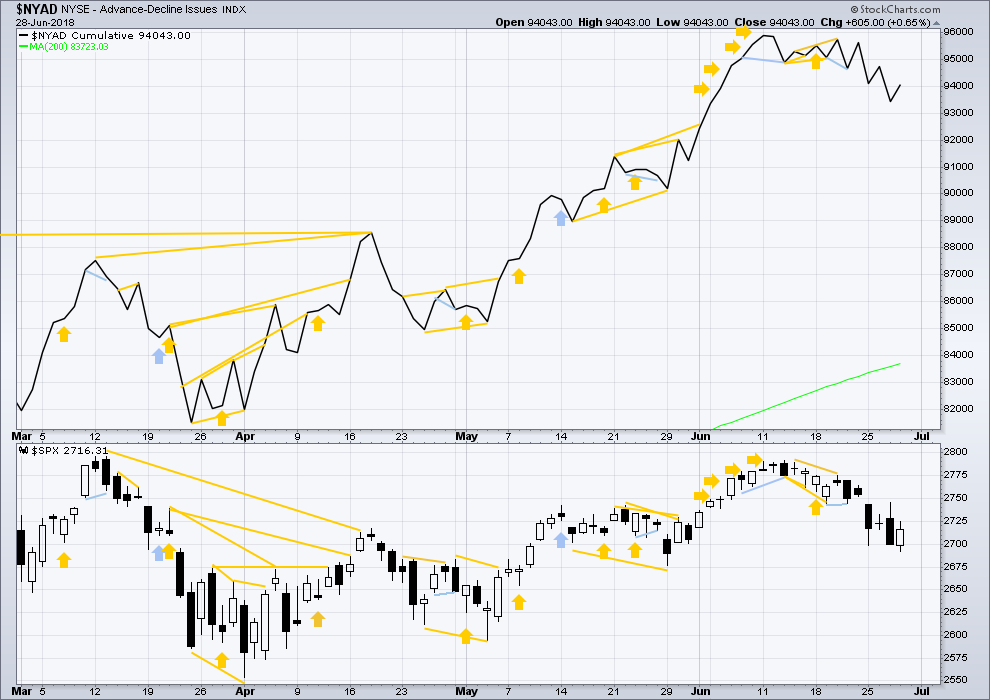
Click chart to enlarge. Chart courtesy of StockCharts.com.
There is normally 4-6 months divergence between price and market breadth prior to a full fledged bear market. This has been so for all major bear markets within the last 90 odd years. With no longer term divergence yet at this point, any decline in price should be expected to be a pullback within an ongoing bull market and not necessarily the start of a bear market. New all time highs from the AD line means that any bear market may now be an absolute minimum of 4 months away. It may of course be a lot longer than that. My next expectation for the end of this bull market may now be October 2019.
Small caps and mid caps have both recently made new all time highs. It is large caps that usually lag in the latter stages of a bull market, so this perfectly fits the Elliott wave count. Expect large caps to follow to new all time highs.
Breadth should be read as a leading indicator.
There is no new divergence today between price and the AD line.
Overall, the AD line still remains mostly bullish as it has made more than one new all time high last week. Price may reasonably be expected to follow through in coming weeks.
DOW THEORY
The following lows need to be exceeded for Dow Theory to confirm the end of the bull market and a change to a bear market:
DJIA: 23,360.29.
DJT: 9,806.79.
S&P500: 2,532.69.
Nasdaq: 6,630.67.
Only Nasdaq at this stage is making new all time highs. DJIA and DJT need to make new all time highs for the ongoing bull market to be confirmed.
Charts showing each prior major swing low used for Dow Theory may be seen at the end of this analysis here.
Published @ 08:36 p.m. EST.

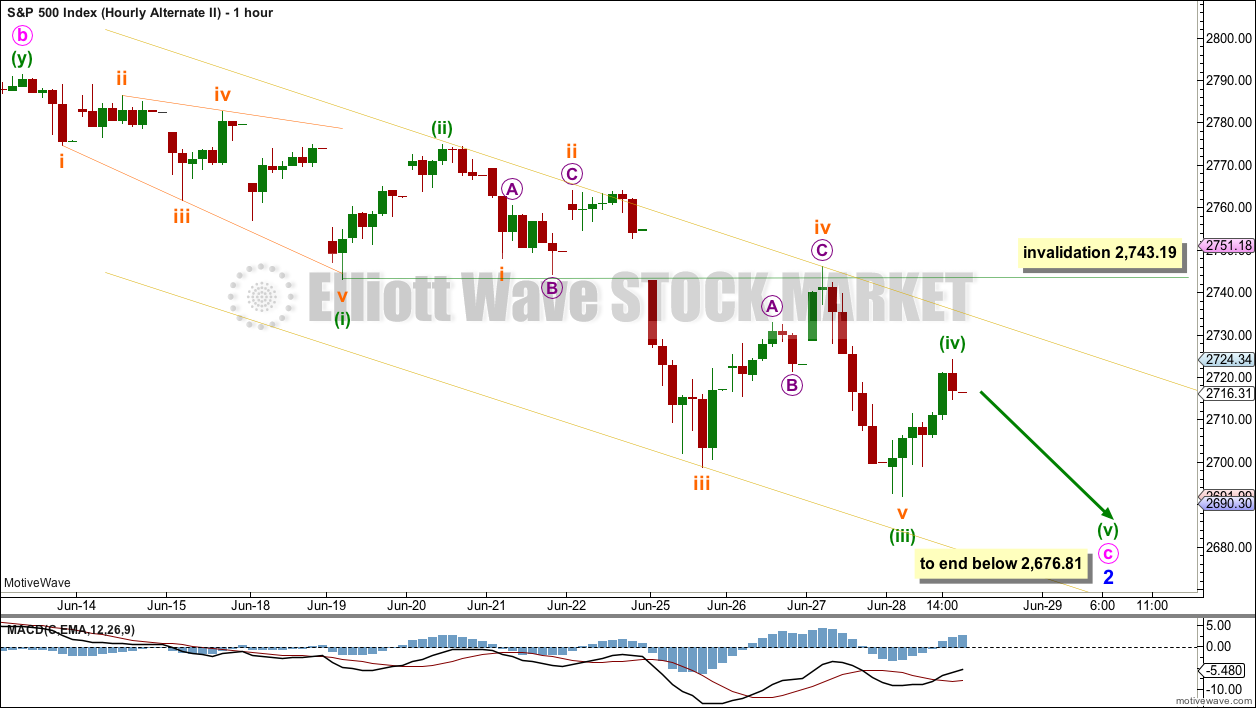
Price has made a very slight new high above 2,743.19 to 2,743.26. That’s enough to invalidate the second daily alternate, and I’m not going to consider a running flat with that large a truncation so I’ll discard that wave count now. Even though it looked so good, price tells us it’s wrong.
And so it looks like a low should now be in place for minor wave 2.
Any body looking for short set ups? Check F. Massive weekly trend line break to the downside, supported by a strong down trend for years.
Bull flag on the SPX? or am I just hoping….
holding above the 23% retrace of the Thurs/Fri up move, 3 bars worth on the hourly, and the hourly trend is still clearly up. So yea, it might end up being a bull flag.
If buyers do not step in before the close, we have potential long wicks in the making. If sellers do, a potential shooting star.
If the buyers appear right before the close, more window dressing an all likelihood.
I thought the 7 strongest days of every monthly cycle was the last 2 days followed by the first 5 of the next month. I.e. the monthly seasonal factor is more than just end of month driven, it’s more “lead up to and start of month”. We’ll see! Certainly the market hasn’t broken the critical ii trend line yet, so it’s precarious.
Look at the candles!
Look at the gap!
Price action is all!
Failure to hold 2720 significant.
Take care all and have a great week- end.
Gap filled on huge volume….
We suspected as much, now didn’t we? 🙂
ANDV down trended for 4 weeks. The chart is hourly. After 4 weeks, there’s now:
– a down trend line break to the upside
– enough upward movement to shift the hourly bars to “up trend” based on ADX and CCI.
– a polarity inversion to higher lows and higher highs.
Something to consider perhaps.
Not advice, just something to consider.
The move up in Nasdaq and RUT already looking quite weak. SPX is going nowhere unless we see a strong rebound in at least the former. The open gap that takes price back above the 2750 area remains formidable resistance and I remain extremely cautious while it stays open. TZA has delivered some spectacular gains the last week. Looks to me like time to reload! As the man said, Caveat Emptor! 🙂
Chris says “danger” and it reminds me to initiate hedging (or intraday trade profits) shorts at the logical place…which is right here for me. Price has turned back down BELOW the 100% retrace of the last down move AND below the overall wave ii down trend line. SPX puts suffice and now it wait and see if one of the retrace fibo’s holds or not. If further higher TF sell triggers start firing…I’ll size up my short hedge.
Ah, finally some green showing up here and there across my board! “Change in the weather…”
That’s great Kevin. Your astute analysis and chartwork paying off.
What are your thoughts on AMTD? You had mentioned this before as a good long position…
Yes, however AMTD as you know broke hard downward in this general sell off, and broke a high tf (weekly) trend line. Also, it is still in week 6 of a weekly level squeeze, with the action through that being clearly downward. The squeeze is still on, so that represents some significant downside risk to me. It may have found support at 54.8, there are several pivot lows from early 2018 right there. I think it needs to demonstrate a clear daily level trend change to consider a long commitment though.
ABBV is finally indicating a possible bottom. It’s got a lot of work to actually trend change at the hourly tf. I’ve not let that deter me: I’ve take a bull call debit spread right here, July 20 expiry, I like the odds.
Oil of course blasting to the upside.
GUSH is in day….9 of a daily level squeeze and moving up. Rather bullish for GUSH.
XOP is also in a very long daily squeeze (10 days) and is pushing up. Also quite bullish.
Time to short oil. Potential triple to the downside on carefully selected USO puts. I think it will be a big fourth…
Guten Morgen!
2720 remains key.
The bulls have managed to recapture it in ES. They have to hold it.
Next pivot is 2750, A close above for me signals the “All Clear”
Have a profitable trading day, and a great weekend!
This week is one of the largest outflows in equities in all of recorded history…..buyers beware, they are selling to you!
Is it nuts to think that’s a bullish (contrarian) indicator, given that the downward momentum which has been slowly increasing for 2 weeks or more is now slowing dramatically, and a potential pivot low is in place? I.e, could it be bullish that the market absorbed all that with such little relative damage?
“All of recorded history” sounds a bit dramatic, considering recorded history begins in 3500 B.C. and equity markets didn’t emerge until 1602. The money supply is always increasing, so the nominal outflow amount is not very informative. The last time global equities saw comparable negative outflows was November 2016, which was the bottom… not saying it can’t happen, but I find the idea of a catastrophic collapse in the near term (~6 months) unlikely, same as I said in February of this year.
There are some indications the bottom of this corretion may be in.
1) MACD on the hourly charts has a positive divergence
2) SPX closed outside its lower BB then back inside
3) VIX closed outside its upper BB then back inside and now closed below that point
4) $NYMO (McClellan Oscillator) closed below its lower BB and then back inside
IMO, the long term outlook is up for US equities
Have a great day.