
Price continues to move higher as both the Elliott wave count and classic analysis expect.
Focus in this analysis will continue to be on identifying when and where the next interruption to this trend may begin, and how long it may last.
Summary: The trend is up and strong. Corrections are an opportunity to join the trend. Divergence between price and the AD line for Friday’s high is bearish and suggests a correction may come sooner than expected.
The next target is now at 2,896 for a very short term interruption to the trend (it may be over within a day), and the target after that is at 2,951 for another short term interruption to the trend (it may be over within a week).
This looks like a third wave that is still incomplete. It may have just passed the middle strongest portion, so look for volatility to increase as a series of fourth waves unfold.
Always practice good risk management. Always trade with stops and invest only 1-5% of equity on any one trade.
The biggest picture, Grand Super Cycle analysis, is here.
Last historic analysis with monthly charts is here. Video is here.
An historic example of a cycle degree fifth wave is given at the end of the analysis here.
MAIN ELLIOTT WAVE COUNT
WEEKLY CHART
Click chart to enlarge.
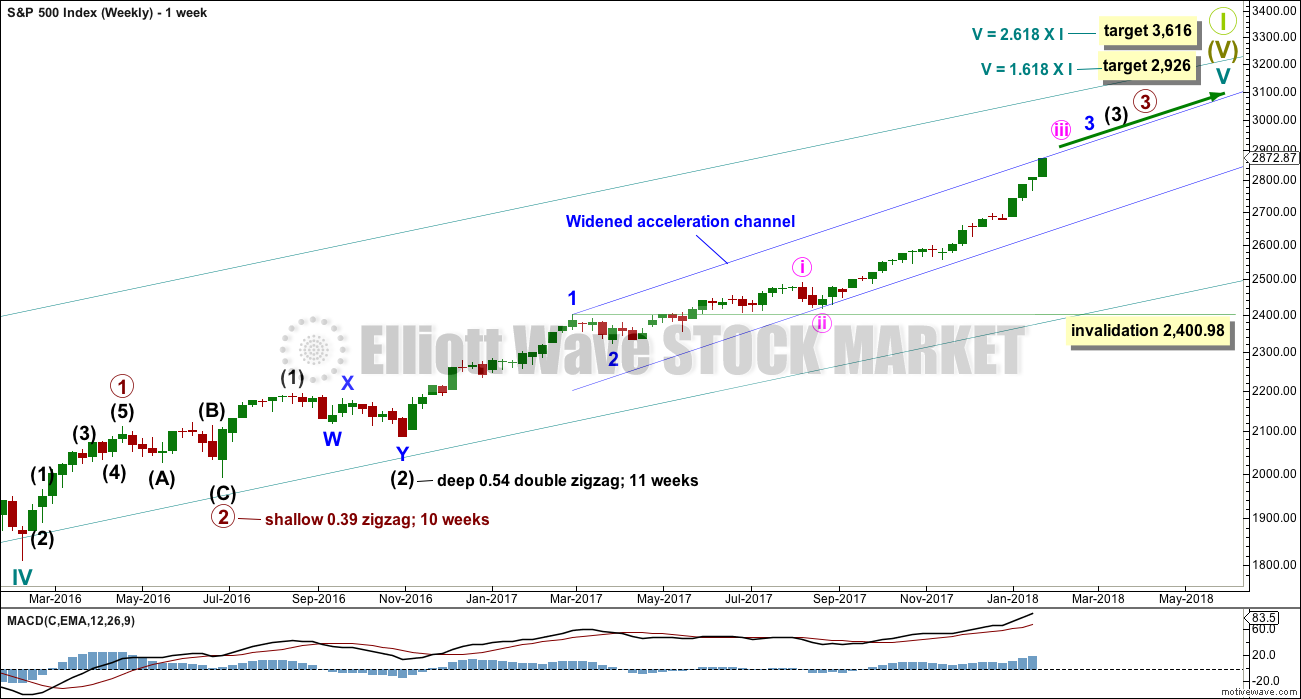
Cycle wave V must complete as a five structure, which should look clear at the weekly chart level. It may only be an impulse or ending diagonal. At this stage, it is clear it is an impulse.
Within cycle wave V, the third waves at all degrees may only subdivide as impulses.
Within cycle wave V, the corrections for primary wave 2 and intermediate wave (2) both show up clearly, both lasting several weeks. The respective corrections for intermediate wave (4) and primary wave 4 should also last several weeks, so that they show up at weekly and monthly time frames. The right proportions between second and fourth wave corrections give a wave count the right look. This wave count expects to see two large multi week corrections coming up.
Cycle wave V has passed equality in length with cycle wave I, which would be the most common Fibonacci ratio for it to have exhibited. The next most common Fibonacci ratio would be 1.618 the length of cycle wave I. This target at 2,926 now looks too low. The next most common Fibonacci ratio would be 2.618 the length of cycle wave I at 3,616. This higher target is looking more likely at this stage.
Intermediate wave (3) has passed all of equality in length with intermediate wave (1), and 1.618 and 2.618 the length of intermediate wave (1). It is possible that intermediate wave (3) may not exhibit a Fibonacci ratio to intermediate wave (1). The target calculation for intermediate wave (3) to end may have to be done at minor degree; when minor waves 3 and 4 are complete, then a target may be calculated for intermediate wave (3) to end. That cannot be done yet.
When minor wave 3 is complete, then the following multi week correction for minor wave 4 may not move into minor wave 1 price territory below 2,400.98. Minor wave 4 should last about four weeks to be in proportion to minor wave 2. It may last about a Fibonacci three, five or even eight weeks if it is a time consuming sideways correction like a triangle or combination. An Elliott channel may be drawn about the impulse of intermediate wave (3) when minor wave 3 is complete, and minor wave 4 may end about the lower edge of that channel.
At this stage, a widened acceleration channel is drawn now in blue about the impulse of intermediate wave (3). This is drawn in the same way as an Elliott channel using Elliott’s first technique.
A third wave up at four degrees may be completing. This should be expected to show some internal strength and extreme indicators, which is exactly what is happening. Members are advised to review the prior example given of a cycle degree fifth wave here. The purpose of publishing this example is to illustrate how indicators may remain extreme and overbought for long periods of time when this market has a strong bullish trend. If the current wave count is correct, then the equivalent point to this historic example would be towards the end of the section delineated by the dates November 1994 to May 1996. In other words, the upwards trend for this fifth wave may only have recently passed half way and there may be a very long way up to go yet.
DAILY CHART
Click chart to enlarge.
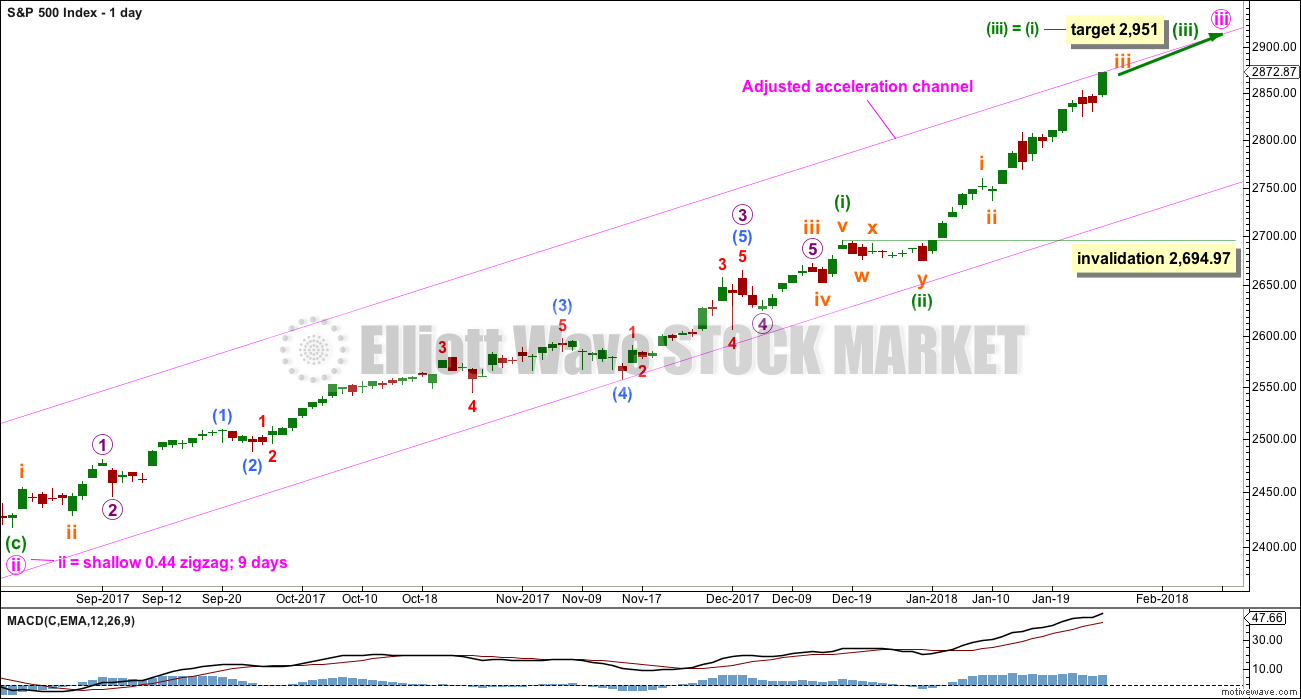
Keep redrawing the acceleration channel as price continues higher: draw the first line from the end of minute wave i to the last high, then place a parallel copy lower down to contain all this upwards movement. When minute wave iii is complete, this would be an adjusted Elliott channel and the lower edge may provide support for minute wave iv.
The focus for the short term will be on identifying the next multi week interruption to the upwards trend.
A target for minuette wave (iii) fits only with the second higher target on the weekly chart.
Minuette wave (ii) subdivides as a combination and lasted only eight sessions, about only one and a half weeks. Minuette wave (iv) may be a zigzag, which tend to be quicker structures than combinations; a Fibonacci five days will be the first expectation, but it may be over within less than one week.
Because minuette wave (i) was a long extension, minuette wave (iii) may be shorter or only about equal in length. If minuette wave (iii) is about equal in length with minuette wave (i), then they would both be long extensions. Only two actionary waves within an impulse may be extended. If both minuette waves (i) and (iii) are extended, then minuette wave (v) may not extend.
Minuette wave (iv), when it arrives, may not move into minuette wave (i) price territory below 2,694.97.
HOURLY CHART
Click chart to enlarge.
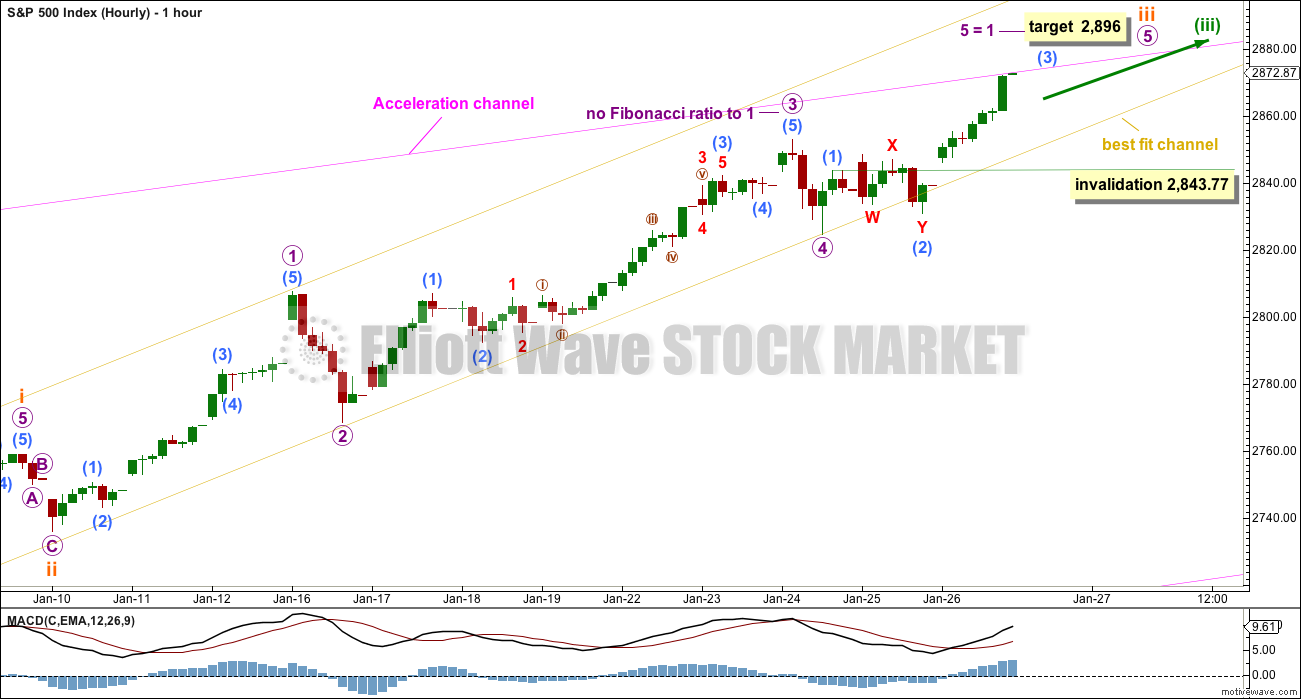
Always assume that the trend remains the same until proven otherwise. At this stage, there is no technical evidence for a trend change; we should assume the trend remains upwards.
Subminuette wave iii is extending. Subminuette wave iii passed equality in length with subminuette wave i at 2,821.59. The next Fibonacci ratio in the sequence to calculate a target would be 1.618 the length of subminuette wave i at 2,874, but price is now very close to this point and the structure of micro wave 5 is incomplete.
A new target for subminuette wave iii to end is calculated at micro degree. Micro wave 3 is a little longer than micro wave 1, so micro wave 5 is not limited; the core Elliott wave rule stating micro wave 3 may not be the shortest actionary wave is met. Because micro wave 3 does not exhibit a Fibonacci ratio to micro wave 1, it would be more likely that micro wave 5 may exhibit a Fibonacci ratio to either of micro waves 1 or 3, and equality in length with micro wave 1 is the most common Fibonacci ratio.
Micro wave 5 must complete as a five wave structure. It is unfolding as the more common impulse. Within the impulse, submicro wave (4) may not move into submicro wave (1) price territory below 2,843.77.
A new low below 2,843.77 would see this main hourly wave count invalidated and the alternate hourly wave count below should then be used.
ALTERNATE HOURLY CHART
Click chart to enlarge.
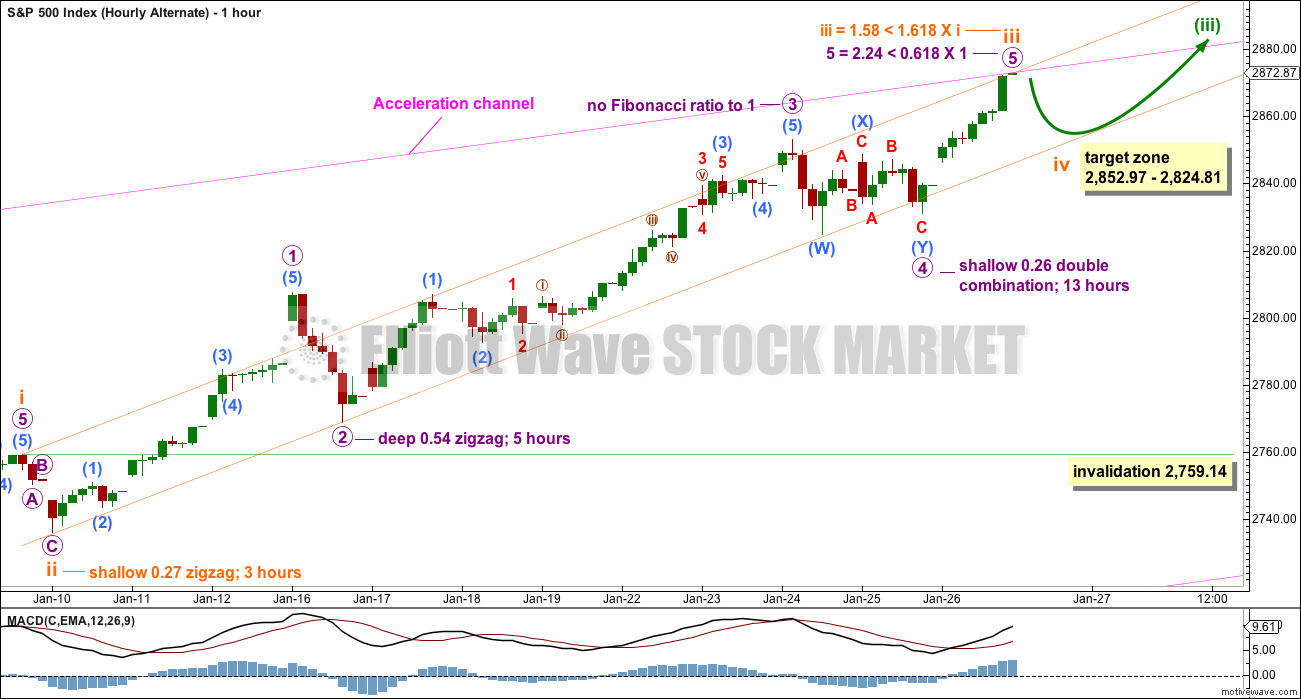
If micro wave 4 is seen as a double combination rather than a zigzag, then it may have ended later at the last small swing low.
This is an alternate wave count for two reasons:
1. Assume the trend remains the same until proven otherwise.
2. On the five minute chart, the structure of submicro waves (X) and (Y) is not as good as how this movement is seen on the main hourly chart.
However, if price makes a new low below 2,843.77 confidence may be had in this alternate wave count.
This wave count expects only a shallow brief interruption to the upwards trend though. Subminuette wave iv may end within the price territory of the fourth wave of one lesser degree. Subminuette wave iv may end at support about the lower edge of the orange Elliott channel.
Subminuette wave ii was very brief. Submineutte wave iv may be longer lasting if it is a more complicated time consuming combination, triangle or flat correction. Subminuette wave iv would be expected to be only a couple of days or so at the most. It may not move into subminuette wave i price territory below 2,759.14.
There is a little support today for this alternate wave count from divergence with price and the AD line.
TECHNICAL ANALYSIS
WEEKLY CHART
Click chart to enlarge. Chart courtesy of StockCharts.com.
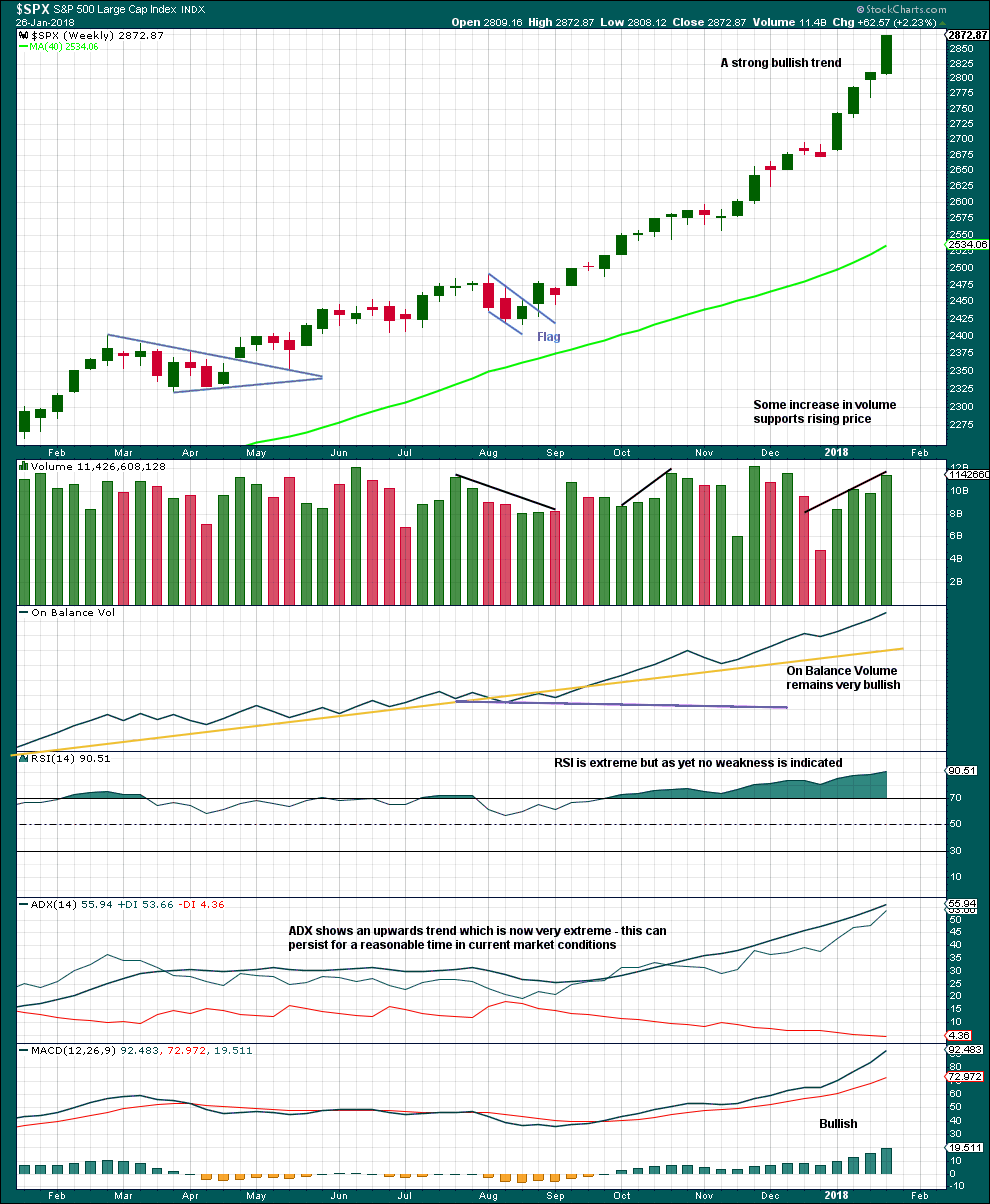
This upwards trend is extreme and stretched, but there is still no evidence of weakness at the weekly time frame.
There is no divergence to indicate any weakness yet between price and RSI.
As a third wave at multiple degrees comes to an end, it would be reasonable to see indicators at extreme levels.
A correction will come, but it looks like it may not be here yet.
DAILY CHART
Click chart to enlarge. Chart courtesy of StockCharts.com.
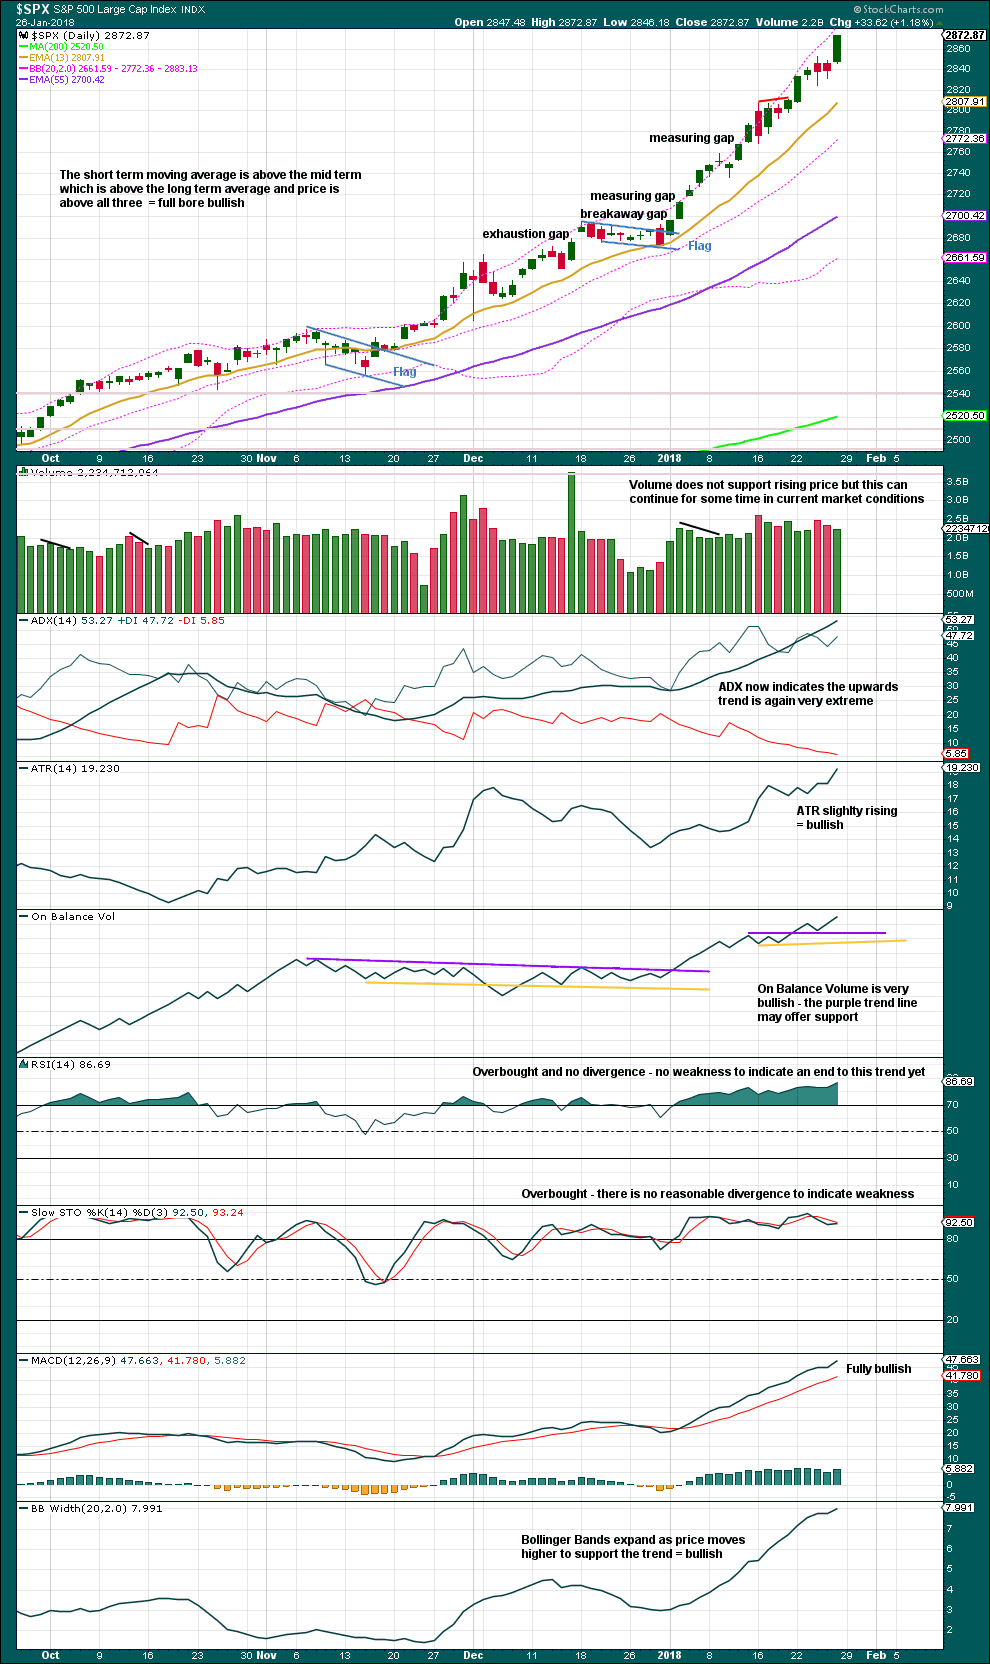
There is still no reasonable divergence to indicate weakness. This trend is extreme and overbought, but that can remain for long periods of time when this market has a strong bullish trend.
VOLATILITY – INVERTED VIX CHART
Click chart to enlarge. Chart courtesy of StockCharts.com.
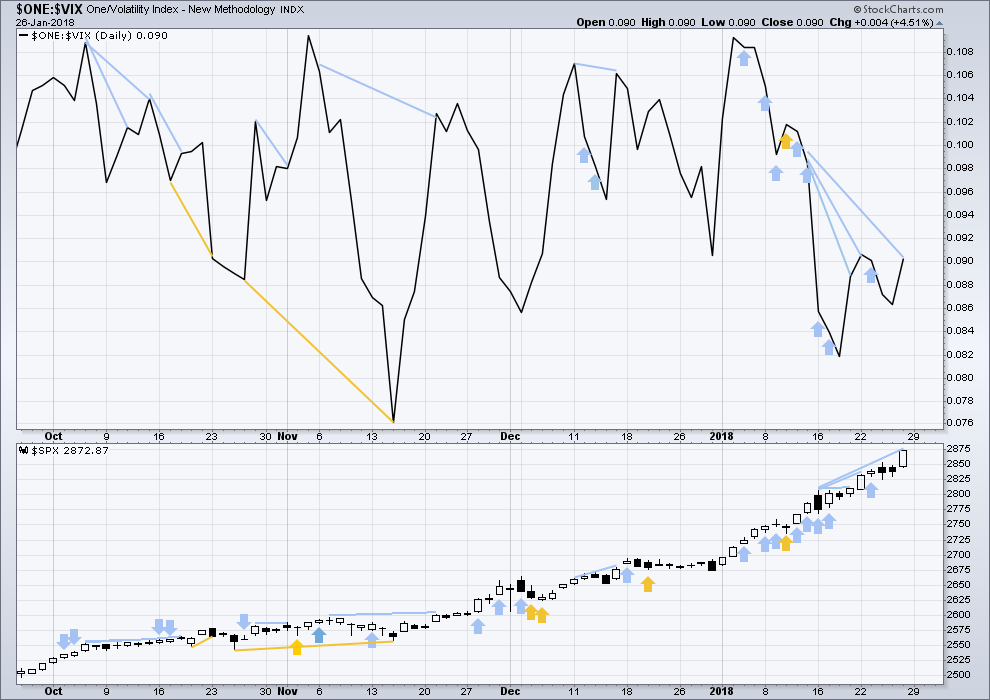
So that colour blind members are included, bearish signals will be noted with blue and bullish signals with yellow.
Normally, volatility should decline as price moves higher and increase as price moves lower. This means that normally inverted VIX should move in the same direction as price.
There is still strong short term divergence between price and inverted VIX. The new high in price has not come with a normal corresponding decline in market volatility. This is bearish.
However, this bearish divergence so far of late has failed to result in any reasonable downwards movement from price. It may be an early warning sign, but it does not appear at this time to be a useful timing tool.
BREADTH – AD LINE
Click chart to enlarge. Chart courtesy of StockCharts.com.
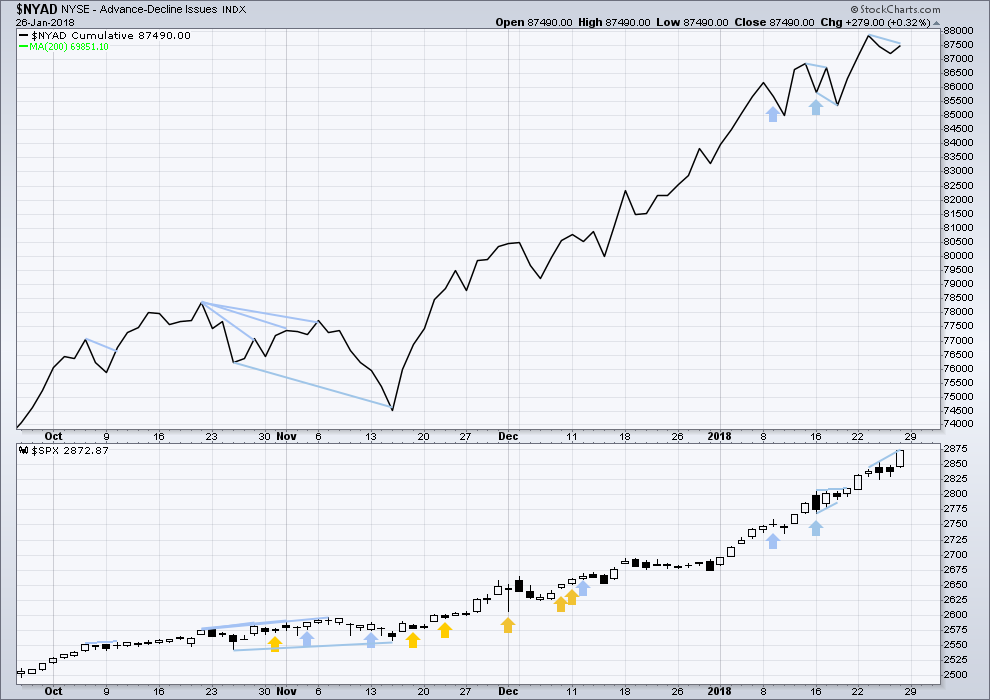
There is normally 4-6 months divergence between price and market breadth prior to a full fledged bear market. This has been so for all major bear markets within the last 90 odd years. With no longer term divergence yet at this point, any decline in price should be expected to be a pullback within an ongoing bull market and not necessarily the start of a bear market.
All of small, mid and large caps last week made new all time highs. This market has good support from rising breadth.
Breadth should be read as a leading indicator.
The new high in price on Friday is not matched by a new corresponding new high in market breadth. This divergence is bearish and indicates weakness in price, but it is not very strong.
DOW THEORY
The S&P500, DJIA and Nasdaq this week made new all time highs. Only DJT did not make a new all time high and has moved lower. This divergence is slightly bearish; DJT may be leading by beginning a correction first.
The following lows need to be exceeded for Dow Theory to confirm the end of the bull market and a change to a bear market:
DJIA: 17,883.56.
DJT: 7,029.41.
S&P500: 2,083.79.
Nasdaq: 5,034.41.
Charts showing each prior major swing low used for Dow Theory are here.
Published @ 09:15 p.m. EST.
Looks like we get a completion of the C down into the close
Not yet ovesold on the hourly or 15min, which has been the norm to produce a bounce. Maybe we actually get a few down days in a row.?….J/K
And with VIX closing above 13.50…..
It’s really interesting we got the alternate without any RSI bearish divergence; perhaps a harbinger of how sub-min 5 will end?
My best current take. Sub-micro 5 needed to complete micro-5 to complete a subminuette 3 I guess. Close by invalidation for the sub-micro-4 underway (2848.09). So my best take is new ATH’s ahead shortly. Could be wrong…the VIX is generally arguing otherwise!! Or perhaps just giving the heads up that the back to back to back sequence of 4’s then 5’s is going to create tons of chop, i.e. there will be more volatility.
Definitely an ABC zigzag down. I have 2850.5 as a key decision point where A=C and C reaches the 1.27 extension of A as well. Or the low of the day at 2855, another key decision point here.
Yep! Now let’s get that final wave up and take some market makers to the wood-shed! lol! The initial impulse down is gonna be steep. all eyes are on this correction do doubt and they know what is next. I am ignoring the indices and strictly playing the long vol on this one; should be positively explosive!
Have a great evening all! 🙂
Kevin,
Timing can’t be better as major tech giants report earnings in the coming days. Some more selling expected tomorrow.
A lot of them are setting up for impulsive declines…
It is really amazing. Every time I start getting calls from the bullion dealers telling me about the death of the dollar and how it’s the right time to pile into precious metals I know I have confirmation of at least an interim top in the PM sector. It never fails, lol!
A little earlier today, I exited my long volatility position. One day’s work with a 10% gain just to mark the day. I believe that is called ‘scalping’ the market. I don’t like day trading. My preference is the longer term trend where I do not need to be by the computer hour after hour each day. I not only don’t like that, it is not practical in my life. But today it worked.
Now lets see if the bottom of this correction is in or if it will require another dip. But higher SPX prices lie ahead and we have those EW targets to guide us.
Nice scalp. That fat VIX candle says we are not quite done! 🙂
This weekly chart of VIX helps me with context. This VIX move isn’t all that large, and well within the secular downtrend of the VIX. And it dramatizes the expectation that soon enough, the VIX will settle back down, which is arguably the sure thing trade. Then I look at the XIV chart weekly, and I see multiple similar multi-week pullback periods like this one in process, following by steady weekly rises. I’m on the scent for a similar set up here over the next few days or week or two. This is how I prefer to play the VIX in the bull market. Note that XIV also tends towards uplift due to reverse contango. It’s a monster in it’s bull periods.
Here’s XIV weekly.
True it is not large, but it sure is steady, and the move above 200 day could be significant…
UVXY above upper B band. I expect the upcoming visit to lower B band will represent a monumental long vol trade opportunity! OOH- RAH!! 🙂
Island reversal in GLD. Significant? Or sound and fury…?! 🙂
What if we get a gap past 15????!!!!! Yikes!!! Could that really happen?! 😀
Looking for sharp C wave down to complete possible ZZ
Taking the money and running on WYNN puts. I don’t think it’s quite done yet but now due for oversold bounce. Looking for signs of sympathetic weakness in MGM…despite new 52 week high..
Muted selling pressure on VIX at 13…cat and mouse?!
Watching DRV 3X bear real estate ETF for back test of 200 day MA.
Another great candidate for mid to long term interest rate trade.
VIX gap area below 11.71. Remaining above bullish short term…
Have we got a developing big ED? 🙂
No smart retorts!
I see the slightly contracting trend lines top and bottom…but “I don’t think so”. Here’s how I view the action at this point. I could be wrong, and this 2 or (4) is in fact just an A of the 2 or (4). And if it’s an (A), then it’s probably a (4). But I’m going to go with the more bullish view until proven wrong (fresh lows today), because it’s been an obscenely bullish market for a long time.
Getting close to VIX 13 pivot. If the quant guys are right, we should see a strong market reaction to clearing that level…
Selling Feb 2 UVXY 10.00 strike calls for 1.12.
Opening bid for Feb 9 10.00 strikes for limit price of 1.10 on pullback…
I love the fact that VIX B bands are expanding to contain upward price movement. This is not some spastic, emotion driven, leveraged piling into long vol positions, but a steady, methodical accumulation by strong hands. The ideal scenario would be a monster red candle as the VIX Don Quixotes take a final tilt… 🙂
If we get an intra-day VIX gap past 13, it is going to start triggering margin calls, and even if not, risk management desks are going to get edgy. If that happens I will be making a rare foray into the futures market.
I am not as concerned with a move above 13 as I am with a close above 13. I anticipate a spike to that area quite soon followed by a rapid and furious attack downward. There is too much at stake for VIX to capitulate this easily. In the absence of a severe exogenous event I just can’t see this being the end. A sustained break above 13 would finally be the end of the downward brea in volatility followed the 2015 flash crash. That would be quite a development.
I agree. If they are going to react, it will be before session end to avoid a futures meltdown…
They have a new problem. If hedge funds are now going long vol, the intimidation game is going to back-fire with the higher lows continuing.
This trade is not going to even begin to get interesting until the short cohort begins to unwind and that is probably weeks or months away.
Some are not going to unwind voluntarily, but forcibly, after all, they have not had to for quite some time, have they not? 🙂
It could get super fun; a fast run down to 2557 pivot is my expectation for the next few weeks. However, the leverage long, and short vol trade could blow it up much more than that……but the Central Banks could stop it just as they have the past 9 years.
It sure is starting to look like my long standing thesis about the earliest sign of trouble coming in the bond market is playing out. Rates are steathily heading upward, and this will eventually affect equities. There are two arenas in which the retail trader/investor can usually trade with the banksters on a fairly even playing field. One is interest rates which the cannot fully control.
The second used to be volatility as under normal circumstances, justifiable fear and normal risk aversion cannot be artificially suppressed. We have talked at great length about the unprecedented paradigm shift in this second arena with the phenomenal distortion of risk perception. That is going to change. Vol will once again become a one-way trade, but in the opposite direction from the recent trend. SVXY should take out 100 after the next bounce.
I hear the sound of the VIX yelling “market sell off due soon” (minutes, hours, days?). It’s going up like a rocket while the market stalls at it’s ATH. The current trends are unsustainable; either SPX holds and the VIX collapes back some, or, vice versa, and I expect the vice-versa. 2847 is about the 62% retrace of the Jan 25-26 upmove, the most likely decision price for a turn back up if SPX gets down there. But first is 2856, the 38%, and sometimes 2851, the 50%. here it goes…
Or maybe it turns at only it’s 23.6% retrace at 2862? That’s pretty darn bullish, and surprising giving the intensity of the VIX spike, but who’s to argue? We’ll see if it holds though. I’m just a bit doubtful.
Expect a violent reaction as VIX flirts with the 13 pivot during this small fourth wave. Any move below 11 is a screaming buy….
Adding to long dollar position via UUP in mid term account.
Opening TMV trade with sale of Feb 16 19 strike naked puts with intent to take delivery of shares.
Re: uup, one analyst I listened to over the weekend characterized this up move as a wave 4 bounce, I haven’t done my own work up to validate, so just FYI.
A lot of analysts are calling a wave four and they could be right. The reversal from a triplet of key pivots last week was quite dramatic, and looked to me like a capitulation bottom. I would welcome another opportunity to lower my cost basis though.
Well, I will admit to this forum, most of whom will think I am crazy, I have entered into my first / beginning position of long volatility on US equities. I know, I know, this market is crazy strong / bullish and most will think I must be suffering from delusion. Perhaps. Nevertheless, that is what I have done.
Looking at historical charts going back to the beginning of this bull market in 2009, I have noticed a few things. All indexes but RUT are at historically high MACD readings. These are lofty patterns which I think will soon run out of air. They have a long way to fall.
Kevin’s scenario in the comments just below sounds very logical and makes a lot of sense. If everything goes according to plan, we should see increasing volatility with the completion of 4-5 wave patterns. But, my experience has been that Mr. Market doesn’t always make it so easy. In fact, Mr. Market likes to stab and gore the majority.
So, we shall see. I wait with anticipation as I have entered this contrarian small long volatility position. I will look for opportunities to add to that position.
Have a great day.
A lot of traders who try to play vol AFTER the turn is obvious are going to have to deal with some truly atrocious spreads. I am actually planning to take delivery of UVXY shares from in the money call options and start selling covered calls on the final waves up. It is going to get very interesting the next few weeks!
Staring at the weekly chart…wow, just wow. I expect that (1) there will be a slowdown in the momentum. It can’t keep up at this torrid pace, and the EW count corroborates that. The momentum slow down will be a function of price working through a series of small (but consistently getting larger) 4’s, each followed by 5’s to new highs. Eventually the market will move via that process from the current smooth rocket ship up, to a much more toppy looking, wide chop (but still rising) market. Buying and holding will begin to get more challenging, as the conditions should be quite different from what’s we’ve had in the last 2+ years, with larger and larger chops (4’s) down. My strategy overall is to enter aggressively and in an incremental manner on the bottoms of each successive 4, and ride a very large bite of the following 5 up, peeling off profits as it goes. Of course the devil is always in the details…best of success to all this next week. May the 4 waves not surprise us!!
One curiousity and perhaps leading indicator: while the VIX tanked late Friday with the market….XIV did the OPPOSITE. Very unusual. XIV is based on a blend of VIX futures markets extending out many months, while the VIX proper is only discounting SPX volatility in the 15-45 day range. So what this says to me is (shock and awe) the smart money (those working the volatility markets) are aware that these larger 4’s are rolling in to shore over the next several months, and are adjust VIX expectations out in time appropriately in the VIX futures markets. Which in turn confirms what we expect: spikes DOWN in the VIX now should start becoming themselves ever larger opportunities, as when each 4 wave hits, the VIX is going to spike higher…and again higher. So on the wave 4 side, there are three fundamental strategies for profiteering: be flat; be short the market; be long the VIX.
It is quite fascinating what is happening with the vol futures trade. I suspect it is a combination of not only the short cohort making a timely exit, but also possibly a new long cohort aggressively taking the other side of that trade. We could see some fire works.
Holding onto UVXY 10 strike calls rolled from last week for 0.39 apiece…
Another interpretation of the alternate hourly is that the upward action shown as micro-5 is in fact sub-micro-1 of micro-5. If so, the depth and timing of any pullback here has to differentiate between a sub-micro 2 vs. a subminuette 4. I’ll lean toward toward sub-micro 2, and eventually more proportionality of micro-5 with micro-1 and micro-3, until proven otherwise.
Wow. Am I first this week?
Yep. You win Alan 🙂
Moi, was enjoying a restful week-end Doc…!
VIX trades are up silly, selling half
I am trying to roll to Feb week two! 🙂