Upwards movement was expected to continue from last analysis, which is what has happened. The short and long term targets remain the same.
Summary: The Elliott wave target is at 2,616 and a new target from a small pennant pattern is 2,617. While On Balance Volume remains very bullish, weakness today from volume and bearish divergence with the AD line and RSI indicate weakness here. It is possible that a multi day pullback may begin here and the target may not be met.
However, assume the trend remains the same until proven otherwise. The trend is up.
Pullbacks should be used as opportunities to join the upwards trend.
Always trade with stops and invest only 1-5% of equity on any one trade.
Last monthly and weekly charts are here. Last historic analysis video is here.
MAIN ELLIOTT WAVE COUNT
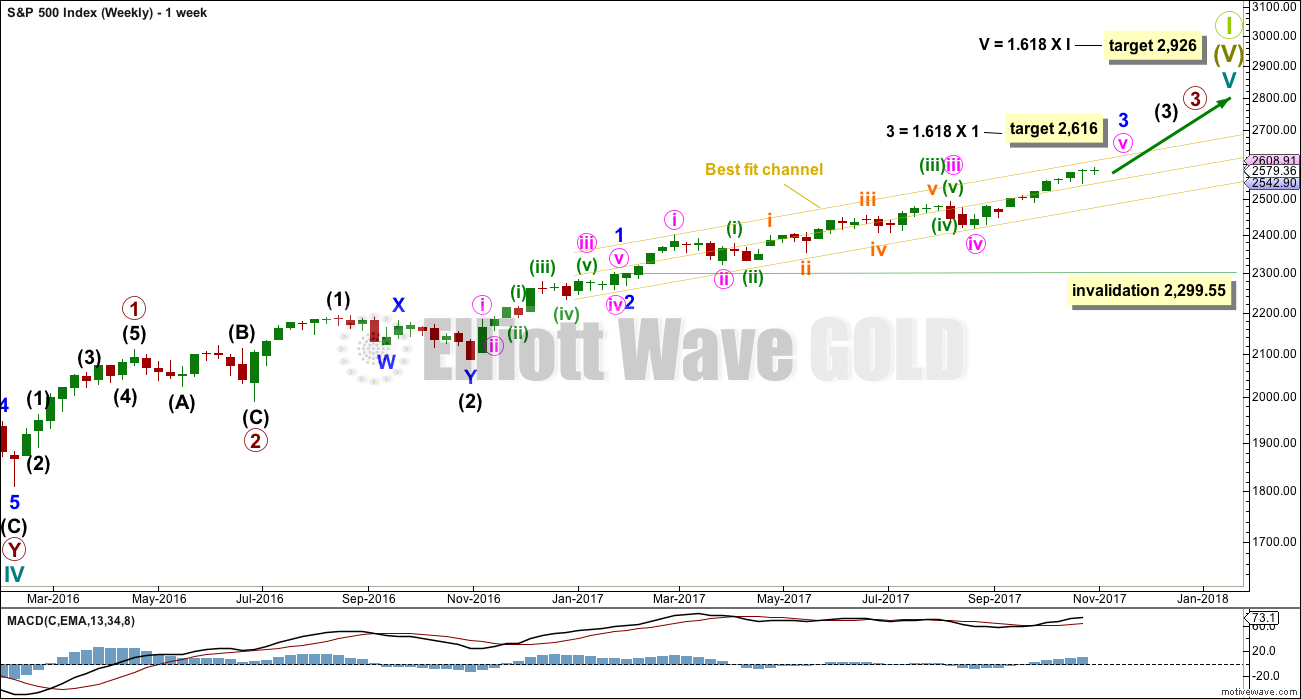
WEEKLY CHART
This wave count has strong support from another bullish signal from On Balance Volume at the weekly chart level. While classic analysis is still very bullish for the short term, there will be corrections along the way up. Indicators are extreme and there is considerable risk to the downside still.
As a Grand Super Cycle wave comes to an end, weakness may develop and persist for very long periods of time (up to three years is warned as possible by Lowry’s for the end of a bull market), so weakness in volume may be viewed in that larger context.
Within minute wave v, no second wave correction may move beyond the start of its first wave below 2,417.35.
The next reasonable correction should be for intermediate wave (4). When it arrives, it should last over two months in duration, and it may find support about the lower edge of this best fit channel. The correction may be relatively shallow, a choppy overlapping consolidation, at the weekly chart level.
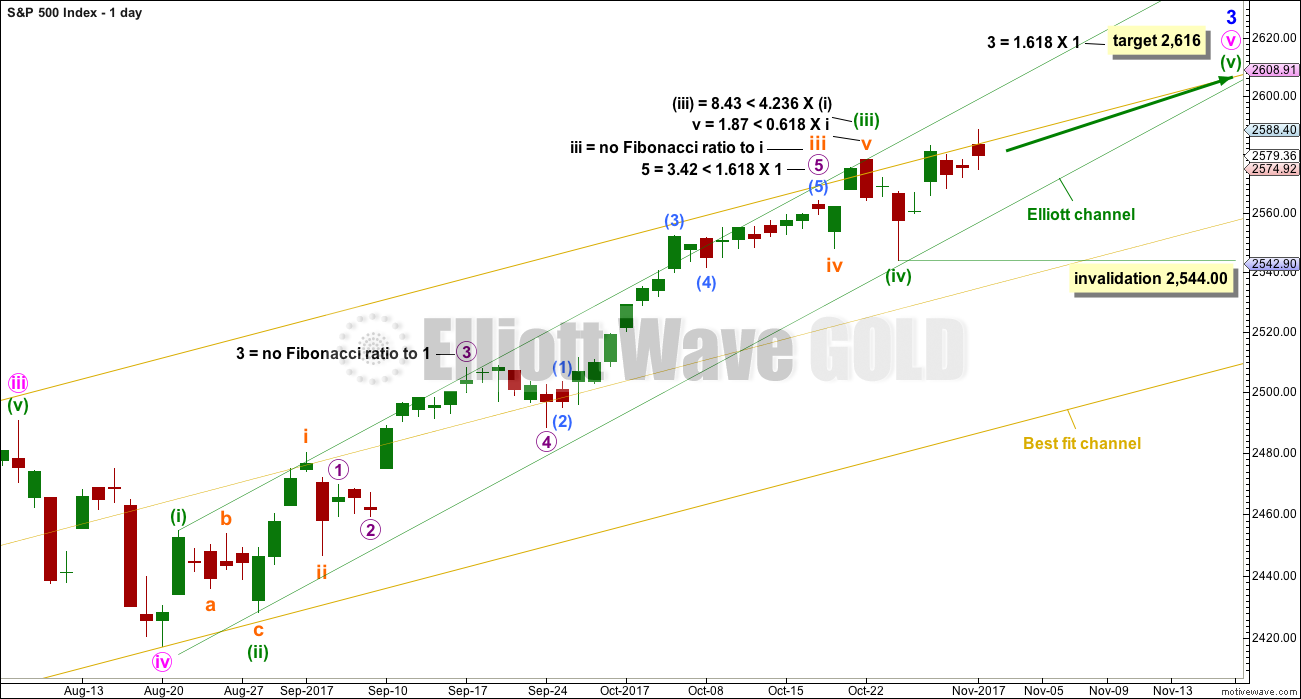
DAILY CHART
Friday looks like a classic upwards breakout from a small consolidation. A breakout is a bullish signal.
The target for minor wave 3 expects to see the most common Fibonacci ratio to minor wave 1.
Within minuette wave (v), no second wave correction may move beyond the start of the first wave below 2,544.00.
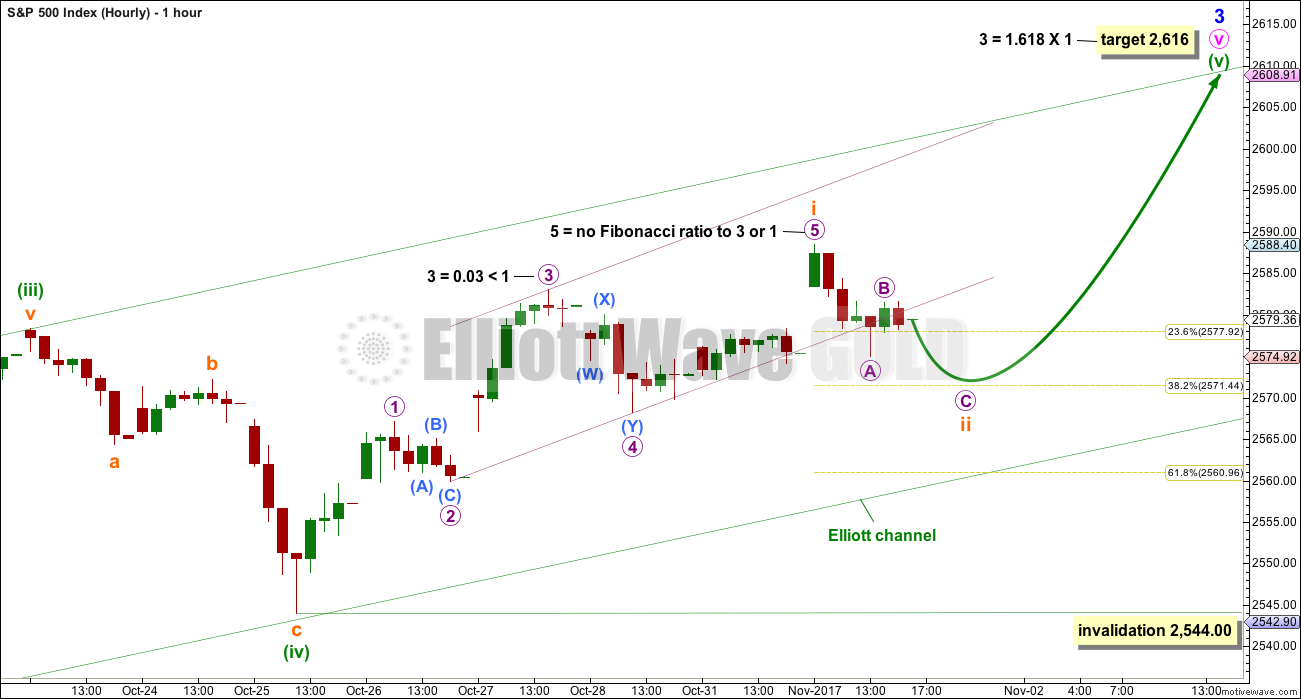
HOURLY CHART
Assume the trend remains the same until proven otherwise. Assume the trend remains up while price remains within the green channel and above 2,544.
Minuette wave (v) must subdivide as a five wave structure. It may be an impulse with subminuette wave i complete. Subminuette wave ii may continue a little lower tomorrow to end about the 0.382 or 0.618 Fibonacci ratios. Because the 0.618 Fibonacci ratio would see the green channel overshot, the 0.382 Fibonacci ratio looks more likely in this instance.
A breach of the green channel by downwards movement would be the earliest indication that this first wave count may not be correct. If that happens, then seriously consider the alternate hourly wave count below.
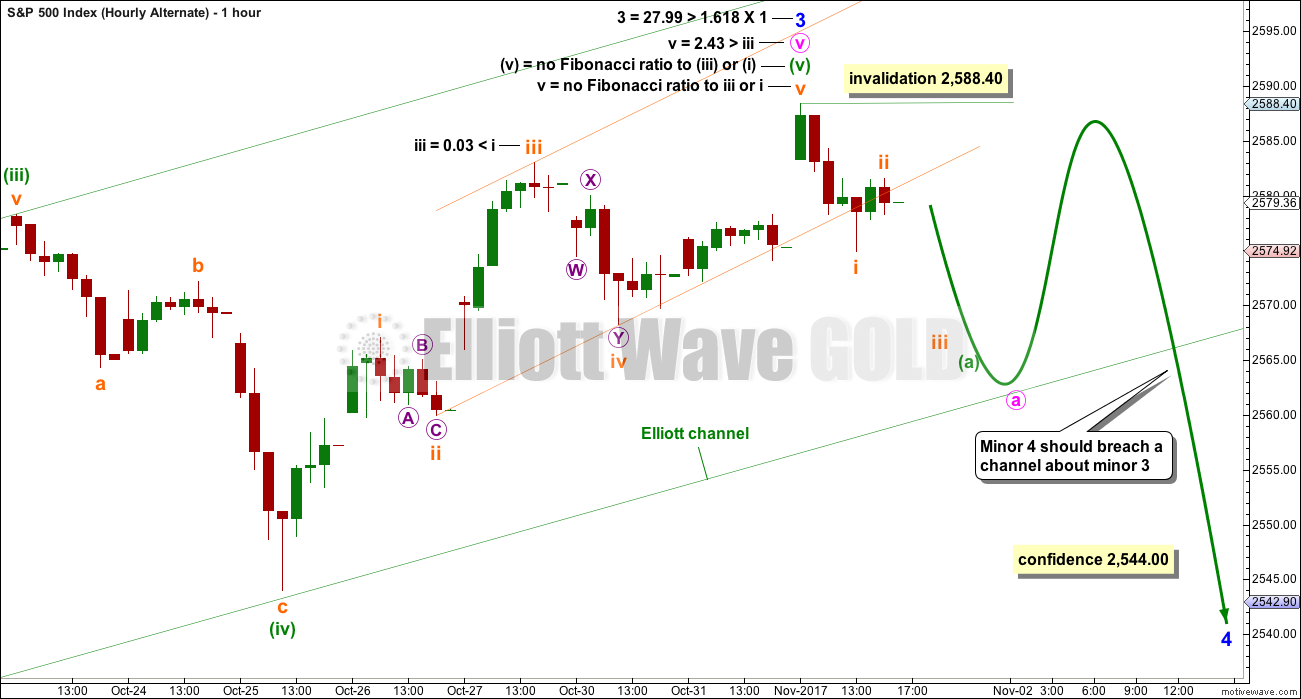
ALTERNATE HOURLY CHART
This alternate simply moves the degree of labelling within the last five up all up one degree. It is possible again that minor wave 3 could be over.
A new correction at minor degree should begin with a five down on the hourly chart. While this is incomplete, no second wave correction may move beyond its start above 2,588.40.
Minor wave 2 was a quick shallow 0.16 zigzag lasting just three days. Minor wave 4 should also show up at the daily chart level. It may be a sideways consolidation, subdividing as a flat, combination or triangle, to exhibit alternation with the zigzag of minor wave 2. These structures are often more time consuming than zigzags, so a Fibonacci five or eight days may be likely.
TECHNICAL ANALYSIS
WEEKLY CHART
Click chart to enlarge. Chart courtesy of StockCharts.com.
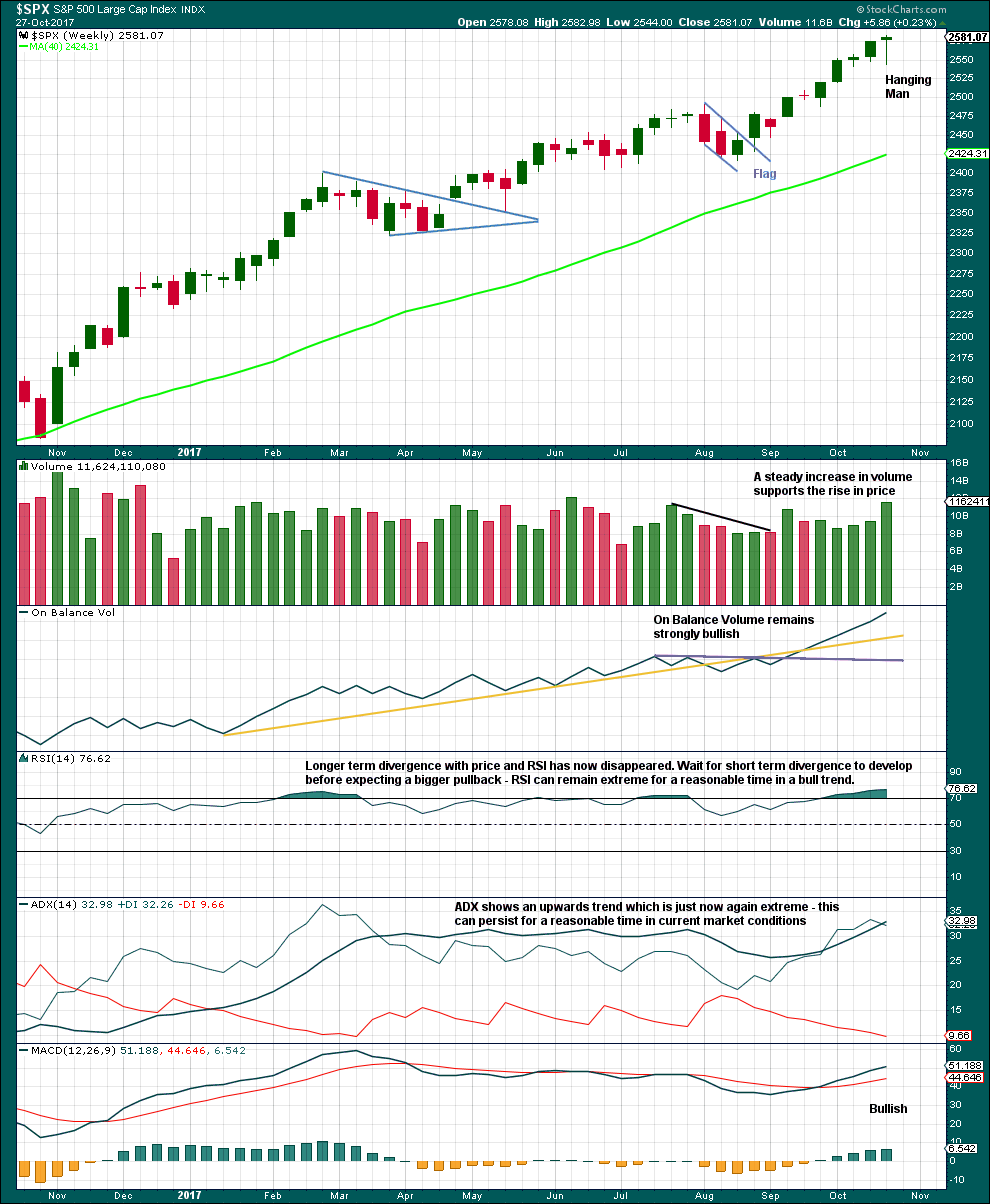
The Hanging Man candlestick requires bearish confirmation because the long lower wick has a strong bullish implication. Without that bearish confirmation, it should not yet be read as a reversal signal and only as a possibly developing reversal signal.
Overall, this chart is fairly bullish. Only extreme ADX sounds a warning, but most recently this has reached extreme at the weekly chart level and remained so for several weeks while price continued to rise. It may do so again.
DAILY CHART
Click chart to enlarge. Chart courtesy of StockCharts.com.
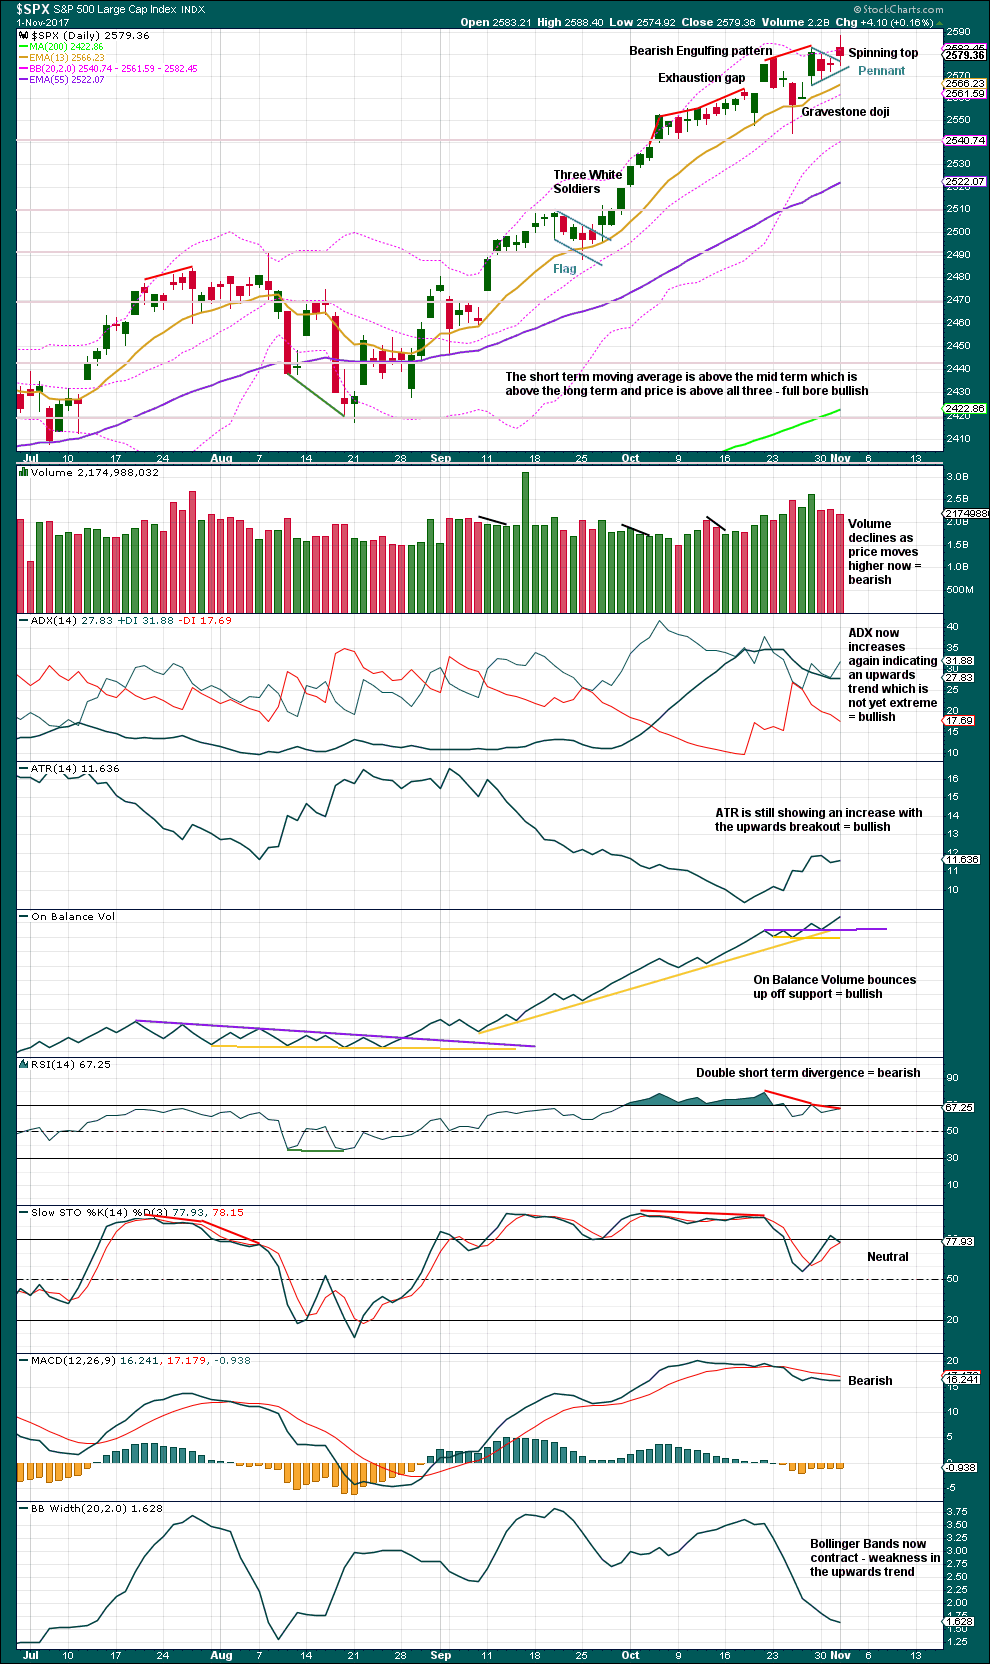
Pennants are one of the most reliable continuation patterns. The measured rule calculates a target about 2,617. Because this is only one point off the Elliott wave target, this area may offer strong resistance.
There is some weakness, now becoming evident, with double divergence between price and RSI, the same with Stochastics, and weakness today from Volume and contracting Bollinger Bands.
On Balance Volume remains very bullish though.
This weakness signals risk to long positions, but on its own is not enough to signal a trend change from up to down or sideways.
VOLATILITY – INVERTED VIX CHART
Click chart to enlarge. Chart courtesy of StockCharts.com.
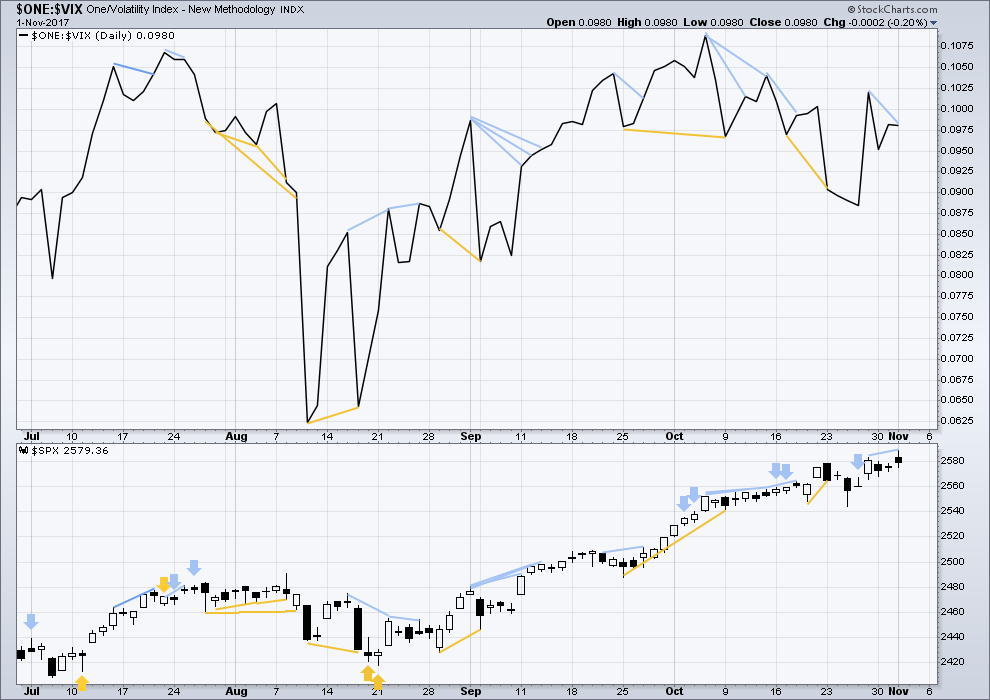
Normally, volatility should decline as price moves higher and increase as price moves lower. This means that normally inverted VIX should move in the same direction as price.
There is new short term divergence today between price and inverted VIX: price has made a new high above the prior high of three days ago, but inverted VIX has not. The upwards movement in price has not come with a normal corresponding decline in market volatility. This divergence is bearish.
BREADTH – AD LINE
Click chart to enlarge. Chart courtesy of StockCharts.com.
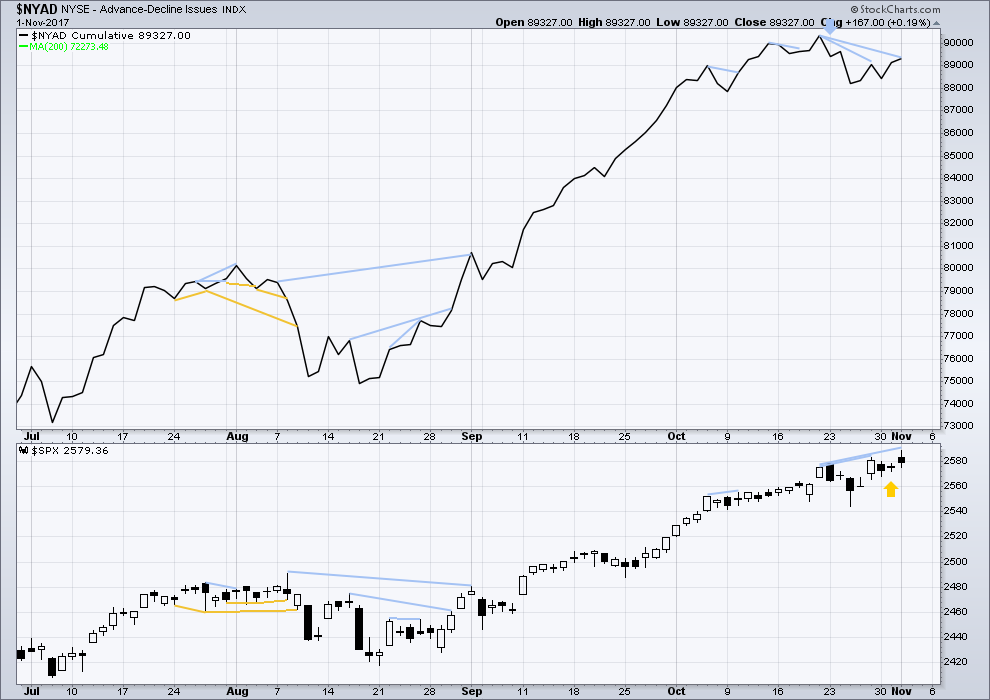
There is normally 4-6 months divergence between price and market breadth prior to a full fledged bear market. This has been so for all major bear markets within the last 90 odd years. With no longer term divergence yet at this point, any decline in price should be expected to be a pullback within an ongoing bull market and not necessarily the start of a bear market.
Bullish divergence noted yesterday has been followed by an upwards day to a new all time high. It may now be resolved, or it may need another upwards day to resolve it.
There is new mid term divergence now between price and the AD line: price has today made a new all time high above the high seven sessions ago, but the AD line has not made a corresponding new high. This divergence is bearish and indicates that the rise in price today does not have support from rising market breadth, so price is weak.
DOW THEORY
At the end of last week, DJIA and DJT have failed to make new all time highs. The S&P500 and Nasdaq have made new all time highs. DJIA and DJT have failed so far to confirm an ongoing bull market.
Failure to confirm an ongoing bull market should absolutely not be read as the end of a bull market. For that, Dow Theory would have to confirm new lows.
The following lows need to be exceeded for Dow Theory to confirm the end of the bull market and a change to a bear market:
DJIA: 17,883.56.
DJT: 7,029.41.
S&P500: 2,083.79.
Nasdaq: 5,034.41.
Charts showing each prior major swing low used for Dow Theory are here.
Published @ 07:26 p.m. EST.

AAPL just guided 84-87 Billion for Q1.
Simply mind-blowing.
Market Cap 2.586 Times that estimated revenue annualized for next 12 months. $87 Billion X 4 = $348 Billion and we know that ain’t happening! Market Cap $900 Billion estimated
Market Cap 3.926 Times Trailing Revenue of $229,224 Billion
Market Cap $900 Billion estimated
Yes… Stock Valuation “Simply mind-blowingly over valued”! Just like every one of these large stocks
Going to $200…I think we ramp higher tomorrow on NDX and SPX. Valuation are certainly out of whack but play the market as it is ignoring the fundamentals big time.
Very interesting price action in IWM. Despite huge bearish engulfing candle, we are not seeing any B band expansion whatsoever. We could get a monster gap down as B bands blow out from that protracted compression….
Updated main hourly chart:
Subminuette wave ii looks like a nice zigzag now. It’s very likely to be over. But if it moves lower as a double zigzag or flat correction then it should find very strong support at the green Elliott channel.
IYT puts getting close to re-load trigger, now bid at 1.85. I am in at 1.75 if I get filled….
VIX back below ten on deck, opening BTO order for 10.00 strike calls for 0.95 or better…one half full order…
Looking like maybe 1-2, 1-2 off this morning’s low…
I think we are starting to get some hints about how the reversal will unfold when it does arrive. Long lower wicks lately have very reliably portended several additional days of an upward grind. If we have an intra-day reversal as opposed to my expectation that its going to come in overnight futures, I think we could expect to see selling pressure overwhelm an initial long lower wick which is always evidence of deep pockets stepping in to arrest an initial strong decline. If that happens, it would strongly suggest start of a loss of bankster control….
Don’t want to be dogmatic about this, but a cursory looks at trendlines suggests we could have a leading expanding diagonal underway…
hoping to re-snag those 175 IYT puts for 1.75 or better but I don’t think it gonna happen, at least not today…
I’ve taken advantage of this ii set up by getting long SPX via UPRO earlier this morning. Nicely in the green now. I’d like to hold through the entire 3-4-5 up. Very difficult for me as I didn’t meet an open profit I didn’t enjoy cashing, but…cashing early is one of my trading weaknesses, so I’m committing to using this SPX trade to manage one differently, using EW instead of “green enough!”. And having the support of professional analysis in developing this skill is why I’m here; I need confidence in the count!!
Kevin,
I am still hoping for a drop to get long on SPX tempted but holding off for now.
I’m still more than skeptical about the upside target of 2616. If AAPL has a blowoff quarter and the tax bill passes through quickly I can see it happening, but the upwards velocity has been weak the last two weeks. Last Friday was really the only blowoff day and we are set to have our worst week since August.
There’s been some 4 action resulting in aggregate reduced momentum. Going to be more, and larger, but with ever increasing ATH’s. I trust the count, independent of specific targets.
VIX battle ground apparently now shifted to 10.50 from 10.00…
Taking a bit different approach on vol.
Selling to open Dec 15 expiration UVXY 15 strike puts for 2.35. I am willing to be assigned the 1000 shares at a price of 15.00 if UVXY is trading below 15 on Dec 15 , 2017.
Obviously below UVXY 12.65 this trade looses money and will have to be hedged…
Man I hate a crowded trade. Why the h e double tooth picks couldn’t they send VIX down one more time…rats!!
So SPX price has started a subminuette 3 (of a minuette 5). The prior subminuette 3 (of a minuette 3) took something like 31 days!!!! I’m guessing this one will be much shorter, but on the other hand, I doubt it’s going to be just a day or two affair (like the truncated subminuette 5 we had recently).
Kevin,
All depends on velocity of move, if it goes to tag 2561/2544 in a hurry the move might be done in a day or so but I suspect the markets will keep majority players baited on the long side and hence will be a bit longer affair. Some other models are precidting Nov.09/10 to be the day it hits the marker for the turnaround. I seriously hope it overshots the target on the downside. However, for now just wait and watch..
TZA might move first as IWM likely to be hit sooner relatively to others.
Indeed, the price to cover to get to the minor 3 target from this morning’s subminuette ii bottom is about 1/2 of the price range of the prior subminuette 3, indicating a much more rapid cycle time is likely.
I sold those IYT puts too soon because of impatience and not trusting the chart evidence. Hard to stay disciplined with all the manipulative crap going on….now bid at 2.15, ask 250 and I could have easily got 2.30…
Chris I think they are on to us bud. It looks like traders are now BUYING, instead of selling the VIX ten pivot….too bad…! 🙁
Yes, our friends on the smarter side of the institutional sphere are done selling vol and now will buy every dip until it explodes. the “passive exposure” to short vol will be lit up in the next 6 months me thinks.
C’mon baby light my fire…!
Gotta set the night on….FIRE!!! 🙂
Prechter attributed the massive futures short to large speculators but I have to wonder how much of that could be due to hedging by the actual issuers of vol instruments in response to remarkable current short interest evident in vol traders….
Despite that fat bullish engulfing candle and those boa constrictor B bands, there are actually morons trying to short that rocket ship today…Yikes!! 🙂
For TZA that is…
The running stories on the news papers and the media on tax reform is necessary to stoke the fire, that’s what the media loves to do. But the anticipating objections from officials are still to come and this will determine if the importance of “keeping things simple” on taxes and the reduction will actually get passed this year. The political heat is about to raise but what’s even more important is sniffing who will be the next FED chair. I certainly expect stings that will hurt in the market from the aftermath. As much as I like investing I’m keeping thing simple until we start trending again.
Keep in mind, the move from 11-8-2016 to today has priced into current market prices… the Tax Cut and Reform Bill that was released today!
The Fed Chair is Powell as that is what has been reported and confirmed by the business press. Unless President Trump throws a curve ball at this late stage, The new Fed Chair is also priced in.
What??!! No smashing VIX back under 10??
C’mon guys…you can do it, I need another couple dozen calls….PLEEEZE! 🙂 🙂 🙂
You gotta just love the baksters. That long lower wick indicative of yet another massive cash dump. As market stress ramps up, expect to see more and more of them. Another oppportunity to grab a boatload of VIX sub ten contracts…he! he! 🙂
Selling IYT puts for 1.90
Will reload on bounce.
Selling half VIX 10 strike calls for nice double…
Will reload on any sub ten visit…rinse and repeat…
Spoke too soon? 🙂 ha!ha!
Mean reversion is a law of Nature. It does not exist because it can be mathematcally calculated, but rather, it can be mathematically calculated BECAUSE it exists.
Periods of low volatility are always followed by periods of high volatility. Extended periods of low volatilty would also expect commensurate periods of high volatility.
Here is what’s really interesting. Fear is more powerful than greed. That is why bear markets unfold much more quickly than bull markets. Applying this reality to mean reversion and volatility, we see there is more than one way for it to happen. Either you may have an equal period of correspondingly higher volatility as the prior low vol period, OR, you may get a shorter period of substantially HIGHER volatilty, as compared to the low vol seen during the longer period.
What do you think is more likely?
Capisce??! 😉
I knew the Astros would win the whole time.
Poor Dodgers, also rans AGAIN! 🙂
Clearly no impulse down this morning. Looks like we will see a bit of tweaking of the current counts…failure to decisively close the gaps usually means more upside grind…
Winning! loads of greens here 🙂
An explosion! Yowza!!! 🙂 🙂 🙂
Dinner’s on you bud…!
Indeed, tagged out, re-loading again. This is about the 6th time in a row!!!!!
Easy money baby! 🙂
Oops. Clearly “no” just became clearly “yes”! Ah, I got shaken out of VXX just before it popped myself, shucks.
Now the play is to get the long side on the lows here. Looks like it may go all the way to the 61.8% around 2561, or hold here at the 50% at 2566. The SALE IS ON!!!
It will be another uneventful day and not worth the tme oggling directionless price action. Cash infusions will continue resulting in more sideways action untl we get a catalyst that exposes the market’s underlying weakness, and we begin to see fear more commensurate with actual market risk. There is I think a slight chance VIX could signal this intra-day, but I remained convinced, for any number of reasons it will be an after hours event. Have fun watching the drying paint! 😀
To your point, futures actually broke down last night. Needs to be 2-3% though to really get it going in my opinion.
For those interested, here is the link to the Robert Prechter interview from Fox business today that I posted about:
http://www.foxbusiness.com/markets/2017/11/01/bear-market-that-will-make-its-mark-is-looming-ahead-robert-prechter.html
Thank you for posting this, Joseph! It looks like Prechter has learned to pull his punches somewhat. Some day he will be right.
[Some day he will be right.]
You need to be fair… he has been very right at times and wrong at times.
He did call a Top right in May/June 2015… it did not ultimately confirm in Feb 2016.
He says he called the reversal in Feb 2016… but it was not very clear at the time as we were going through it. I know because I still had my subscription then. To his credit he did make it very clear after it became very clear 1 to 2 months after. He points to an unclear very short sentence before the fact as making the right call on that. To me if your making a reversal call… devote more than that in your report so that readers know for sure what you are really thinking.
He was also very wrong in 2012. At each point that he was wrong or not clear… the Fed Stepped in with QE right at the confirmation point of the Bear move, in my opinion, as if the Fed were charting EW’s and executing action to block said confirmation.
He was very Right in 1980/1981 when I first had the opportunity to read his material on making the Bullish call that was very right for 1982 & beyond. Nobody was calling that reversal as the Democrates was saying Reagan’s policies were going to destroy the country… nothing changes in 3 years… except 80% of the media screams louder.
So in my opinion you have to take what he says seriously as to what may happen. Just as following Lara’s great analysis… but even Lara says she may be wrong. All information is good information.
When you put your own money on the line, you take it all quality information in plus add in your own experiences/knowledge and make a bet. After all, that’s all it really is a bet! I don’t believe the Fed will step in with QE on the initial stages of the next bear wave… as they are very committed in reducing the balance sheet which started on October 1st.
correction 35 years. Plus add… very few were making that reversal call in the 1st half of 1982… all were very bearish at that time, single digit PE Ratios everywhere, multiples of revenue below 1 time everywhere, very high interest rates, no company buying back stock… it was considered a waste of cash and capital back then. IMO it will prove to be a waste of cash and capital again going forward.
If effect the polar opposite of today!
He did indeed call the 2016 reversal and he did it quickly after initially saying he thought a crash was underway. What was even more impressive is that he made that call intra-day as he was monitoring selling pressure and the a/d line. He correctly concluded that it was only a big fourth wave and not the beginning of the long expected market crash. EWI’s problem can is that they are absolutely disastrous in correctly assigning wave counts in the short and intermediate term and so are always getting the trend wrong. This is a long standing failure and it is incomprehensible to me that they have done nothing to change their approach. They are partucularly inept at spotting expanded flats and got them wrong every single time until after the fact. I am not sure why people pay for their service.
I don’t recall that reversal call the way you are now stating it.
It was way after the actual reversal is my memory. Prior to an unclear very short sentence with no conviction at all for that very short sentence.
I should see if I saved those specific issues on one of my laptops and re-read… but no time today.
Joeseph, I was still a subsciber and he sent out two interim reports. The first one mentioned the possibility of a crash underway. The next day he sent out another (very unusual) pointing out that the selling pressure instead of accelerating, had lessened considerably and reversed himself on the crash call…
Both counts calling for an impulse down, the main a C wave at micro degree, and the alternate a sub-minuette third wave. Whatever the degree it will be corrective as indicated by both counts. Declines, at whatever degree, are swiftly being arrested so scalping the moves is still the name of the game!
Not much interested in any serious trading until I see futures down 5% or better… 🙂
first of the month
Nicely done Ronald, nicely done.
just call me doc
O.K. Doc!