A strong Bearish Engulfing candlestick pattern is a strong warning of a trend change.
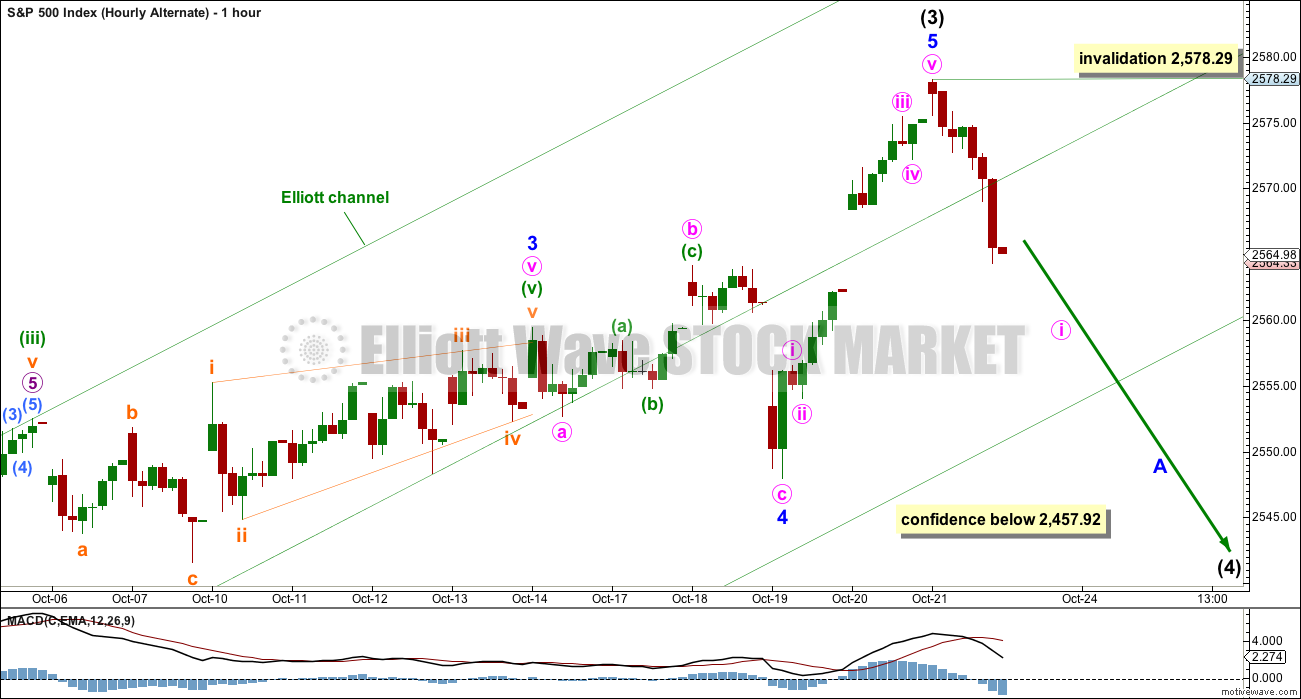
Summary: A fourth wave may have arrived. Reasonable confidence may be had in this view if price makes a new low below 2,457.92. The fourth wave may be relatively brief and shallow as minor wave 4, or it may be a much deeper multi week pullback or consolidation as intermediate wave (4).
Last monthly and weekly charts are here. Last historic analysis video is here.
MAIN ELLIOTT WAVE COUNT
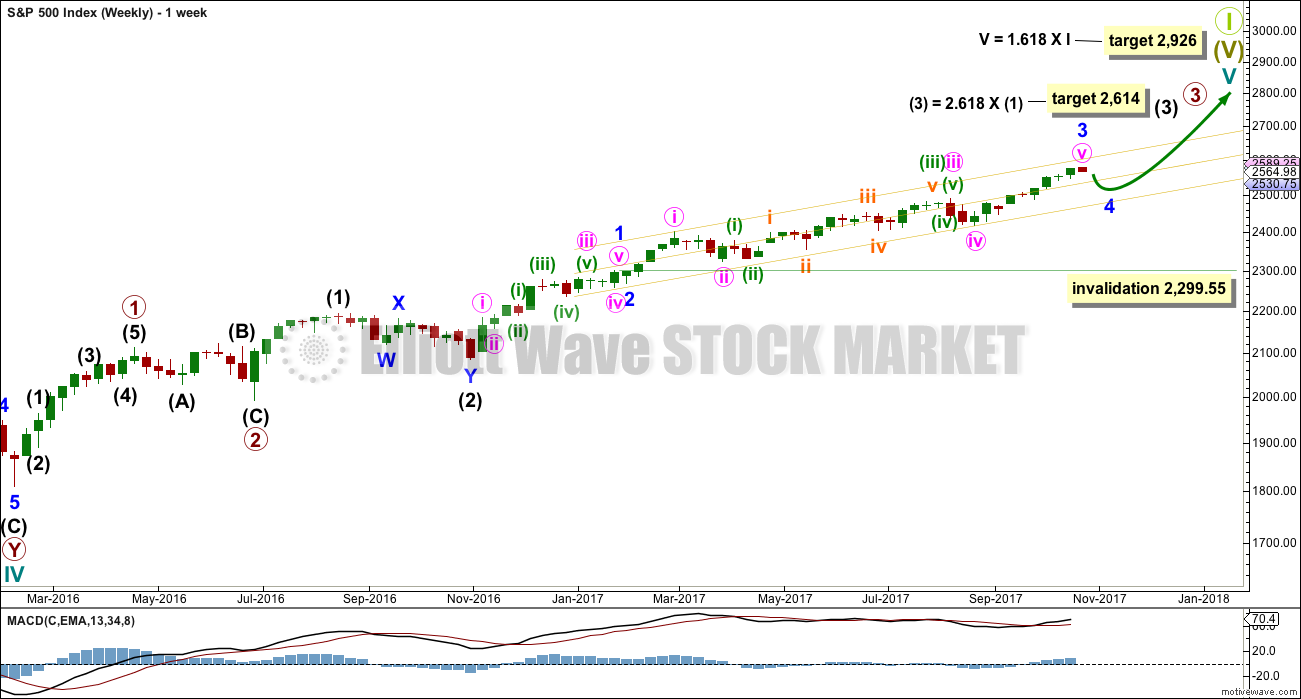
WEEKLY CHART
This wave count has strong support from another bullish signal from On Balance Volume at the weekly chart level. While classic analysis is still very bullish for the short term, there will be corrections along the way up. Indicators are extreme and there is considerable risk to the downside still.
As a Grand Super Cycle wave comes to an end, weakness may develop and persist for very long periods of time (up to three years is warned as possible by Lowry’s for the end of a bull market), so weakness in volume may be viewed in that larger context.
Within minute wave v, no second wave correction may move beyond the start of its first wave below 2,417.35.
The next reasonable correction should be for intermediate wave (4). When it arrives, it should last over two months in duration, and it may find support about the lower edge of this best fit channel. The correction may be relatively shallow, a choppy overlapping consolidation, at the weekly chart level.
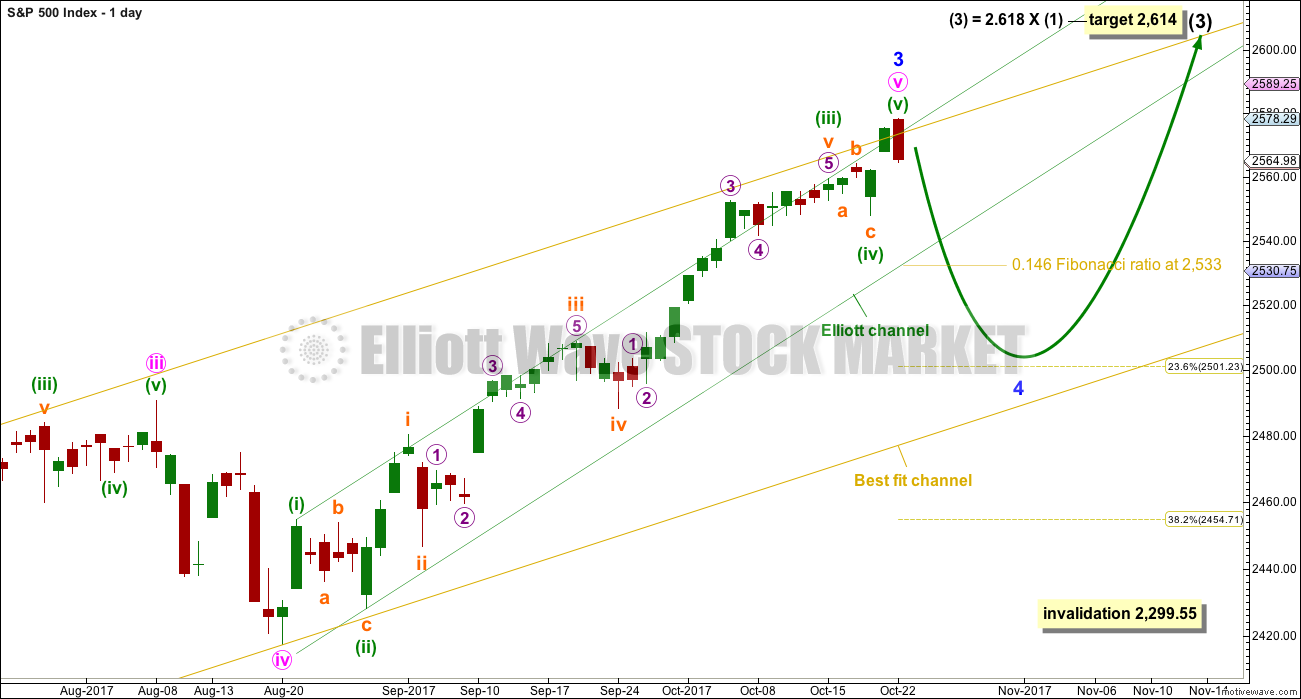
DAILY CHART
To see details of the whole of primary wave 3 so far see the analysis here.
Today’s strong bearish candlestick looks too large to be subminuette wave iv. This looks like minuette wave (v) is complete.
Minor wave 3 may today be complete and may not exhibit a Fibonacci ratio to minor wave 1.
Minor wave 2 was very brief at only three days. It is possible for good proportion that minor wave 4 could be as brief.
The 0.146 and 0.236 Fibonacci ratios should be first and second targets for minor wave 4 to end.
Minor wave 4 should break down below the green channel containing minuette wave (v). A breach of this channel would add substantial confidence in this wave count.
If minor wave 4 were to end within the price territory of the fourth wave of one lesser degree, then a target range would be from 2,490.87 to 2,417.35. The 0.382 Fibonacci ratio of minor wave 3 is within this range at 2,455.
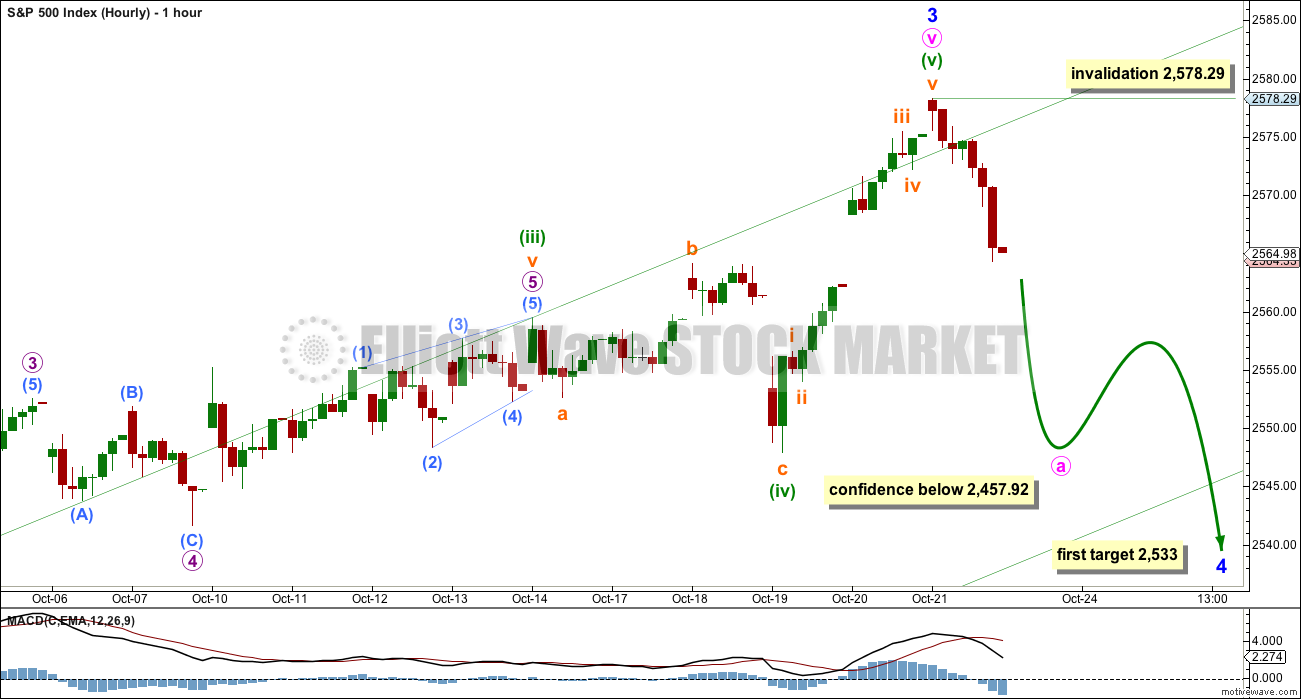
HOURLY CHART
Downwards movement looks to be too large to be a part of the last upwards wave labelled minuette wave (v). This wave is a separate wave.
A new low below 2,457.92 would add reasonable confidence that a correction has arrived, but it will not tell us which wave count is correct.
Minor wave 2 was a quick zigzag, so minor wave 4 may exhibit alternation as a shallow and sideways flat, combination or triangle.
First, a five down should complete even for a correction at minor degree. That would be incomplete. While it is incomplete, no second wave correction may move beyond the start of its first wave above 2,578.29.
ALTERNATE WAVE COUNT
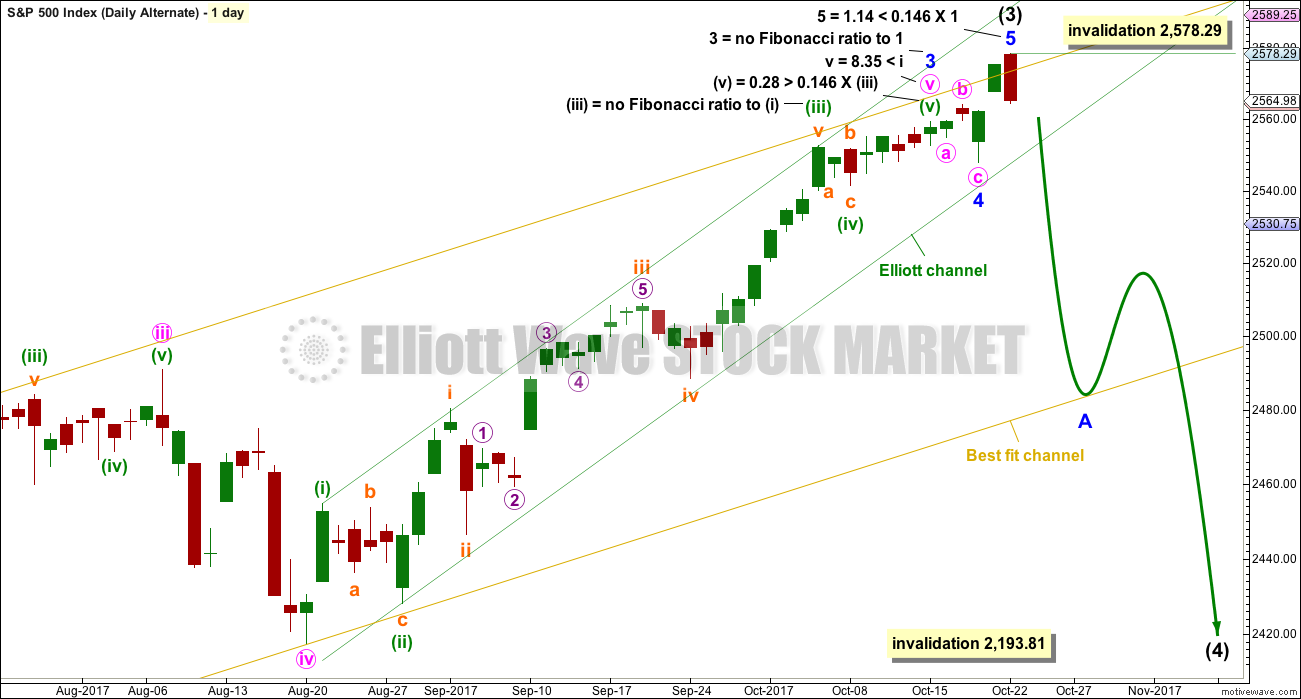
DAILY CHART
It is also possible that both minor waves 3 and 4 could be over.
My initial judgement was to label this as an alternate because of the brevity and shallowness of minor wave 4. This does not look right. However, there is still good alternation and good proportion with minor wave 2, which lasted only three days and was a zigzag. Here, minor wave 4 may have also lasted only three days and may have been a flat correction.
Intermediate wave (3) could today be over. A deep multi week correction for intermediate wave (4) may have arrived.
Intermediate wave (2) lasted eleven weeks and was a relatively deep 0.54 double zigzag. Intermediate wave (4) may be a shallow flat, triangle or combination to exhibit alternation. To exhibit good proportion, it may last about eleven weeks or possibly a Fibonacci eight or thirteen.
A new low below 2,547.92 could not be a second wave correction within minor wave 5, so at that stage minor wave 5 must be over. This would add reasonable confidence that a correction has arrived.
HOURLY CHART
A correction at intermediate degree should begin with a five down on the hourly chart. That would be incomplete. While it is underway, no second wave correction may move beyond the start of its first wave above 2,578.29.
TECHNICAL ANALYSIS
WEEKLY CHART
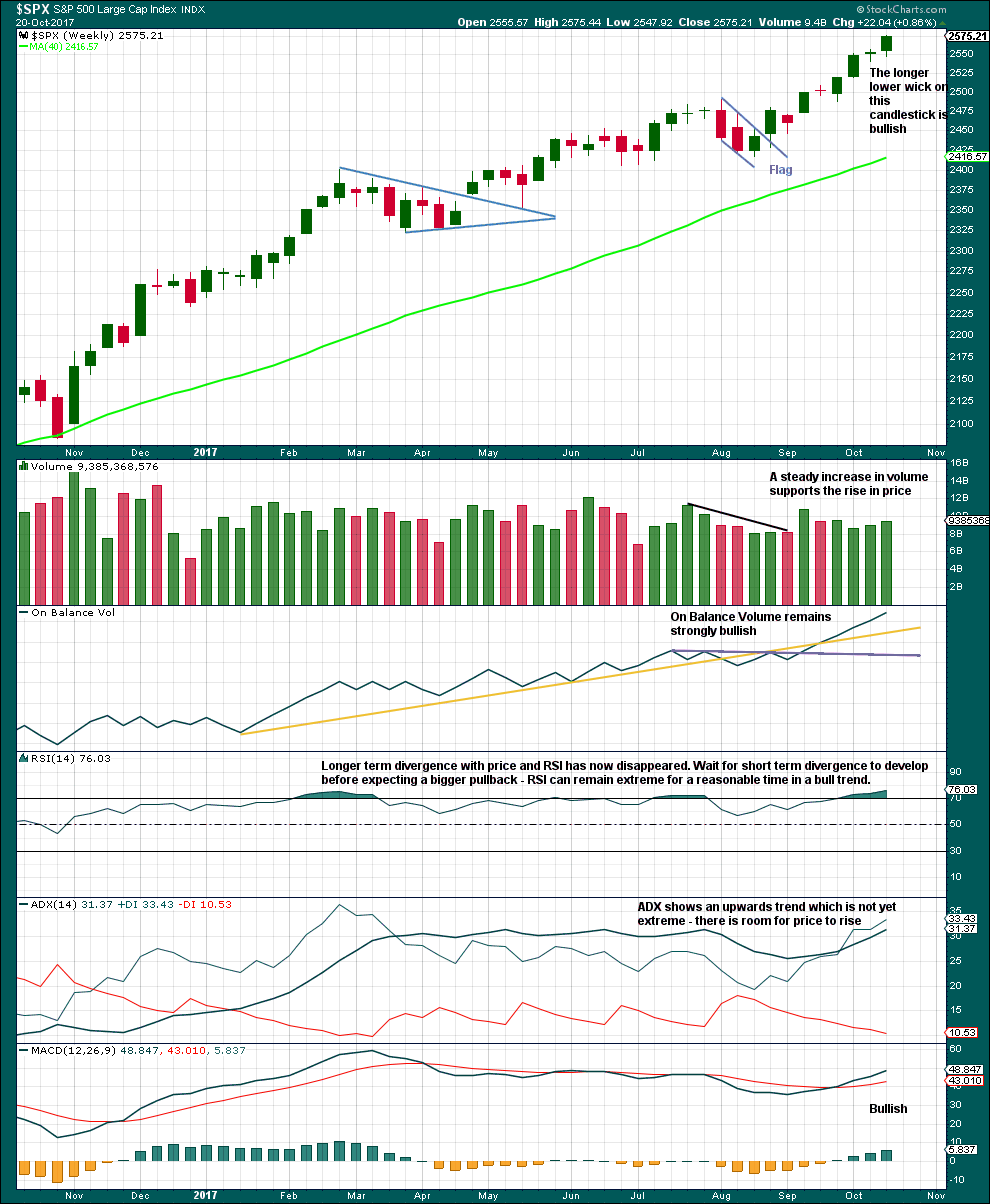
Click chart to enlarge. Chart courtesy of StockCharts.com.
At the weekly chart level, the technicals last week look even more bullish than the week prior.
Longer term divergence with price and RSI does not appear to be very reliable; it has again disappeared. Like divergence with VIX and the AD line, divergence with price and RSI appears to be more reliable for the short term when it is clear and strong.
This chart is fully bullish. There is nothing bearish yet here.
DAILY CHART
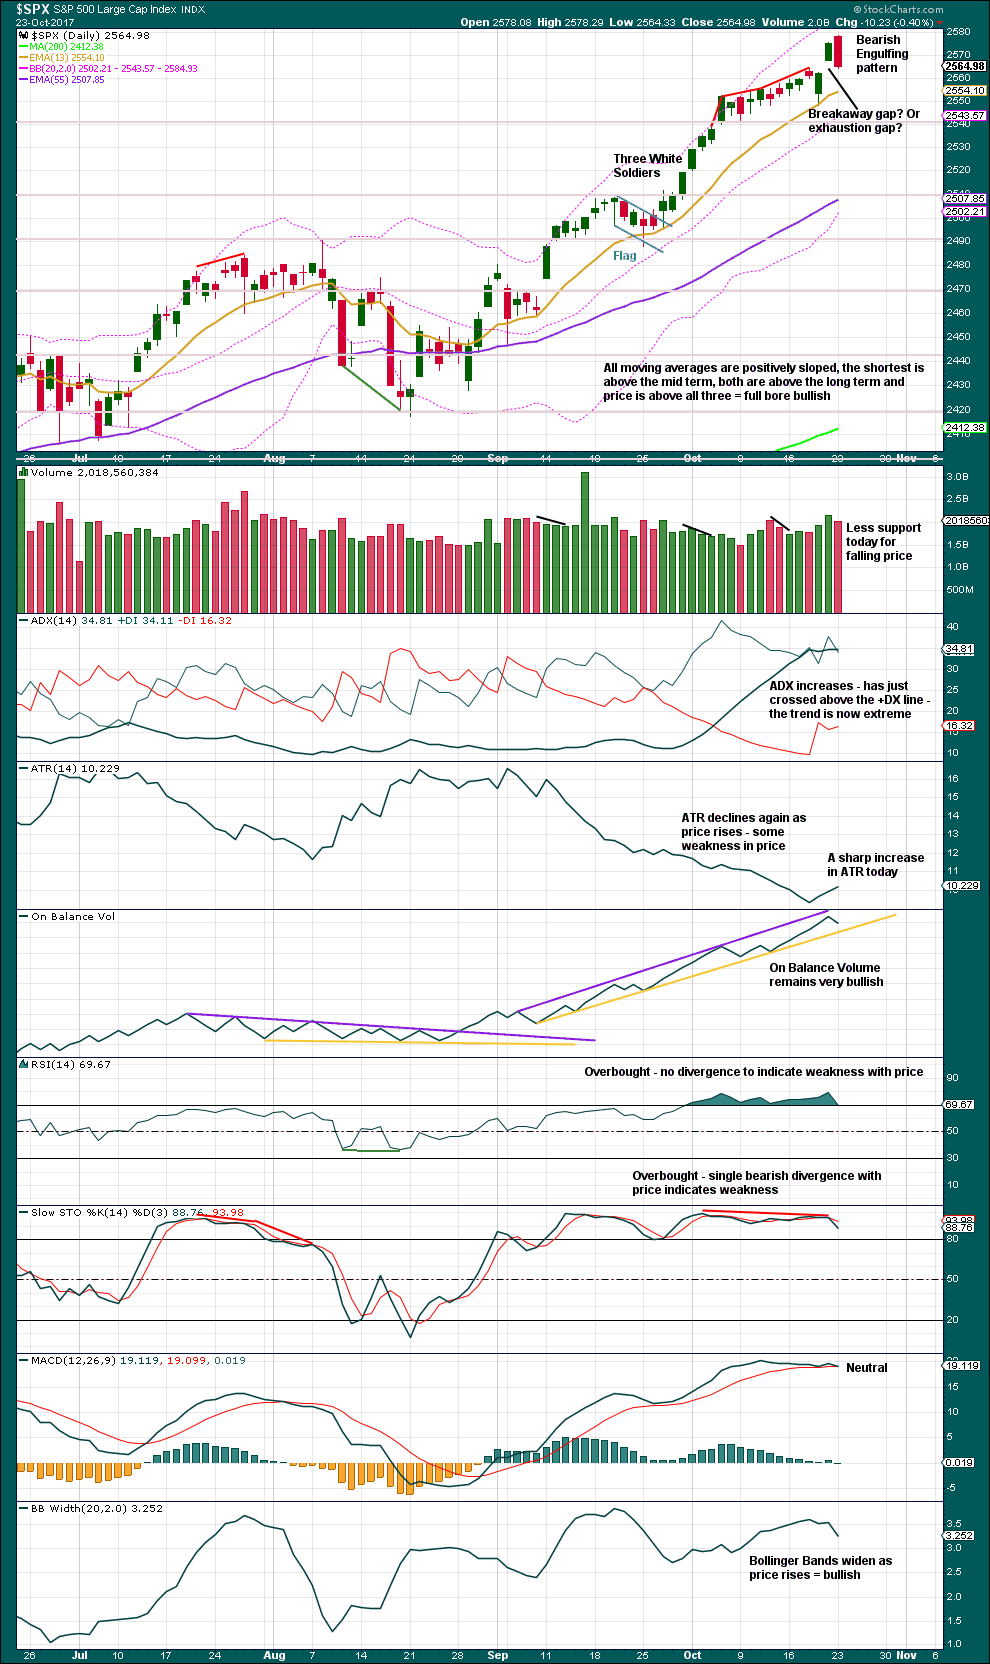
Click chart to enlarge. Chart courtesy of StockCharts.com.
If the last gap is closed with a new low below 2,562.36, then it would be an exhaustion gap. That point is very close to today’s low.
The Bearish Engulfing candlestick pattern is given a lot of weight in this analysis today.
VOLATILITY – INVERTED VIX CHART
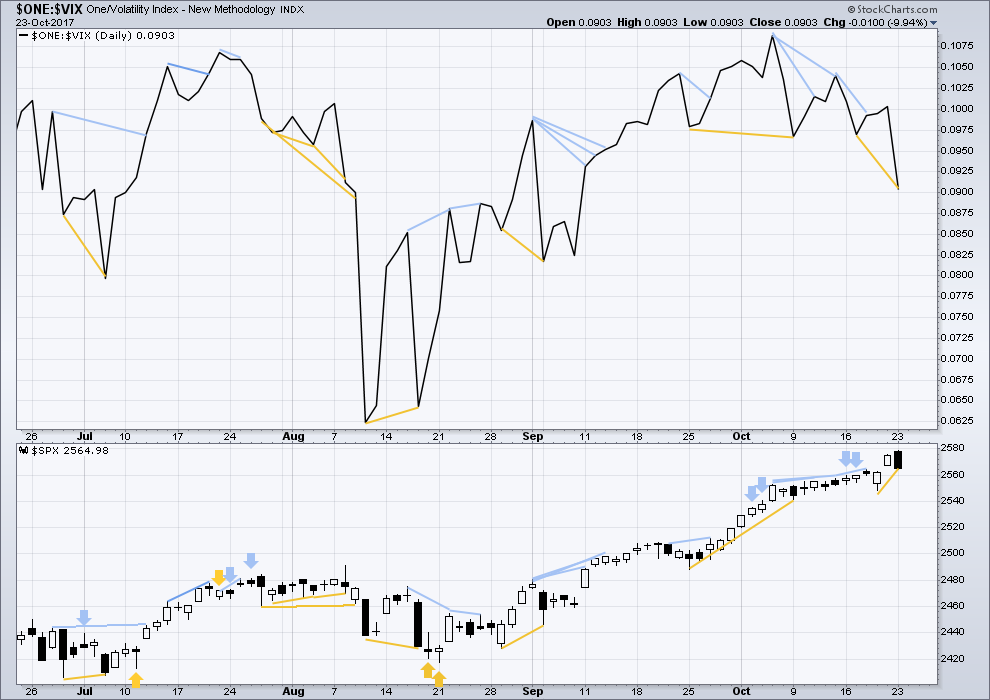
Click chart to enlarge. Chart courtesy of StockCharts.com.
Normally, volatility should decline as price moves higher and increase as price moves lower. This means that normally inverted VIX should move in the same direction as price.
There is new short term bullish divergence between price and inverted VIX today.
BREADTH – AD LINE
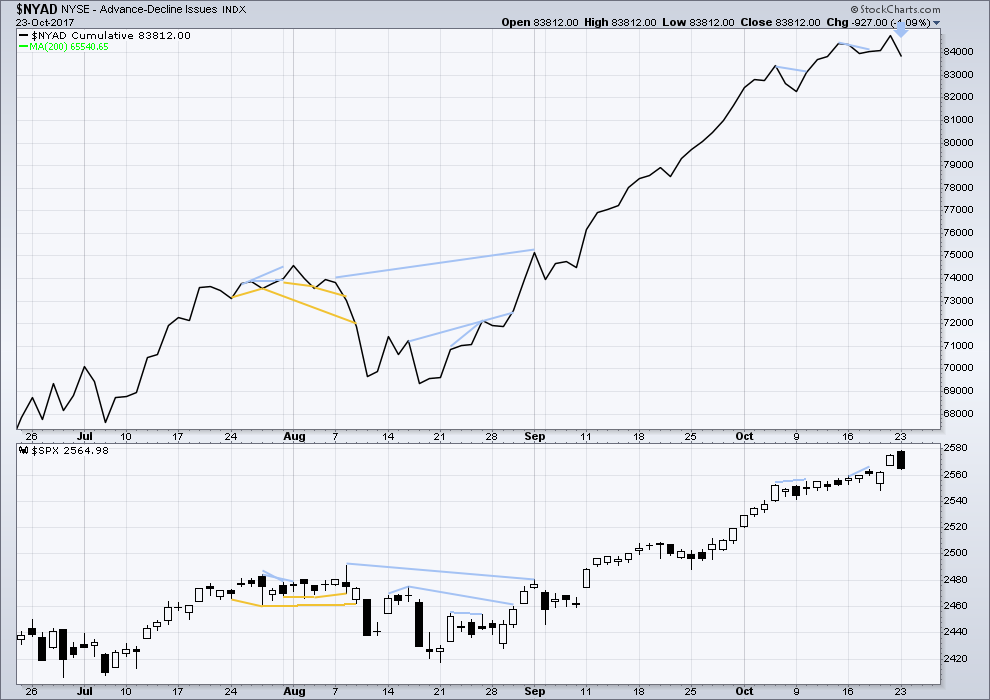
Click chart to enlarge. Chart courtesy of StockCharts.com.
With the last all time high for price, the AD line also made a new all time high. Up to the last high for price there was support from rising market breadth.
There is normally 4-6 months divergence between price and market breadth prior to a full fledged bear market. This has been so for all major bear markets within the last 90 odd years. With no divergence yet at this point, any decline in price should be expected to be a pullback within an ongoing bull market and not necessarily the start of a bear market.
If the AD line is a leading indicator, then the slight new small swing low today may be followed by price. This divergence is interpreted as bearish.
There is still no mid to long term bearish divergence at highs. A trend change here looks more likely to be a pullback or consolidation within the upwards trend, than a possible end to the upwards trend.
DOW THEORY
At the end of last week, only the Dow Jones Transportation Average has not made new all time highs. The continuation of the bull market has not this week been confirmed. However, the Dow Jones Transportation Average is not far off its last all time high. If it does make a new all time high, then this analysis will be totally and fully bullish.
Failure to confirm an ongoing bull market should absolutely not be read as the end of a bull market. For that, Dow Theory would have to confirm new lows.
The following lows need to be exceeded for Dow Theory to confirm the end of the bull market and a change to a bear market:
DJIA: 17,883.56.
DJT: 7,029.41.
S&P500: 2,083.79.
Nasdaq: 5,034.41.
Charts showing each prior major swing low used for Dow Theory are here.
Published @ 09:46 p.m. EST.

The Truth is all about to be revealed!
Deep Corruption and Treason… Lock them all Up!
Truth always rises to the surface! It doesn’t pay to Lie!
A second wave bounce? If volume is light that would support this view.
Kia ora! 🙂
Don’t laugh at me people but yesterday I was looking like a genius for dumping my longs on Friday and not being at all hedged for the first in quite some time and what does DJI do? Goes up two hundred points! Yeah.
I picked up a few calls expiring this week just so remind myself of my own rule:
Be sure to hedge! Believe it or not, there are some bullish charts out there!
I don’t think we are going to get our bearish engulfing candle today. That makes it almost a certainty that we get a “gap and crap” tomorrow. Unless of course futures has other ideas! 🙂
The DJIA daily bar looks a lot like 8/9. And 9/1. I.e., a topping candle, of some name or other. Tomorrow will tell.
I don’t know Verne, VIX looks green to me……..Back when I traded on the floor, we called that upside capitulation 🙂
I just noticed! Sneaky lil’ bugger! 😉
What would we do without a little levity to relieve the burden of the utter disdain most of us feel for the political class?
Somebody pulled off the wig of Maxine Waters and they got it on tape!!!!!!
ROFL!!!!!!!!!!!
A strong bull run like the last two months isn’t likely to stop on a dime and instantly turn down hard. Momentum needs to slow first. The bearish engulfing day signals the start of the momentum slowdown. A great model of what I am expecting is the 7/28-8/8 period of this year on the daily chart. Sideways/choppy topping action, likely a final head fake up, then some strong momentum down.
It sure sounds reasonable. The caveat I see is that we have never been quite in this position before with regard to stretched markets. We really have no assurance that price action is going to behave the way it has in the past. It might, then again…..
Well folks, it looks like the next shoe to drop is the filling of today’s gap up open. We are a LONG way from most moving averages….
Bought some DOG…super high leverage trade, low probability of a profitable exit but reward/risk in absolute $ is fantastic, and I think the EV should be quite positive. Out on any touch of a new ATH in DJIA. Should be clear one way or other in about 90 minutes…
Smart trade. You can buy those shares and forget about them for awhile. The new 52 week low today is exquisite timing. On principle I earlier picked up a single 7 strike call option expiring next May and got absolutely robbed!
I had to cough up 8.50 for the contract on a 6.90/10.90 bid/ask spread. That is the kind of trade you stick in your long term account and fogettaboudit!!! 🙂
Why just one contract you may ask?
It is my theory that a lot of these short ETFs are not going to pay out. Seems to me the smaller each position the better the chances are of getting your trade filled…spread the joy…. he! he!
I will buy some SQQQ when the little swing low earlier today in NDX is broken to the downside. If…or probably just when!
and I jumped on some VXX just before/as SPX started breaking below 2569.50. Yabba dabba doo. Now we just need a “real 4” to unfold. I’m concerned we might just see a triangle and the low is already established.
Actually a triangle would be something that would really pique my interest.
My great interest now is in the unwind of the short vol trade. I am assuming that we are several weeks at the very least away from it and we are not going to see any real fear until and unless VIX crosses 15 to the upside. The huge question is whether the short trade can withstand the current correction/consolidation without starting to be unwound. I suspect the first stirrings of unease should have already begun due to the absence of a new 52 week low. It will be quite interesting to see how things unfold going forward.
TICK!
Vix bands expanding!!!
They are indeed! 🙂
So far my amateur assessment of wave action in RUT is holding up. May not last. But I’m not taking a short as long as it does, that’s for sure! FWIW (with some indicators this time, but no volume, I don’t seem to get any volume data for RUT)…
Nothing at all wrong with being cautious. This market has pulled so many fast ones nothing it does surprises me any more. The weight of evidence that it is running our of rabbits is nonetheless starting to accumulate….
Now I’m viewing RUT pretty much in the inverse; gotta be flexible and willing to reconsider in this line of work! The long sideways consolidation at the top isn’t proportional at all to the structures preceeding, so call the ATH a completed 5 (instead of a 3), and now there’s a leading diagonal 1 down, a sharp pullback 2, and the initiation of 3 down. Looks rational to me. I will buy RWM on a break below today’s lows, particularly with confirming price action from other averages.
Aich, I didn’t wait, I jumped on RWM earlier to lower risk and increase profits. I’ve got enough triggers and supporting evidence, and the potential 5 wave down in RUT now is attractive.
Verne,
Quick question for you… do you simply trade the options, or do you ever deliver or take delivery of the underlying? And do you ever let them expire without any action?
VIX options will cash out if they are in the money at expiration or simply expire wortheless. The ETFs, including the inverse ones will deliver actual shares for in the money calls, or sell them short for in the money puts at expiration.
The ETNs like XIV don’t have options and you have to trade the shares directly.
I generally will cash out in the money options when they reach my price target or my stop price.
Thank you, Verne! That explains why you frequently mention SVXY/UVXY, but not XIV/VXX. Got it — and the other answers too. I appreciate it all!
Most welcome!
On rare occasions market makers will try and take advantage with ridiculous bids on in the money options that do not represent their intrinsic value and so I will opt to exercise or take assignment. It only takes once or twice for them to get the message and offer a fair bid prior to expiration!
I can make one prediction with a fair amount of confidence having traded vol for some time. Not saying I know all there is to know as I am clearly still on a steep learning curve here. At any rate, as one famous character said, “Hear me now and believe me layda!”
If VIX heads North and prints a fat green candle today….”Farewell and Adieu…!”
For me personally this is a remarkable learning experience. Is it possible that we are witnessing how the end of a liquidity feedback loop applied to financial engineering unfolds? I have been wondering about the failure of VIX to make a new 52 week low in the face of the relentless string of new highs recently and thinking that could be very significant. The indices have all peeled away one by one in posting key reversal days and now DJI remains the lone warrior bolting onto new highs as all the other indices post lower highs. Will they all eventually join DJI, or are we looking at the way this grand experiment ends? Fractured markets are by definition weak markets. I can’t wait to see how this turns out! Yikes!
Volume continues to wave a red flag,,,,as it has for so long!
Yes, but all markets at ATH’s at the same time isn’t exactly the norm either. Back and forth, even in a strong bull market overall, has to be expected. I will agree the market feels like it’s at a critical decision point here. I am working hard to NOT HAVE AN OPINION. I want to objectively be aware of the market speaking as it happens, right now, and over the following minutes and hours, to get/stay in line with it quickly and with lowest possible risk (while with reasonable odds for a winning trade). I suck when I have a bias; I watch moves start the other way, and discount them, or worse, hold my “wrong way” position because the market “should” go “my way”. For me, a losing mind set. I also second guess my calls when I’m biased. So I work to be neutral, until the market informs me and triggers entries. My backdrop/roadmap is the main and alternative EW counts we have (I’m holding onto yesterday’s main myself as an alternate #2 here, though!).
This is truly epic. If there ever was anything that would qualify as a blow off top, in my humble opinion what is now happening with the DOW qualifies. It is even more dramatic considering the signals we ALREADY have from the other indices. Has anyone ever seen anything like this??!!
quite gorgeous isn’t it 🙂
You called it my man! 🙂
It is kind of going exponential, isn’t it? However, if you look at the 2009 low to the 2015 high, you see a significantly larger run up. And if you use that overall move as a symmetric measuring tool on the next (current) run up, starting at the Aug 15 low, the projection is up to DJIA at 30250. So it can be argued that things are just getting seriously underway to the up side. Not that I per se “believe” the market will complete such a symmetric move but it’s always interesting. Meanwhile, our immediate minor 4 down isn’t getting any headway yet. As Lara points out often, SPX tends to roll over slowly.
Or it could be done with a possible truncation underway….??!!!
(different degree of course)
TICK… TICK… TICK… . . . . . TICK
Anybody take a good look at the Fab Five lately?
Hard to believe the Qs are at all time highs…something rotting in Denmark…
I don’t think it’s going to last. This move in NDX looks as toppy as all get out to me. There’s a nice double top in QQQ already and price looks likely to move up a bit and roll over again, with more momentum.
It is incredible considering how far Amzn and a few others have fallen already. I have a target of around 600 for Bezos and company…
That all said…as of sometime this morning, I’m long AMZN, NFLX, and GOOG. Going with the flow in the short term. UPRO paid off from my late day buy yesterday (betting the invalidation point wouldn’t be taken out, whew!) with a sale close to the high this morning. URI paid me off on the long side, so did INCY and QCOM. I’ve also taken a fresh long on MLM, which I believe is in process of starting a wave 5 up. It’s a good traders market, IMO. Despite prognostications of immanent doom, which I don’t doubt but meanwhile…
I guess it all depends on your time horizon eh! I am holding June 2018 puts on many of those guys entered when they broke from their bearish rising wedges weeks ago. I think I am going to stay put, so to speak..he! he! 🙂
BTW, If I see a pop during earnings I will be adding to those already nicely green trades!
For sure Kevin, bought the low on AMGN, also bought MLM and MOS in September. I believe it is always a traders market regarding individual names. I’m starting to consider staples like KMB, and KHC as they look cheap relative to the market and folks historically allocate to staples, and telecom during periods of turbulence. I also like Coffee here.
You may like AAOI, I do believe it’s forming a new base. Already in/out once at BE trying to catch the start of a fresh move up. Coffee (JO) does look rather interesting re: a possible deep low buy right now, thanks.
Wow that’s a fun chart, thanks!
Just because…buying Nov 17 expiration DIA 235 strike puts for 2.60…
I doubt my contingent order on VIX will ever see the light of day…
I’ll bite on these new bearish counts…once the gap is filled to the downside.
The “breakaway” gap from the other day is the one I need to see filled to move to the new bearish counts. Meanwhile, the bullish main from a day ago still is not technically invalidated. And the market is doing it’s current normal thing: going up, when everyone expects it to start a pullback! I’ve seen this before over the last few months, so often I’m coming to expect it as the “most likely scenario”, and I’m waiting for crystal clear triggers to tell me the bears have control before I get excited about the short side, which aren’t there yet. Let’s see what happens today…
Nobody expects a pull back… NOT sure what data your looking at?
All indicators at bullish extremes for a long time now.
Well, you might want to actually read Lara’s report. She’s calling for a minor 4 correction right here, right now. And not even an alternate that calls for more upward action (short term). She’s pretty confident. It hasn’t really initiated yet, though…
As for others, we have multiple folks who are already quite short, per their statements here. They expect a pullback as well, I’m guessing.
You said “nobody expects a pull back”. When someone makes that statement you look to market wide indicators… All marketwide indicators at bullish extremes for a long time now.
I don’t care about the next few days.
To a GAP Up Open and then a slam down at some point today!
Desperation on display. I guess DJI felt left out by its cousins in that it did not print a bearish engulfing candle! lol!
Talk about a sweet set-up…Let’s get VIX back below 10 guys…I know you can do it! 🙂
Starting already in NDX!
9:40 NDX now negative
Looks like they got the momentum players all excited as they are stepping over each other to buy the market. Interesting times indeed.
momentum players… Watch all the morons all go over the cliff together without thinking for one second about what they are doing.
The only thought process… hey they are going over that cliff… I am going too!
What morons! NOT one independent thought among them!
Probably the mindless algos; wait till they start shorting instead…
Good morning!
I am looking at the DJI futures, and what I am seeing is nothing short of full blown central bankster panic folk, pure and simple.
I will post something later today that I think will explain why….amazing!
Has anyone been following the debt situation in Venzuela? It looks like they are about to join Puerto Rico in default. I was curious about the failure to spot so much as even a hiccup in the markets and have been doing some digging to try and figure out what is going on with PR bonds. The good news is that they are still trading. The bad news is that they are 30 cents on the dollar. I bet you ate wondering why that kind of loss is not currently being disclosed on any ones balance sheet. You are not going to believe this. That debt has been quietly moving from hedge funds and banks to pension funds and money market accounts! But wait! You shout. You mean money market funds that are not under any circumstances pemitted to break the buck?!
Yep, you heard me.
You mean pension funds on which millions of ageing workers are depending to provide for them in retirement?!
Yep!
But how can tbey do that? It’s absolutely criminal, you scream.
Well, the rules were quietly changed to ‘broaden” the range of assets in which these funds could invest, in other words, a rich source of liquidity to paper over the ticking time bombs. Here is the best part. Are you ready?….please don’t tell anybody I told you….
They don’t have to mark to market! Shhhhhh….
So you see, money market funds don’t have to “break the buck” (go below $1 per share), and pension funds can keep reporting stellar rates of return, never you mind the principal. What do think is going to happen when millions of retirees figure out just how badly they have been screwed? And this is the stuff we know about people…
Surf’s up!
Wooo hoooooo! Tonga here I come!
.
I always knew our leader was a mammal…but I didn’t know what kind!! Serious tail…