A pullback was expected and support is holding. Price remains above the invalidation point.
Summary: Assume the trend remains the same, upwards, until proven otherwise. This looks like an upwards breakout now followed by a pullback. Stops for long positions may be set just below the last gap at 2,433.15, or for more risk tolerant members just below the invalidation point at 2,422.88. The target zone calculated at two wave degrees is 2,500 to 2,501.
Always use a stop. Invest only 1-5% of equity on any one trade.
Only one alternate Elliott wave count will be published today, for clarity.
New updates to this analysis are in bold.
Last monthly and weekly charts are here. Last historic analysis video is here.
MAIN ELLIOTT WAVE COUNT
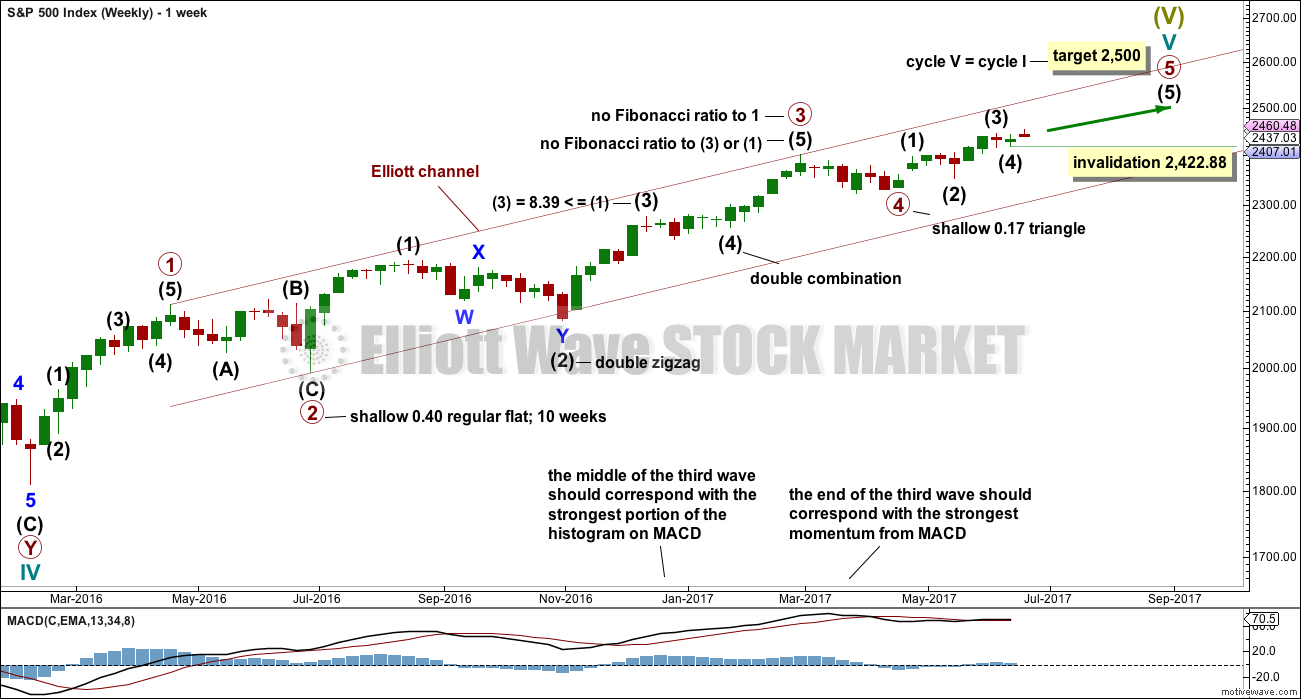
WEEKLY CHART
This wave count has a better fit with MACD and so may have a higher probability. However, at this stage it expects the bull market to come to an end quickly. With market breadth not yet exhibiting any divergence with price this looks unlikely. The alternate should be taken very seriously.
Primary wave 3 may be complete, falling short of 1.618 the length of primary wave 1 and not exhibiting a Fibonacci ratio to primary wave 1. There is a good Fibonacci ratio within primary wave 3.
The target for cycle wave V will remain the same, which has a reasonable probability. At 2,530 primary wave 5 would reach 0.618 the length of primary wave 1. If the target at 2,500 is exceeded, it may not be by much.
There is alternation between the regular flat correction of primary wave 2 and the triangle of primary wave 4.
Within primary wave 3, there is alternation between the double zigzag of intermediate wave (2) and the triangle of intermediate wave (4).
Within the final wave of intermediate wave (5), no second wave correction may move beyond its start below 2,422.88.
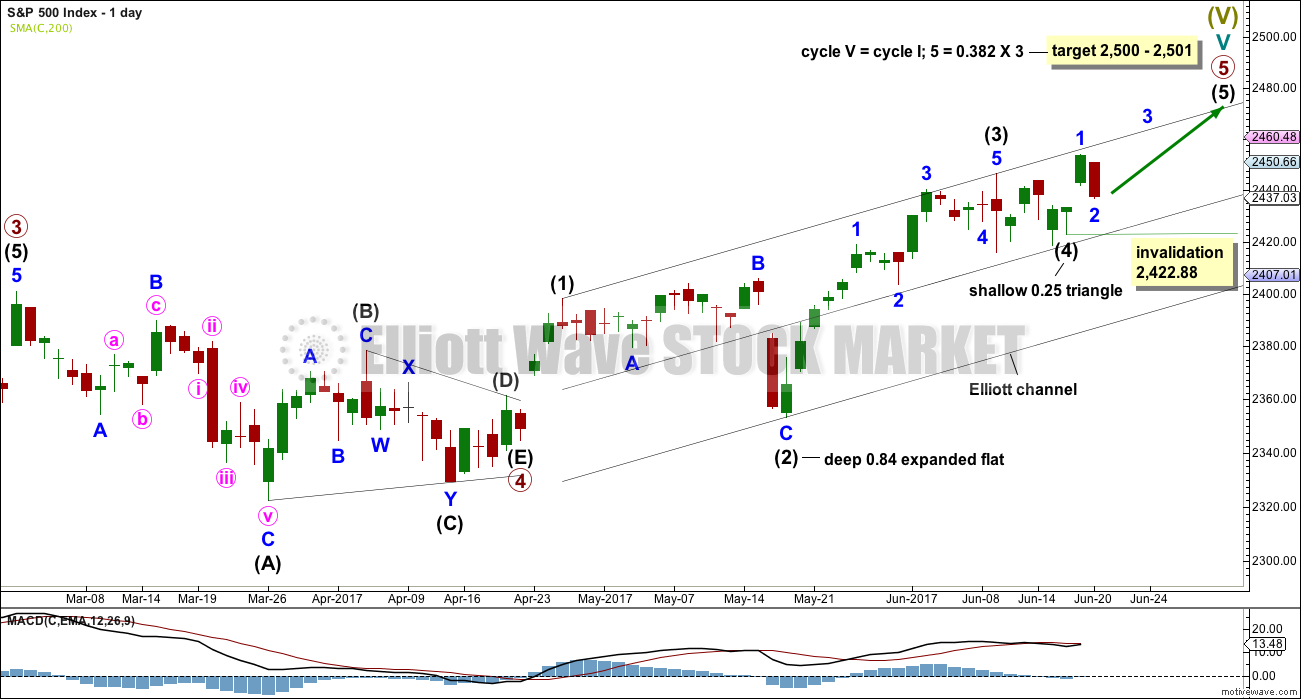
DAILY CHART
Primary wave 5 must complete as a five wave motive structure, either an impulse (more common) or an ending diagonal (less common). So far, if this wave count is correct, it looks like an impulse.
Intermediate wave (3) is a complete impulse. Intermediate wave (4) may now be a complete triangle. The alternate published in yesterday’s analysis, which looked at the possibility of intermediate wave (4) continuing further as an expanded flat, will no longer be considered as it has too low a probability. It would be very unusual for both intermediate waves (2) and (4) to be expanded flat corrections.
Intermediate wave (5) must be a five wave motive structure.
Within intermediate wave (5), minor wave 1 is now complete. If the opening gap to yesterday’s session continues to provide support, then minor wave 2 should be over at today’s low or very soon indeed. Minor wave 2 may not move beyond the start of minor wave 1 below 2,422.88.
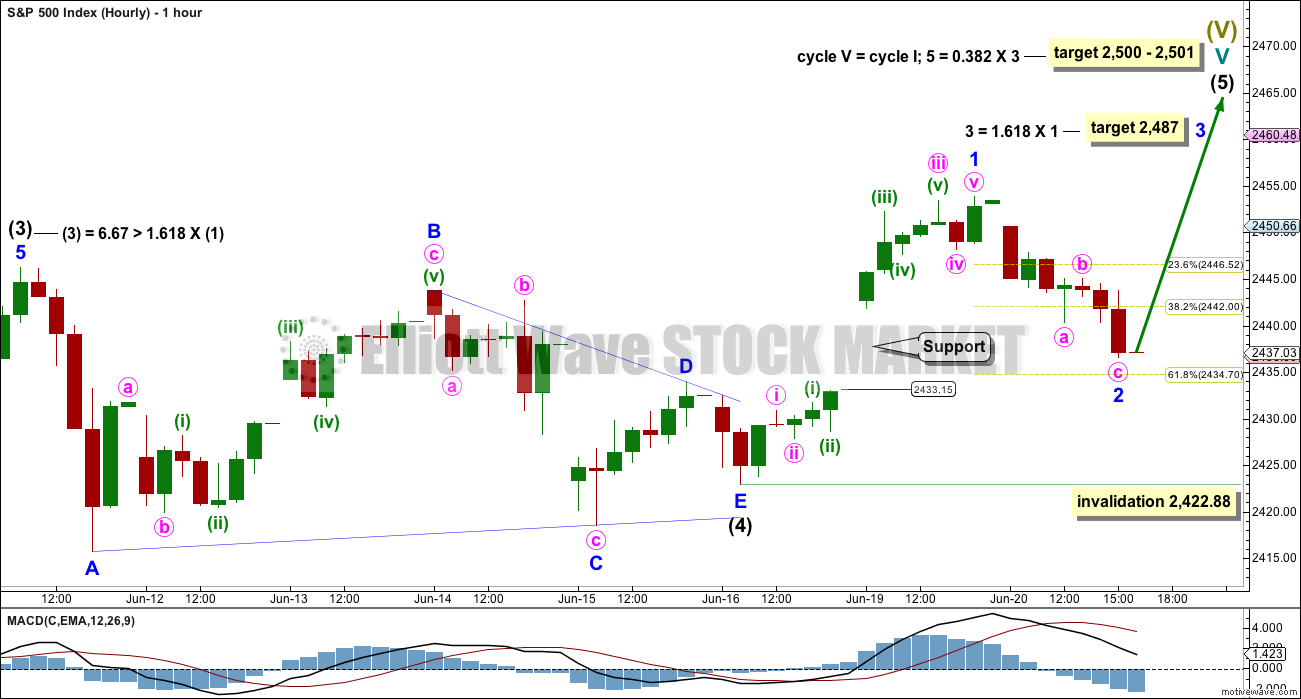
HOURLY CHART
Intermediate wave (4) fits as a regular contracting triangle, which may have come to a more swift end than expected.
Intermediate wave (5) may have begun on Friday.
The opening gap for Monday is a breakaway gap. If this is correct, then the lower edge should provide support. Stops for long positions may be set just below this gap at 2,433.15.
Minor wave 2 has moved lower during Tuesday’s session to end close to the 0.618 Fibonacci ratio of minor wave 1. If support at the gap holds, then minor wave 2 should be over here. A target for minor wave 3 expects the most common Fibonacci ratio to minor wave 1, and fits with the higher and final target.
Minor wave 2 may not move beyond the start of minor wave 1 below 2,422.88. However, before invalidation, if the gap is closed with a new low below 2,433.15 that would reduce the probability of this main wave count. At that stage, the upwards breakout may be false and the gap would be a pattern gap and not a breakaway gap. The probability of the alternate would increase.
ALTERNATE ELLIOTT WAVE COUNT
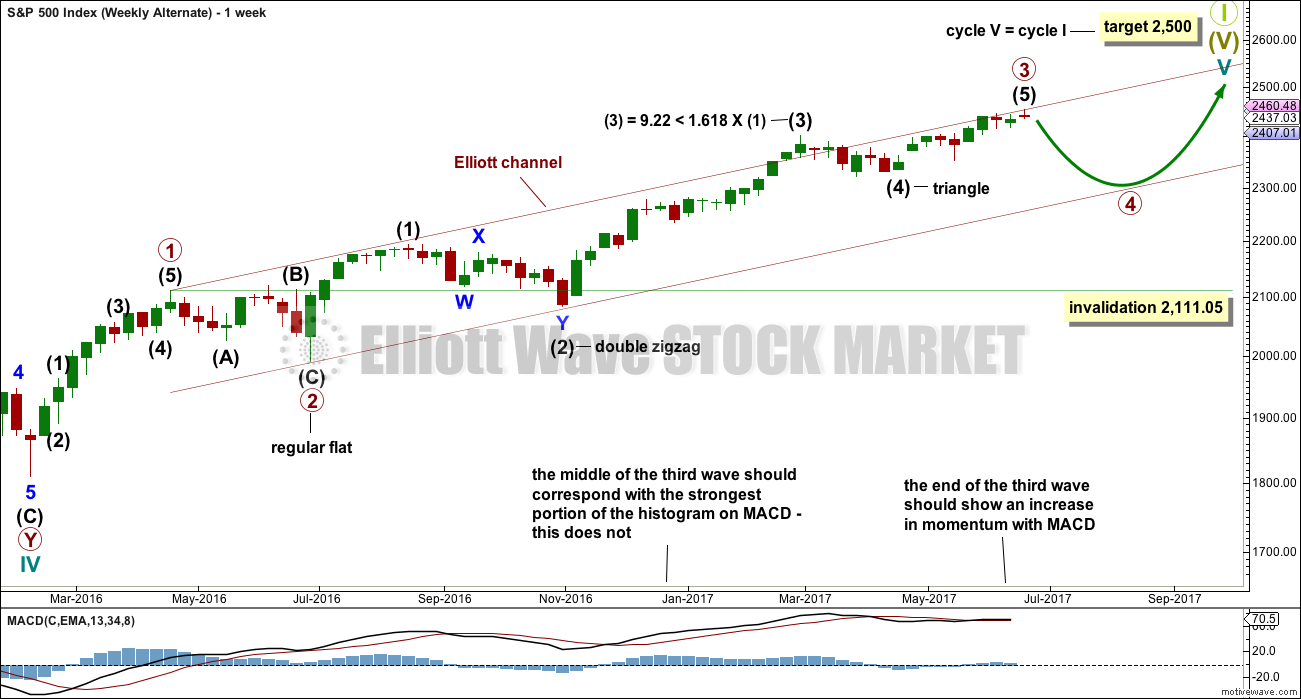
WEEKLY CHART
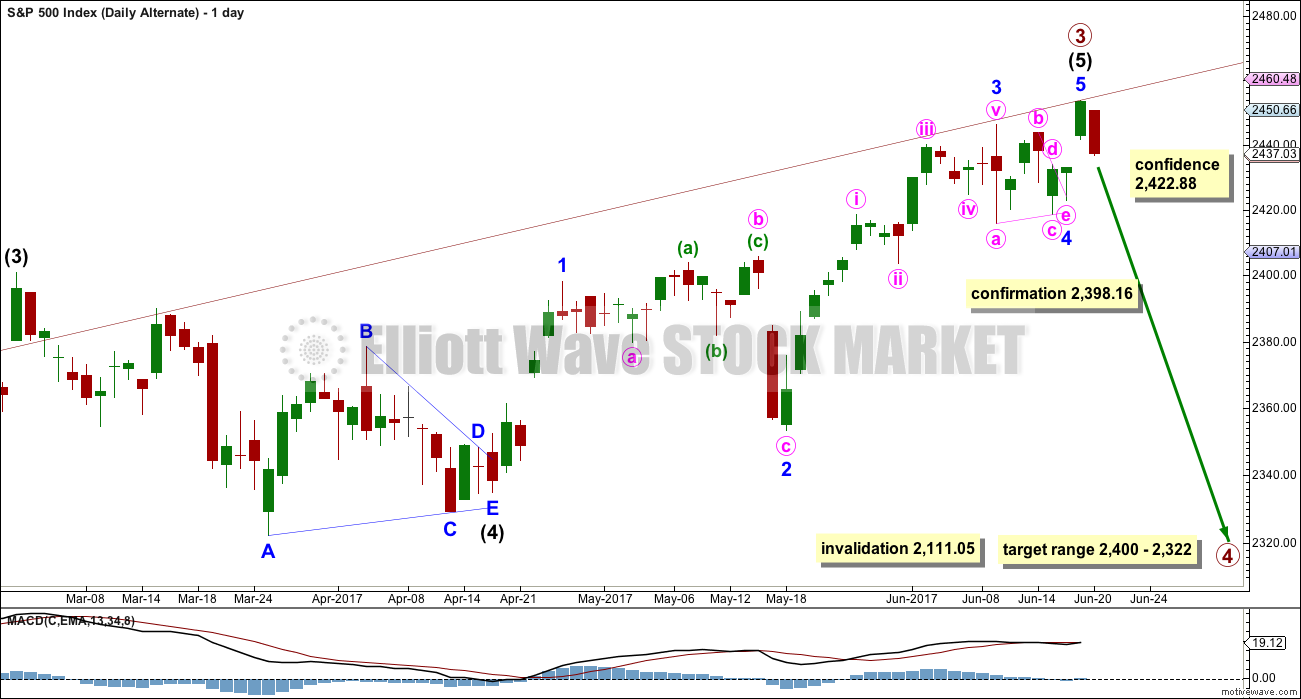
It is possible that primary wave 3 is either over now or may be very soon indeed. It is possible that a deep multi week or multi month pullback may begin for primary wave 4.
This wave count would allow for primary wave 4 to unfold with a corresponding decline in market breadth. Primary wave 5 may then continue higher towards the target, allowing for at least 4 months of divergence between market breadth and price to develop before an end to the ageing bull market. This would have a neat fit with prior major trend changes from bull to bear of every single bear market in the last 90 odd years.
Primary wave 2 was a regular flat correction lasting 10 weeks. Primary wave 4 may exhibit alternation as a single or multiple zigzag, or as a triangle. It should last at least 10 weeks and possibly longer.
Primary wave 4 may not move into primary wave 1 price territory below 2,111.05.
DAILY CHART
Minor wave 5 of intermediate wave (5) of primary wave 3 may be over here, or it may continue higher.
Always assume the trend remains the same until proven otherwise; assume the trend is upwards until price makes a new low below 2,422.88.
If price moves below 2,422.88, then this would be the main wave count.
Primary wave 4 may end within the price territory of the fourth wave of one lesser degree. The price range for intermediate wave (4) gives a target range for primary wave 4.
TECHNICAL ANALYSIS
WEEKLY CHART
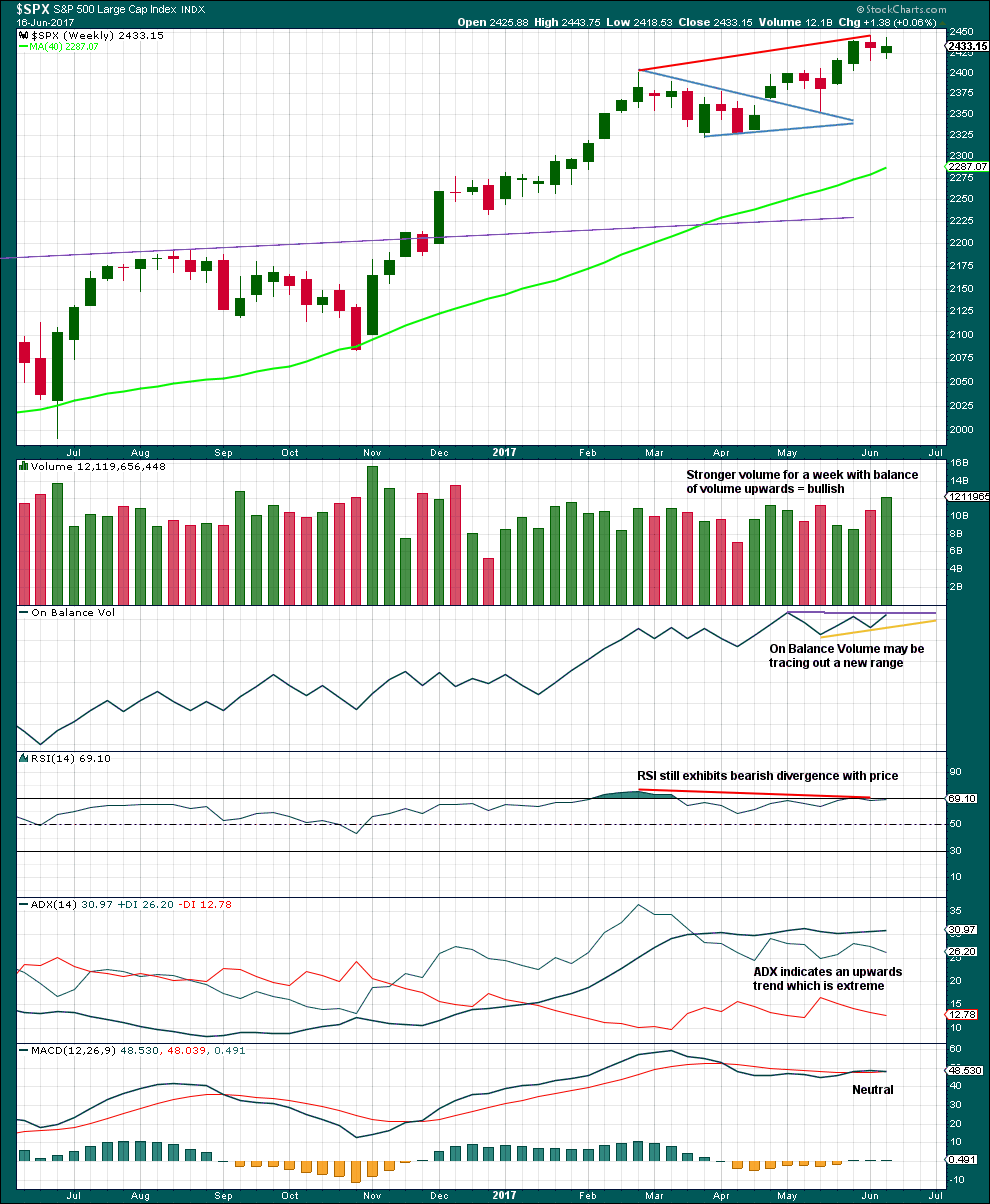
Click chart to enlarge. Chart courtesy of StockCharts.com.
An inside week completes a small spinning top candlestick pattern. This puts the trend from up to neutral; price is consolidating. A spinning top is a pause within a trend.
An increase in volume suggests that the breakout after consolidation is likely to be upwards.
On Balance Volume trend lines are adjusted.
DAILY CHART
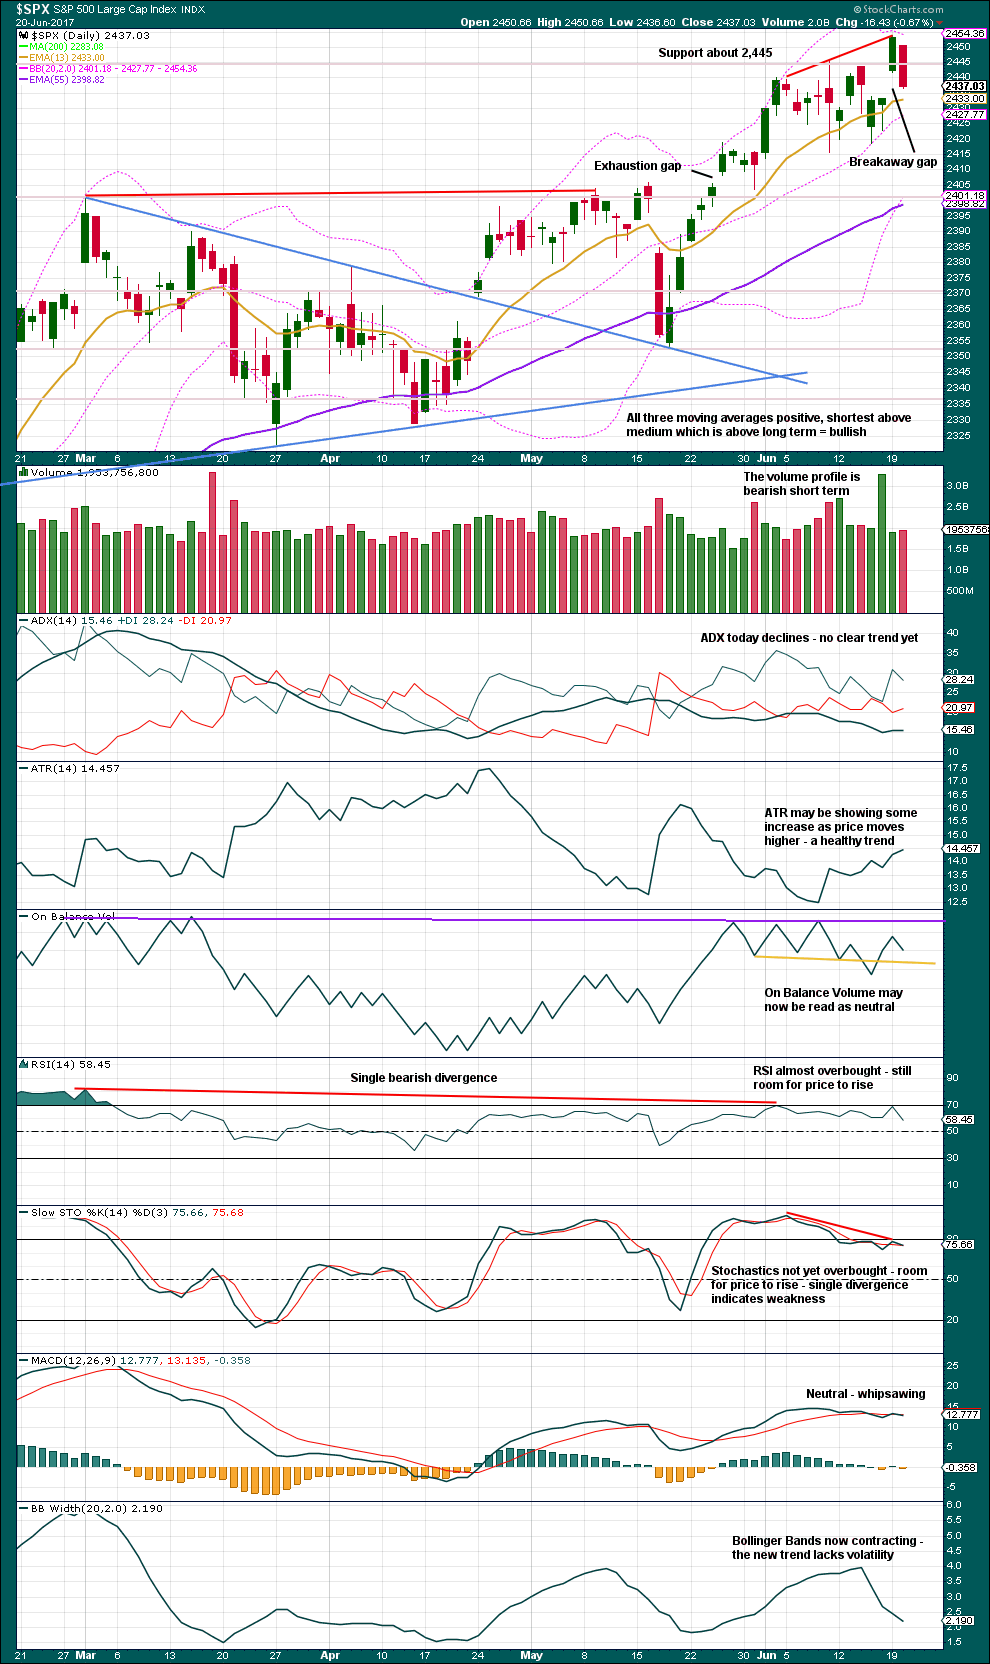
Click chart to enlarge. Chart courtesy of StockCharts.com.
The upwards breakout lacks support from volume, so it is suspicious. Now a downwards day follows with slightly stronger volume. The short term volume profile today now does offer some cause for concern because it is bearish.
Still, the strongest volume for recent days was the upwards day of the 16th of June. This is bullish.
There is enough contradictory evidence in the volume profile to go with price: expect price to continue higher until the last gap is closed.
There is now double divergence at highs between price and RSI. There is single divergence between price and On Balance Volume. There is single divergence between price and Stochastics. Upwards movement is weak, but that should be expected towards the end of an ageing bull market. This weakness does not signal that price must move lower here, only that there is weakness and traders should exercise caution.
Price is bullish. ADX indicates an upwards trend. ATR indicates there is some strength within the trend.
VOLATILITY – INVERTED VIX CHART
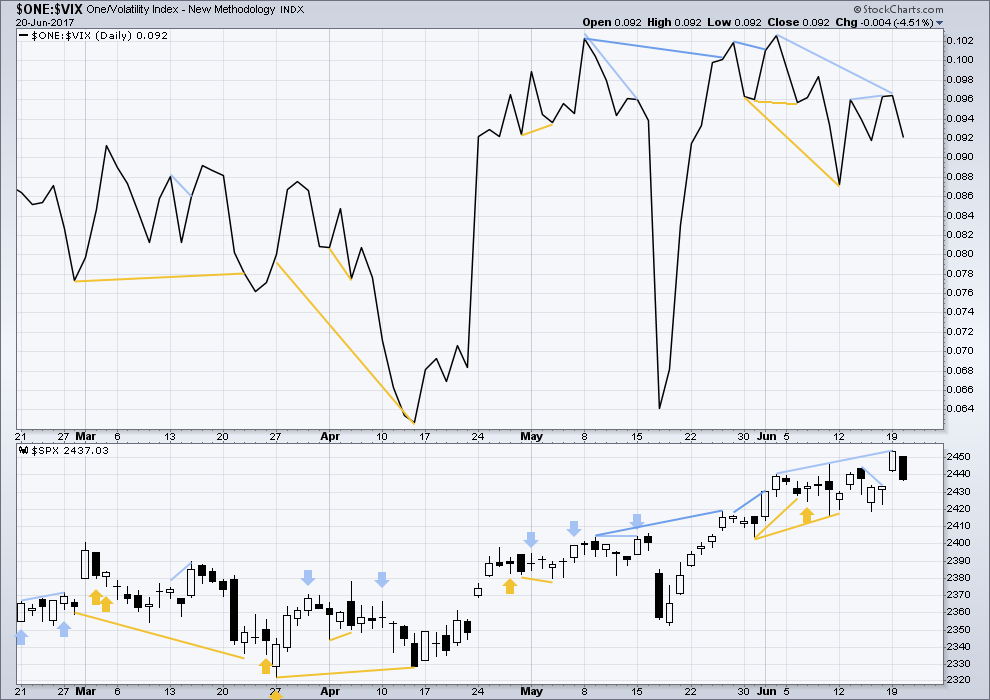
Click chart to enlarge. Chart courtesy of StockCharts.com.
Normally, volatility should decline as price moves higher and increase as price moves lower. This means that normally inverted VIX should move in the same direction as price.
Strong bearish divergence noted yesterday between price and inverted VIX has now been followed by one day of downwards movement. It may be resolved here, or it may yet be followed by more downwards movement.
There is no new divergence today between price and inverted VIX.
BREADTH – AD LINE
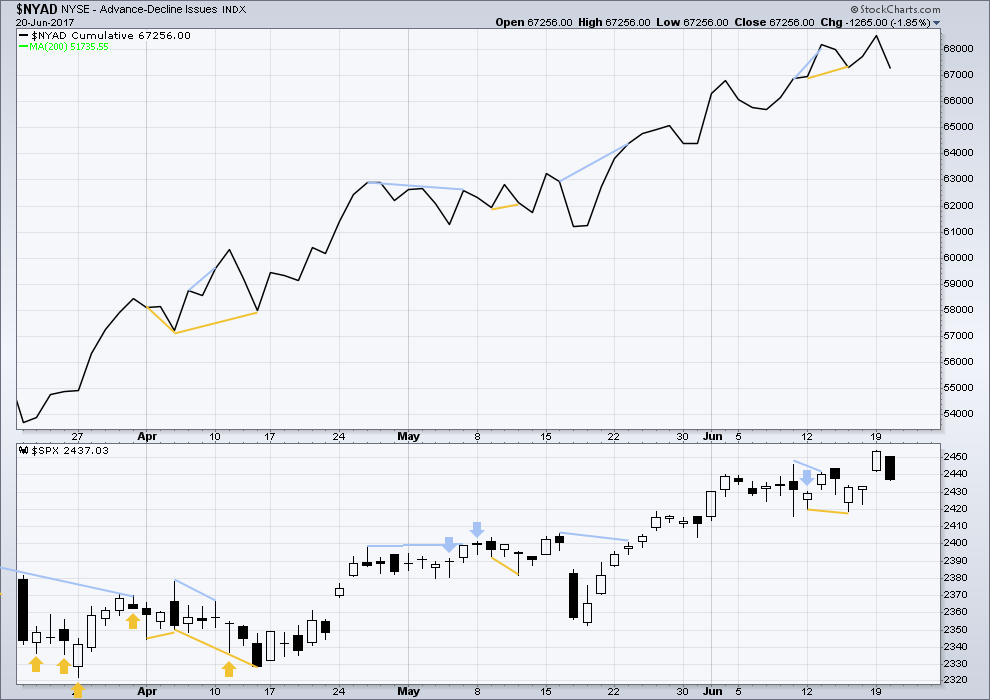
Click chart to enlarge. Chart courtesy of StockCharts.com.
With the last all time high for price, the AD line also made a new all time high. Up to the last high for price there was support from rising market breadth.
There is normally 4-6 months divergence between price and market breadth prior to a full fledged bear market. This has been so for all major bear markets within the last 90 odd years. With no divergence yet at this point, any decline in price should be expected to be a pullback within an ongoing bull market and not necessarily the start of a bear market.
There is no new divergence today between price and the AD line.
The mid caps and small caps have made new all time highs along with recent last all time high for large caps. The rise in price is seen across the range of the market, so it has internal strength.
DOW THEORY
At the end of last week, DJIA, Nasdaq and the S&P500 have all made new all time highs. DJT has failed to confirm an ongoing bull market because it has not yet made new a all time high. However, at this stage that only indicates some potential weakness within the ongoing bull market and absolutely does not mean that DJT may not yet make new all time highs, and it does not mean a bear market is imminent.
The following lows need to be exceeded for Dow Theory to confirm the end of the bull market and a change to a bear market:
DJIA: 17,883.56.
DJT: 7,029.41.
S&P500: 2,083.79.
Nasdaq: 5,034.41.
Charts showing each prior major swing low used for Dow Theory are here.
This analysis is published @ 08:44 p.m. EST.

The gap is closed. The breakout was false. Price is back within the consolidation zone.
I’m now leaning towards the alternate; a deeper longer lasting pullback. But first for any confidence in this view we need a new low below 2,422.88.
Because we should always assume the trend remains the same until price proves it has changed. Price hasn’t proved the upwards trend has changed yet.
I managed to grab a nice intra-day profit in TQQQ. But with $SPX failing to confirm its break-out and Joseph’s comment about 30-year Treasury yield, I decided to bail before the close.
My lovely bride always prefers that I take profits quickly. Sometimes I regret missing those sweet morning gaps up, but it greatly reduces overnight worries about getting clobbered hard first thing in the morning.
Be Careful… 30 Year US Treasury Yield down to 2.727% right now… I think the close.
Gap remains open and that is imo bullish. Cashed in my mid term bearish call spreads on move down today but still holding long calls expiring Friday. The tug of war continues with the 2422.88 pivot hanging tough. The bulls typically win these tussles and I suspect this one will be no different. See ya!
It’s closed now Verne.
Oh my! Indeed it has. I was really expecting a primary degree turn would be dramatic but if that is what we have it is taking its sweet time. The next major Bradley turn date is not until January 2018 and the last prior to yesterday’s tagged the rally from November so the next few weeks could prove interesting.
Futures not suggestive of an impending third wave up, so minor two could head lower. Trannies took a dive yesterday so apparently not quite ready to confirm the recent highs in the other indices. Keeping an eye on VIX. It printed a full green candle yesterday absent the long upper wick that usually presages additional immediate further upward movement for the indices. 2422.88 is key today; so far not taken out by ES so we could still head up to the 2470 – 2500 target.
Carrot anybody?
Sure. Better than a stick 🙂
oooo,,, dat a BIG wabbit
Didn’t want ya to miss me Elmer! He! He!