
An upwards breakout may have come sooner than expected. The final target remains the same.
Summary: Assume the trend remains the same, upwards, until proven otherwise. This looks like an upwards breakout. Any small correction now is an opportunity to join the trend. The target zone calculated at two wave degrees is 2,500 to 2,501.
New updates to this analysis are in bold.
Last monthly and weekly charts are here. Last historic analysis video is here.
MAIN ELLIOTT WAVE COUNT
WEEKLY CHART
Click chart to enlarge.
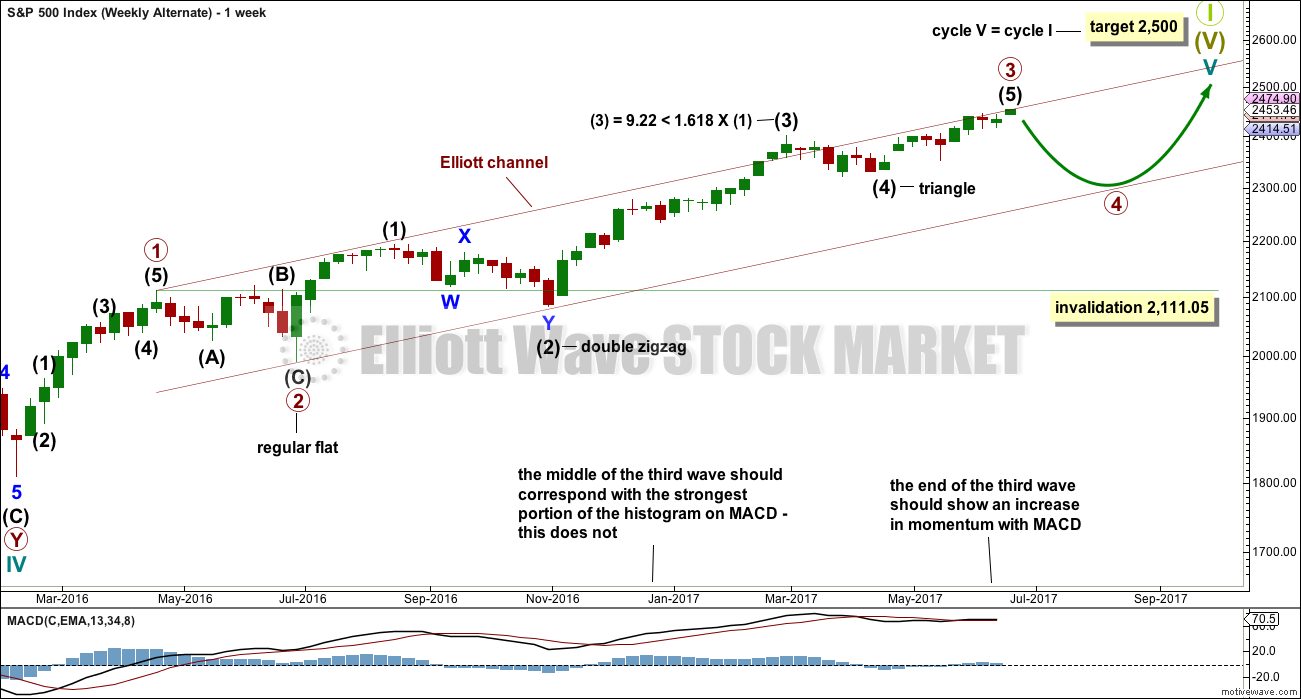
This wave count has a better fit with MACD and so may have a higher probability. However, at this stage it expects the bull market to come to an end quickly. With market breadth not yet exhibiting any divergence with price this looks unlikely. The alternate should be taken very seriously.
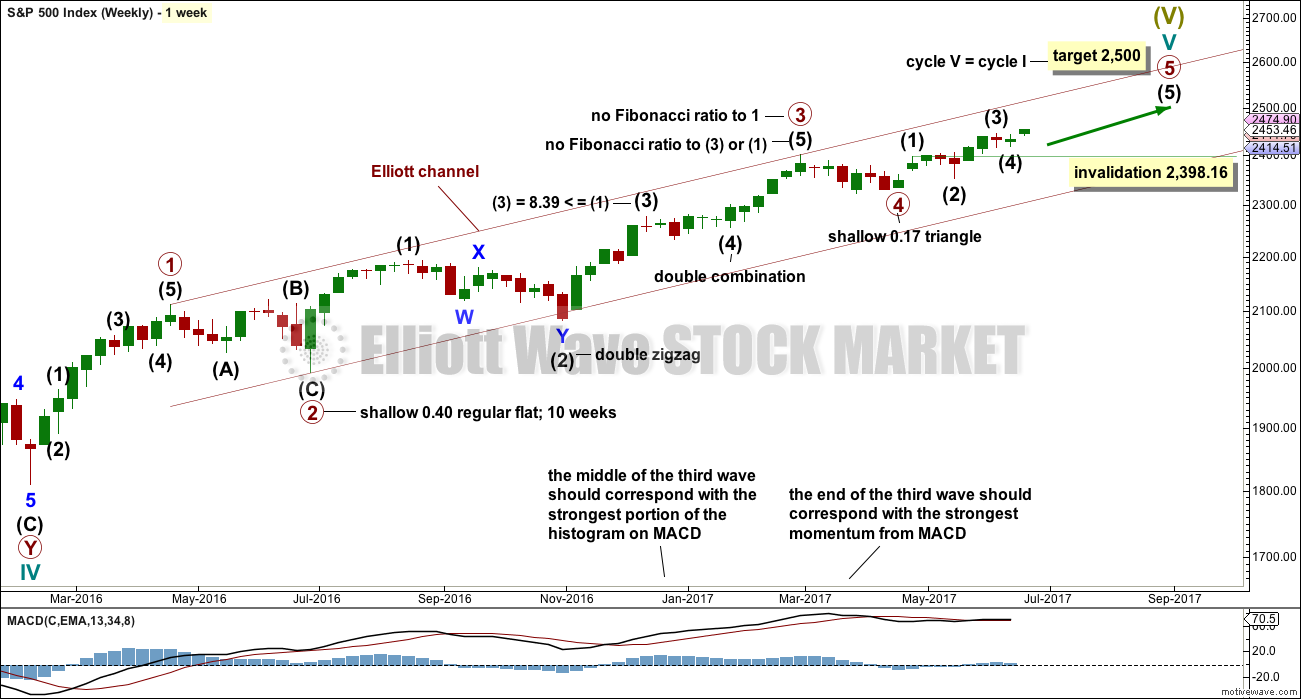
Primary wave 3 may be complete, falling short of 1.618 the length of primary wave 1 and not exhibiting a Fibonacci ratio to primary wave 1. There is a good Fibonacci ratio within primary wave 3.
The target for cycle wave V will remain the same, which has a reasonable probability. At 2,518 primary wave 5 would reach 0.618 the length of primary wave 1. If the target at 2,500 is exceeded, it may not be by much.
There is alternation between the regular flat correction of primary wave 2 and the triangle of primary wave 4.
Within primary wave 3, there is alternation between the double zigzag of intermediate wave (2) and the triangle of intermediate wave (4).
Within primary wave 5, the correction for intermediate wave (4) may not move into intermediate wave (1) price territory below 2,398.16.
DAILY CHART
Click chart to enlarge.
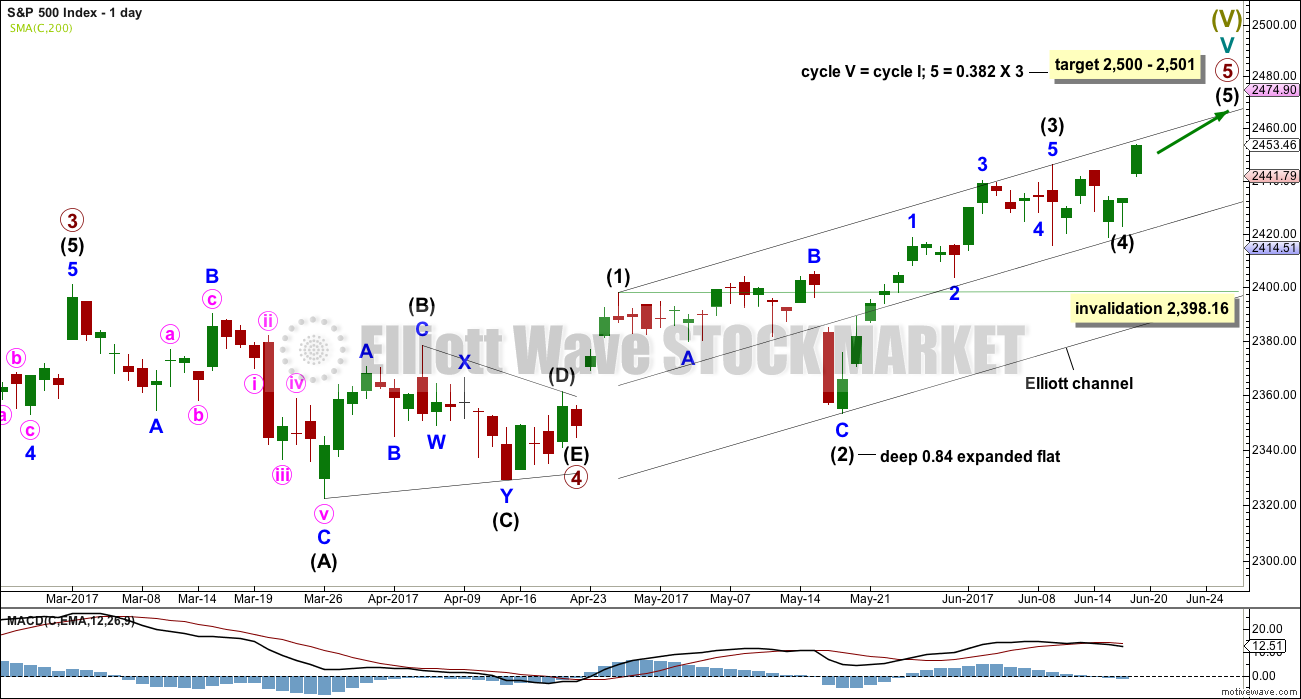
Primary wave 5 must complete as a five wave motive structure, either an impulse (more common) or an ending diagonal (less common). So far, if this wave count is correct, it looks like an impulse.
Intermediate wave (3) is a complete impulse. Intermediate wave (4) may now be a complete triangle, or it may continue as an expanded flat. Because an expanded flat would not see alternation with the expanded flat of intermediate wave (2), it is now more likely today that intermediate wave (4) is a complete triangle.
If intermediate wave (4) does continue further, then it may not move into the price territory of intermediate wave (1) below 2,398.16.
Intermediate wave (5) must be a five wave motive structure.
HOURLY CHART
Click chart to enlarge.
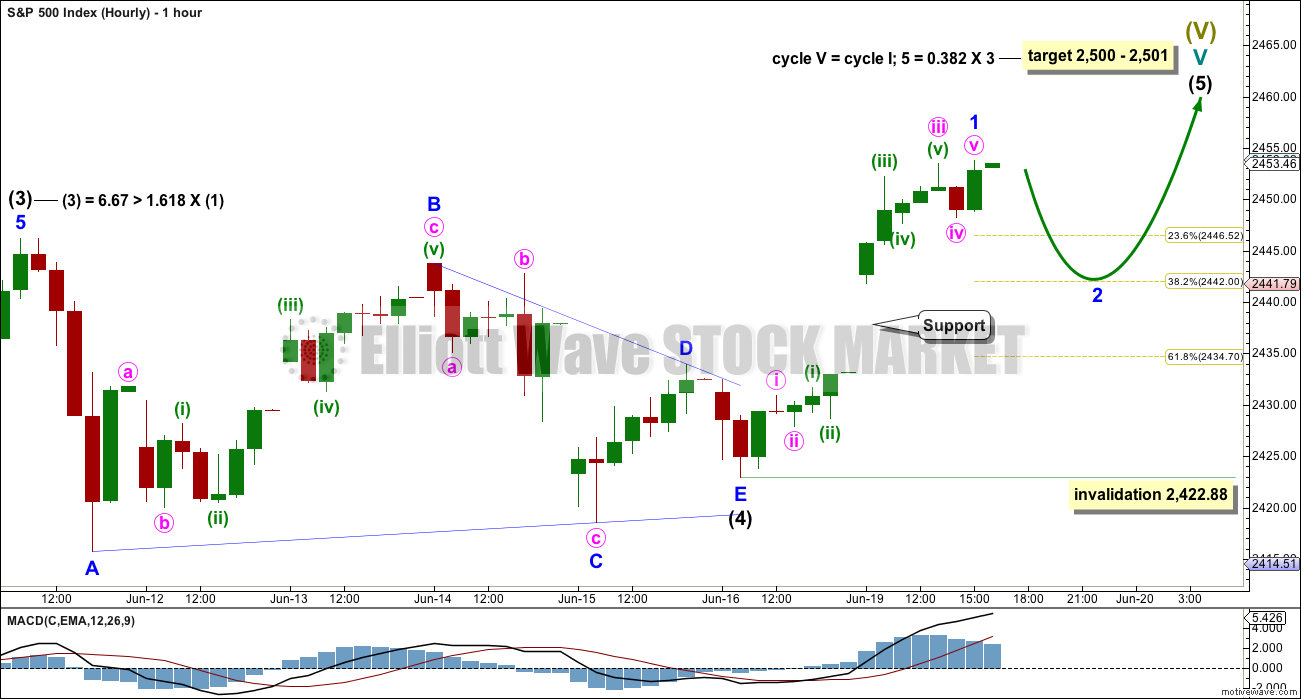
Intermediate wave (4) fits as a regular contracting triangle, which again may have come to a more swift end than expected.
Intermediate wave (5) may have begun on Friday.
The opening gap for Monday is a breakaway gap. If this is correct, then the lower edge should provide support. Stops for long positions may be set just below this gap at 2,433.15.
So far in the latter stages of this old bull market corrections within impulses have been remarkably quick and shallow. Look out for minor wave 2 to continue this pattern; it may reach down only to the 0.236 or 0.382 Fibonacci ratios.
It is also possible that minor wave 1 may not be over at today’s high; it may move higher tomorrow. If it does, then the Fibonacci retracement for minor wave 2 must be redrawn.
ALTERNATE HOURLY CHART
Click chart to enlarge.
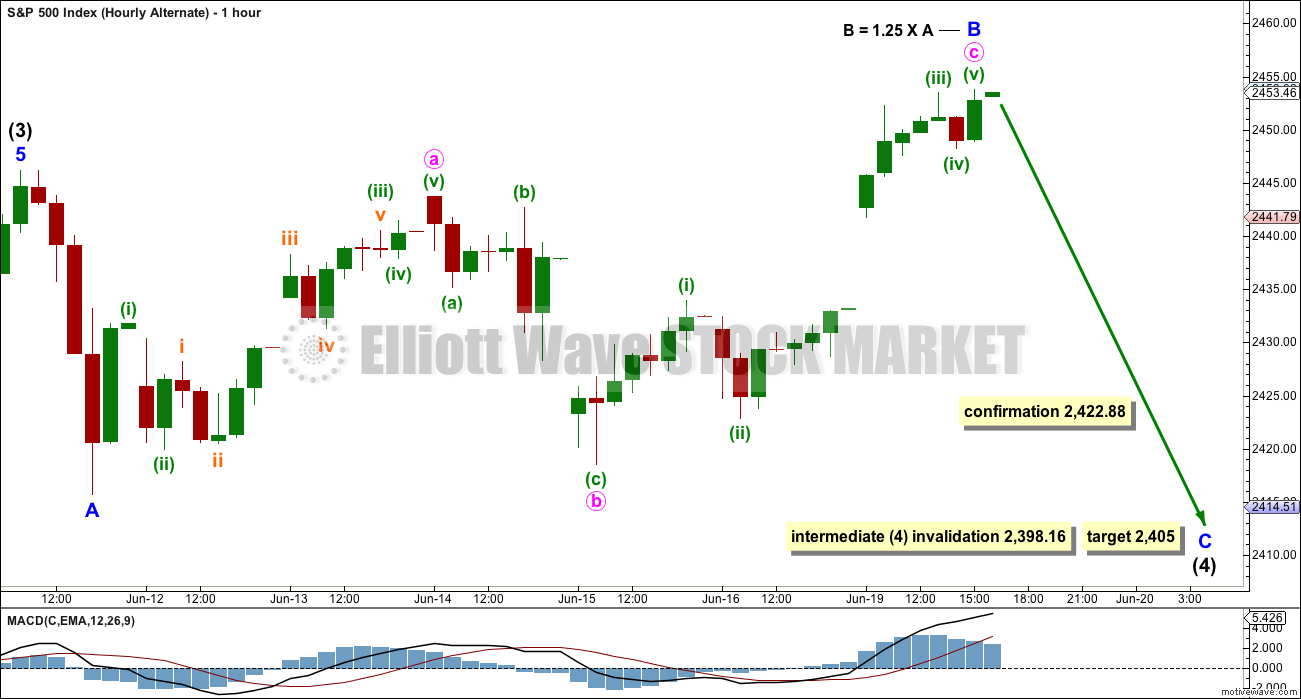
The lack of alternation between the completed expanded flat of intermediate wave (2) and this possible incomplete expanded flat of intermediate wave (4) means this wave count has a substantially reduced probability.
This wave count should only be taken seriously if price makes a new low below 2,422.88.
This wave count is published primarily to illustrate the higher probability of the main hourly wave count today. If intermediate wave (4) is not over at this stage, then the problem of a lack of alternation is a serious one.
ALTERNATE ELLIOTT WAVE COUNT
WEEKLY CHART
Click chart to enlarge.
This alternate weekly chart is a new variation of prior published alternates.
It is possible that primary wave 3 is either over now or may be very soon indeed. It is possible that a deep multi week or multi month pullback may begin for primary wave 4.
This wave count would allow for primary wave 4 to unfold with a corresponding decline in market breadth. Primary wave 5 may then continue higher towards the target, allowing for at least 4 months of divergence between market breadth and price to develop before an end to the ageing bull market. This would have a neat fit with prior major trend changes from bull to bear of every single bear market in the last 90 odd years.
Primary wave 2 was a regular flat correction lasting 10 weeks. Primary wave 4 may exhibit alternation as a single or multiple zigzag, or as a triangle. It should last at least 10 weeks and possibly longer.
Primary wave 4 may not move into primary wave 1 price territory below 2,111.05.
DAILY CHART
Click chart to enlarge.
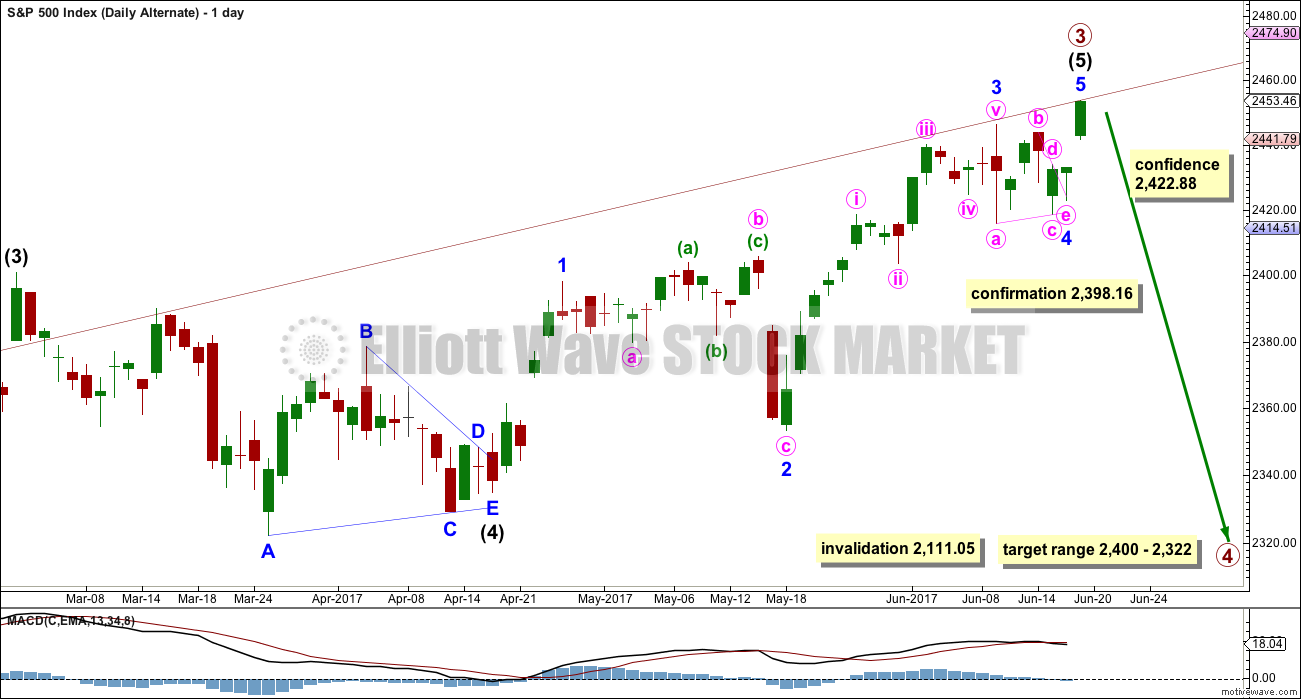
Minor wave 5 of intermediate wave (5) of primary wave 3 may be over here, or it may continue higher.
Always assume the trend remains the same until proven otherwise; assume the trend is upwards until price makes a new low below 2,422.88.
If price moves below 2,422.88, then this would be the main wave count.
Primary wave 4 may end within the price territory of the fourth wave of one lesser degree. The price range for intermediate wave (4) gives a target range for primary wave 4.
TECHNICAL ANALYSIS
WEEKLY CHART
Click chart to enlarge. Chart courtesy of StockCharts.com.
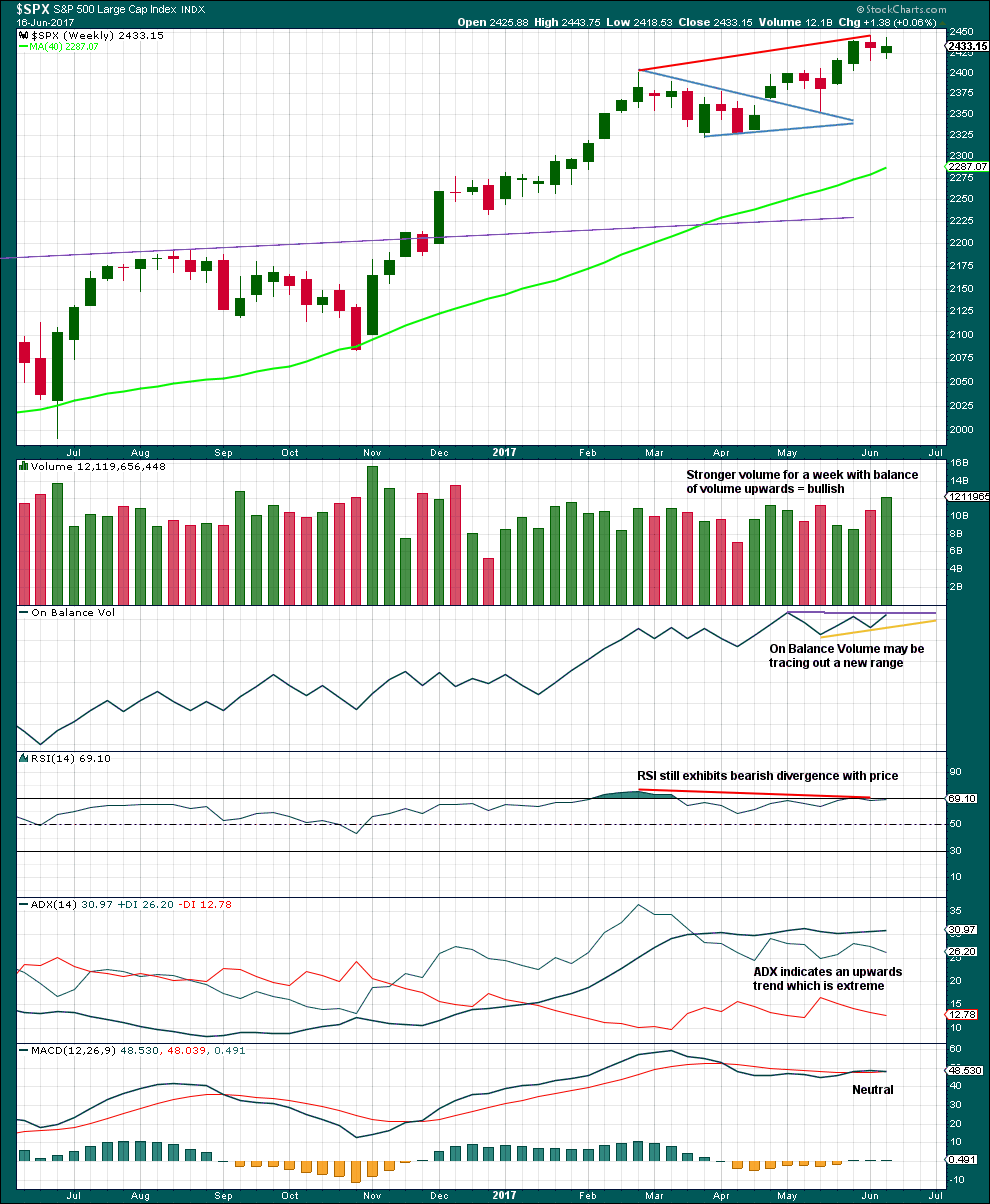
An inside week completes a small spinning top candlestick pattern. This puts the trend from up to neutral; price is consolidating. A spinning top is a pause within a trend.
An increase in volume suggests that the breakout after consolidation is likely to be upwards.
On Balance Volume trend lines are adjusted.
DAILY CHART
Click chart to enlarge. Chart courtesy of StockCharts.com.
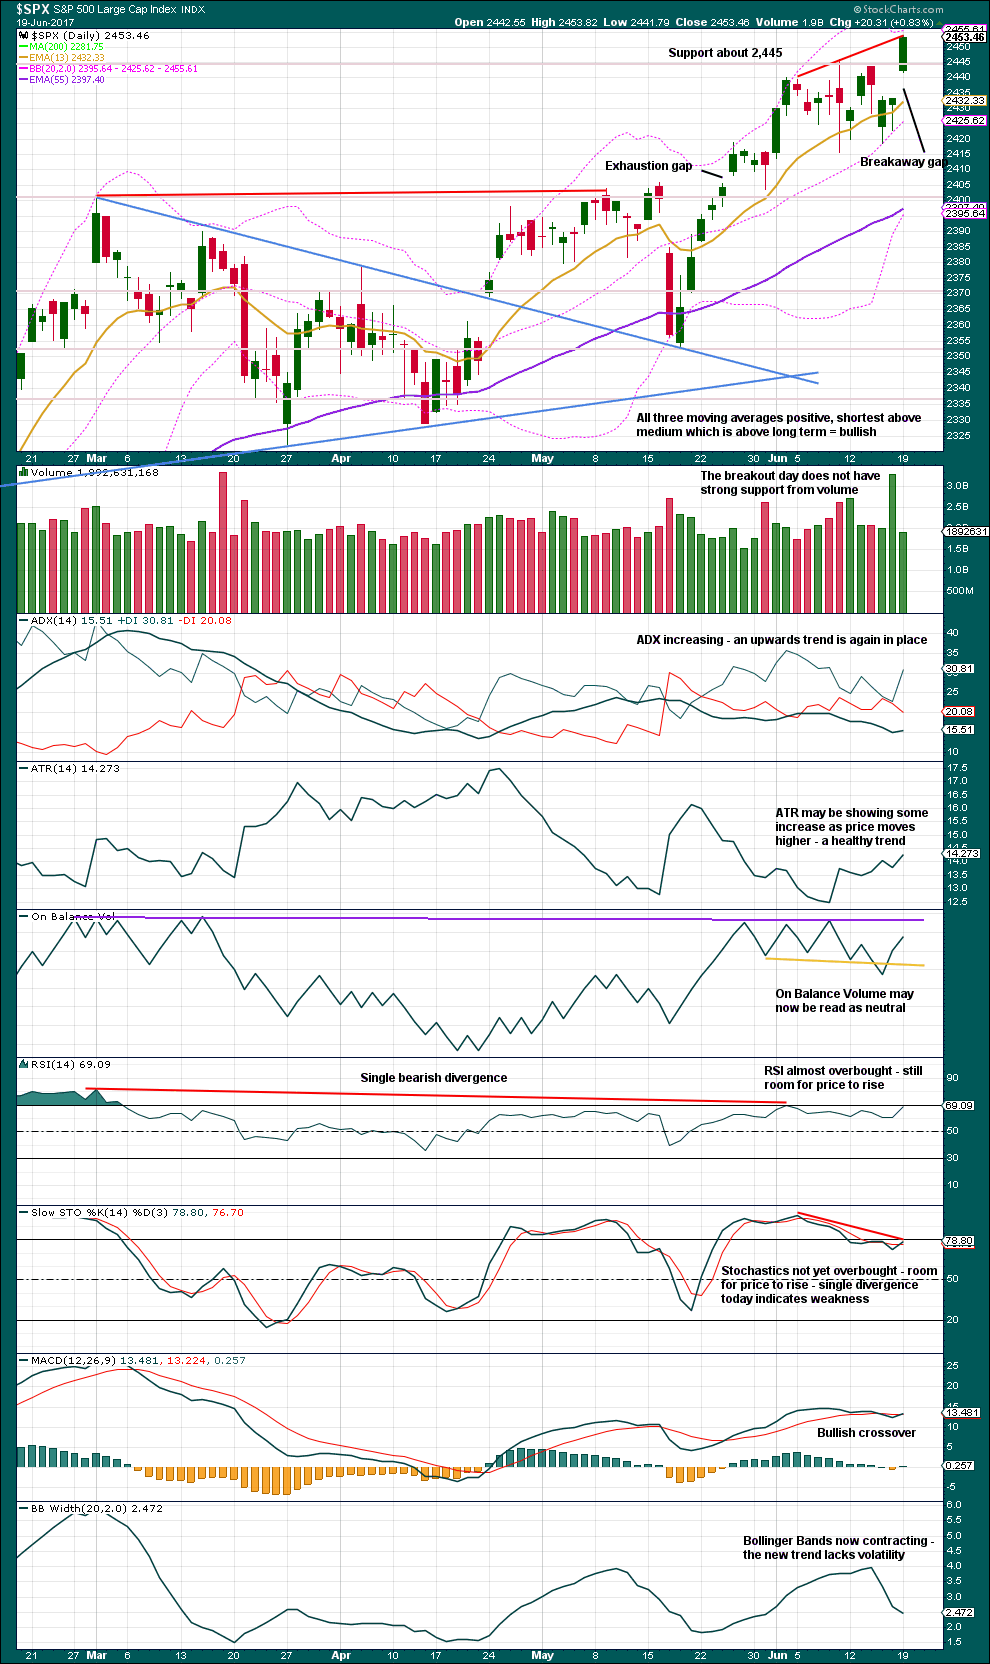
The upwards breakout lacks support from volume, so it is suspicious. However, light and declining volume has been a feature of this ageing bull market, so on its own at this stage it is not a great cause for concern.
There is now double divergence at highs between price and RSI. There is single divergence between price and On Balance Volume. There is single divergence between price and Stochastics. Upwards movement is weak, but that should be expected towards the end of an ageing bull market. This weakness does not signal that price must move lower here, only that there is weakness and traders should exercise caution.
Price is bullish. MACD is bullish. ADX indicates an upwards trend.
VOLATILITY – INVERTED VIX CHART
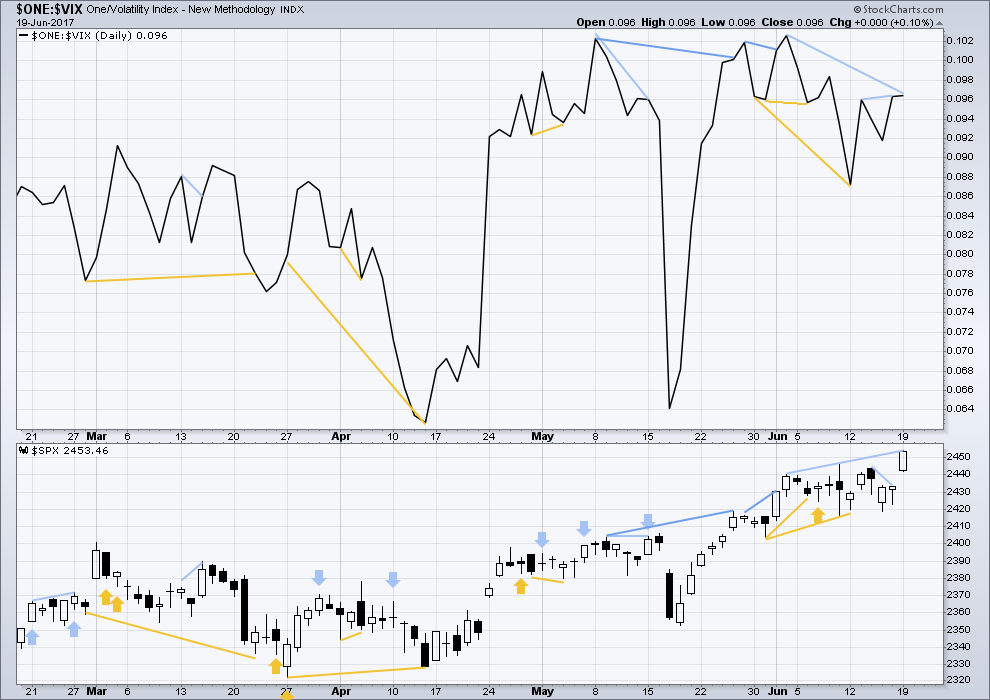
Click chart to enlarge. Chart courtesy of StockCharts.com.
Normally, volatility should decline as price moves higher and increase as price moves lower. This means that normally inverted VIX should move in the same direction as price.
There is strong divergence today between the new all time high and the prior high of the 2nd of June: price has made a new all time high today, but inverted VIX has not. This indicates weakness within upwards movement today from price and is bearish.
BREADTH – AD LINE
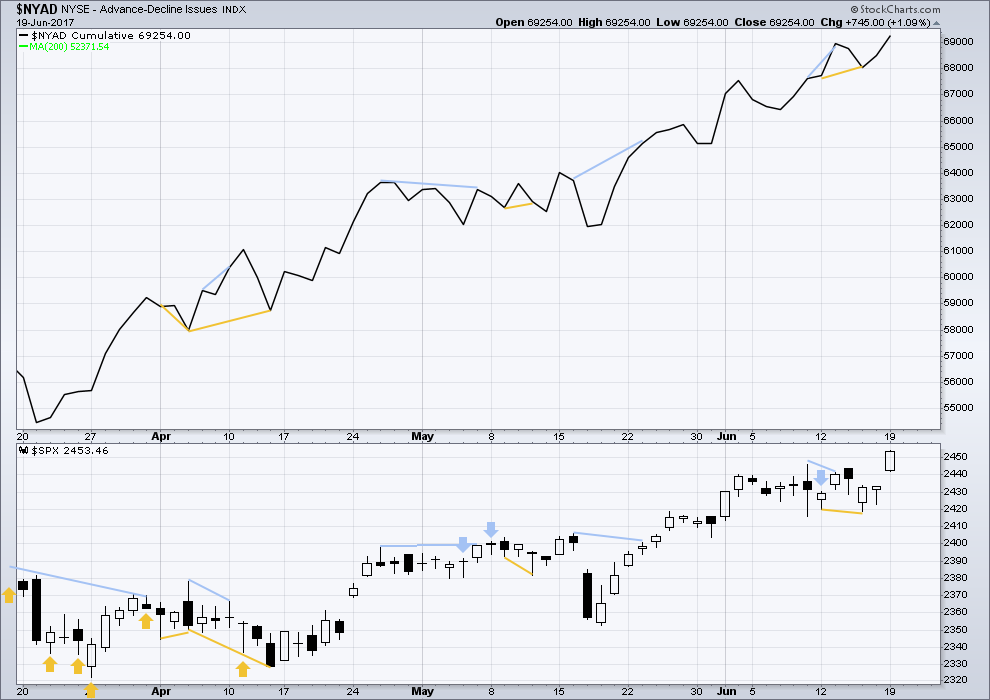
Click chart to enlarge. Chart courtesy of StockCharts.com.
With the last all time high for price, the AD line also made a new all time high. Up to the last high for price there was support from rising market breadth.
There is normally 4-6 months divergence between price and market breadth prior to a full fledged bear market. This has been so for all major bear markets within the last 90 odd years. With no divergence yet at this point, any decline in price should be expected to be a pullback within an ongoing bull market and not necessarily the start of a bear market.
Prior bullish divergence has now been followed by upwards movement. The new all time high for price was matched by a new all time high for the AD line today. The rise in price has support from market breadth.
Because divergence between price and the AD line has recently been more reliable than divergence between price and VIX, this will be given more weight. The absence of divergence with the AD line will be read as bullish and will be given more weight than the bearish divergence noted today with VIX.
The mid caps and small caps have made new all time highs along with recent last all time high for large caps. The rise in price is seen across the range of the market, so it has internal strength.
DOW THEORY
At the end of last week, DJIA, Nasdaq and the S&P500 have all made new all time highs. DJT has failed to confirm an ongoing bull market because it has not yet made new a all time high. However, at this stage that only indicates some potential weakness within the ongoing bull market and absolutely does not mean that DJT may not yet make new all time highs, and it does not mean a bear market is imminent.
The following lows need to be exceeded for Dow Theory to confirm the end of the bull market and a change to a bear market:
DJIA: 17,883.56.
DJT: 7,029.41.
S&P500: 2,083.79.
Nasdaq: 5,034.41.
Charts showing each prior major swing low used for Dow Theory are here.
This analysis is published @ 10:32 p.m. EST.
It stinks. It stinks a lot. But hold your noses folks, I don’t think it’s done yet.
So far the breakaway gap is holding support. Stops may be set just below the lower edge of the gap, because if it’s closed then it’s not a breakaway gap and the upwards breakout was false. So we wouldn’t want to be holding long positions.
As much weakness as we are seeing, there is still some strength within this old bull yet. It’s not done.
I’m putting a lot of weight on Lowry’s analysis. They have over a 90 year history. Every single bear market has been preceded by minimum 4-6 months of divergence between price and breadth. This ageing bull market has no divergence. I don’t think it can end before October, and it may end after that.
I think it may be a slow drawn out painful end, but for now, short term, the trend remains up. Go with the trend to make money.
Todays pullback looks like typical price action after a breakout. A test back of support from prior resistance. Then up and away.
As always, I could be wrong, the alternate could be correct at this time. Risk management is the key to success. Please use a stop, do not invest more than 1-5% of equity on any one trade.
Yep! We’ve seen this move before on the last gaps up. Still holding a few DIA 215 strike calls expiring this Friday. Selling DIA calls out a few weeks.
Pullback today looking corrective so it sure looks like we are heading higher Bradley turn date not withstanding. Took small profit on an SVXY 162.50 put entered yesterday as we got an island reversal open today which is somewhat in conflict with SPX corrective price action. I opened a small long trade via DIA 215 calls but mostly on sidelines for now. Left way too much money on the table in my oil trade!! 🙂
This does indeed look like the pullback opportunity to go long Lara mentioned in her analysis. My short term account is shut down, so to speak, because I have two weeks until I leave for the mountains! I am not initiating any short term trades now.
My mid and long term accounts are still 100% long as I look for the SPX 2470 profit target I identified a couple of weeks back. We are getting close. I look to exit this week or next. These accounts are looking very good for mid year returns. Thanks to all especially Lara.
I don’t know… looking at $NDX makes me lean toward Lara’s alternate. We shall see.
For what’s worth on my end, this is more than likely the nearing the end. When November’s breakdown did not follow, I got Rodney’s same count of a terminal Wave at 2470; getting close to Gann’s Square of 9 prediction of 2411 late March. Clients/Investors are either jaded and un-interested or suffering from FOMO. A pin-prick will cement the bearish psychology that will finally lead to a stop smashing, margin calling, fear lade sell off event. That being said, the central banks have continually and incessantly outperformed my expectations….with wanton disregard to the destruction they are causing to the markets.
I hear ya. One can only behold and wonder!
I keep thinking about Tim Knight’s comment about what the coming carnage is going to look like. He quipped that even he as an inveterate bear is not going to like it….!
I only hope they let me cash in my bearish trades before the music stops.
I have also literally been thinking about getting most of my cash out of my trading accounts before the worst of the third wave is upon us. I think it could get that bad…
Indeed, I would say at 30 percent down shorts would be banned. We’ve begun structuring a third of portfolio allocations under the assumption accounts would be frozen/seized/taxed, and through that process have learned there’s actually a decent amount one can do to prepare.
IWM filled its gap from Monday. Markets starting to fragment if other indices move higher.
Hey Rod, you still expecting IWM to head toward 146.00? It seems to have fallen back below the break-out level although that sometimes does happen ahead of a tear higher and the MMs shake out the early longs before the march higher. I imagine we will know shortly as it either heads higher or falls away from that resistance area.
Oil trades should be all good today Verne? I’ve got some profit protected there, no risk now.
Today’s pullback does look corrective. It looks like a perfect entry to go long.
I made a decent profit but was actually kicking myself for exiting one of my positions a bit early yesterday. My position would have literally doubled on that last spike down! 🙂
I keep reminding myself to pay close attention to your price targets.
The particular trade I (CLR) was in did put in a hammer today though so I expect to see a near term bounce that will offer a good re-entry. I still love the chart analysis on Oil and think we still have a ways to go. Awesome analysis!
Cheers Verne 🙂
Yes, Oil has been gifting us with some nice profits. When that market trends I really do like it, it is relatively easy to analyse.
Oil and Silver can move in almost straight lines when they trend. Nice for a trade to hold for a few weeks.
The 30 Year Treasury Yield broke below 2.75% this morning to a low of 2.747%! It has recovered to 2.752%.
If it breaks below 2.75% again and accelerates lower from there… this will be a very bad sign for Stocks!
If things were really that good out there… the 30 year yield should be rising in an up trend. It is not! Especially with the Fed announcing and starting to reduce the size it’s Huge Balance Sheet. Something is going on that has not yet come to light!
I think the market is saying it disagrees with the FED on the matter of inflation and I think the market is right on that particular score. What the market is also ignoring is the level of systemic risk and on that score I think the market is insane. Complacency all around is at multi decade extremes. The sub-prime auto loan market, much of which has been bundled into investment grade bonds (don’t we ever learn???!) is blowing up as we speak. A lot of folk investing other people’s money, like pension funds, snapped up this garbage because of the high yield and the default rate is now higher than the mortgage mess in 2008. Nobody is even the slightest bit concerned about insolvent Puerto Rico and my own hapless state of Illinois it would appear….
30 Year T …. 2.742% right now 12:25PM
… now 2.738%
Joseph that is nuts! Are they ALREADY anticipating additional QE??!!!
NO!
It was announced & they have started to reduce the Huge balance sheet!
Oh I am well aware that they “announced” it… 😉
Speaking of bonds, Argentina was able to unload almost 3 billion worth of paper with a 100 year maturity date. I am curious as to who is buying and what rate they are getting.
30 Year T Close… 2.735%
Not individuals… institutions would be buying. Insurance Companies and maybe pension funds.
Are these folk criminals, or are they colluding??! 🙂
Maybe both! Those bonds are probably going to trade for scant pennies on the dollar long before they are due I wager…
And the largest growing debt is American student loans. Already the percentage of defaults is very high. This is over 1 Trillion dollars alone!
….AND….credit cards.
Has anybody seen the relative household debt of Canadians recently?!
Those guys are making us, as bad as we are, look like pikers!
Move down today coming on high volume…a cautionary tale for the bulls….
Here in New Zealand our household debt is over 160% of disposable income.
It’s worse now than in 2007.
It is 167% in Canada, which is much higher than it was in the US at the start of the great recession in 2008.
I assume most of that in NZ is also attributable to mortgage debt?
The last data for 1st Quarter of 2017 has NZ household debt at 167.2%.
Yes, it’s mortgage debt, mostly.
Kiwis have an obsession with property as an investment. They’re leveraging the family home to buy rental property. Or to put in a new kitchen, or take a family holiday to Fiji or Hawaii, or to buy a jet-ski or BMW.
Those who own property in NZ insist prices can only ever go up. There can be no crash. Maybe a plateau for a bit, but no crash.
When I look at charts of NZ property prices I see a clear a bubble as there ever could be.
But I’ve learned the hard way as my patience is tested to the limit, that bubbles can inflate further and for longer than anyone ever expects. It’s impossible to tell when they’ll burst, but burst they do. Eventually.
Central bankster chump change!! 😀
hi, may i ask whats the lowest point that s&p could still complete a 5 ,and the ageing bull market. is it 2500 ?
Technically it could be complete at any time. There is no lowest point.
helloooo, how are you all
Hi Doc 🙂 I’m getting better. Very happy with my Gold and Oil trades, now to find an entry to go long on the S&P.