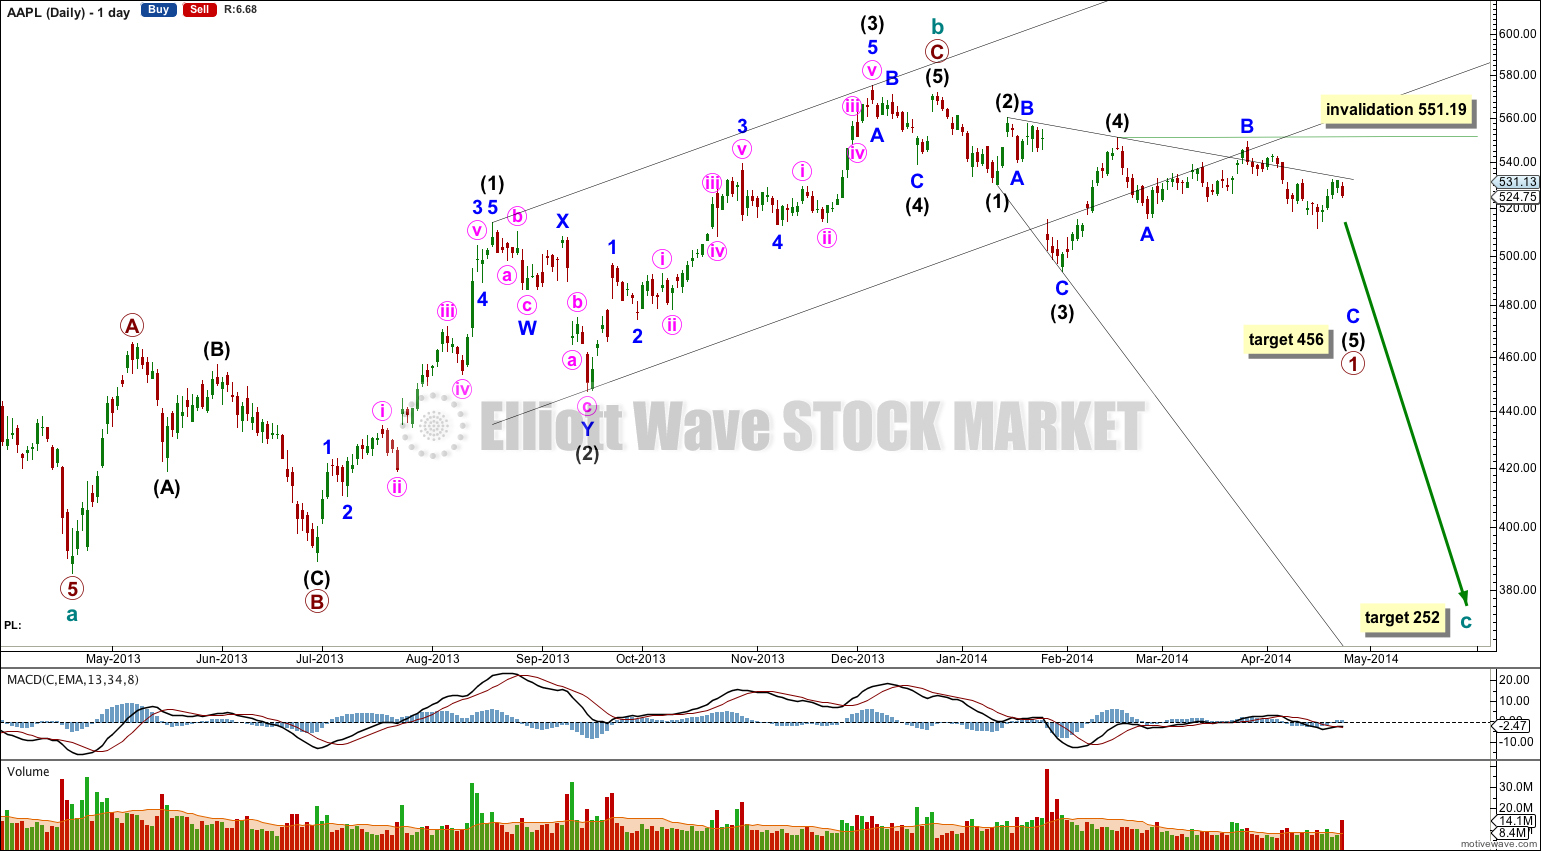
Within the bigger picture this wave count sees AAPL in a super cycle zigzag correction which is just over two thirds completed.
Click on charts to enlarge.
Within the zigzag cycle wave b ended at 571.88 with a small truncation in the final fifth wave up.
At this stage I expect a big leading expanding diagonal is unfolding for a first wave at primary degree.
Within the leading diagonal intermediate wave (2) is a 72% correction of intermediate wave (1), and intermediate wave (4) is a 86% correction of intermediate wave (3).
I would expect intermediate wave (5) to be longer than intermediate wave (3) and to reach down to 484.54 or below. At 456 minor wave C within intermediate wave (5) would reach 2.618 the length of minor wave A.
Downwards movement is very slow and so the target may be yet another few weeks away.
Within intermediate wave (5) minor wave B may not move beyond the start of minor wave A. This wave count is invalidated with movement above 551.19.
At 252 cycle wave c would reach equality in length with cycle wave a. This target is about one year away.
Within intermediate wave (5) so far minor waves A and B are most likely complete.
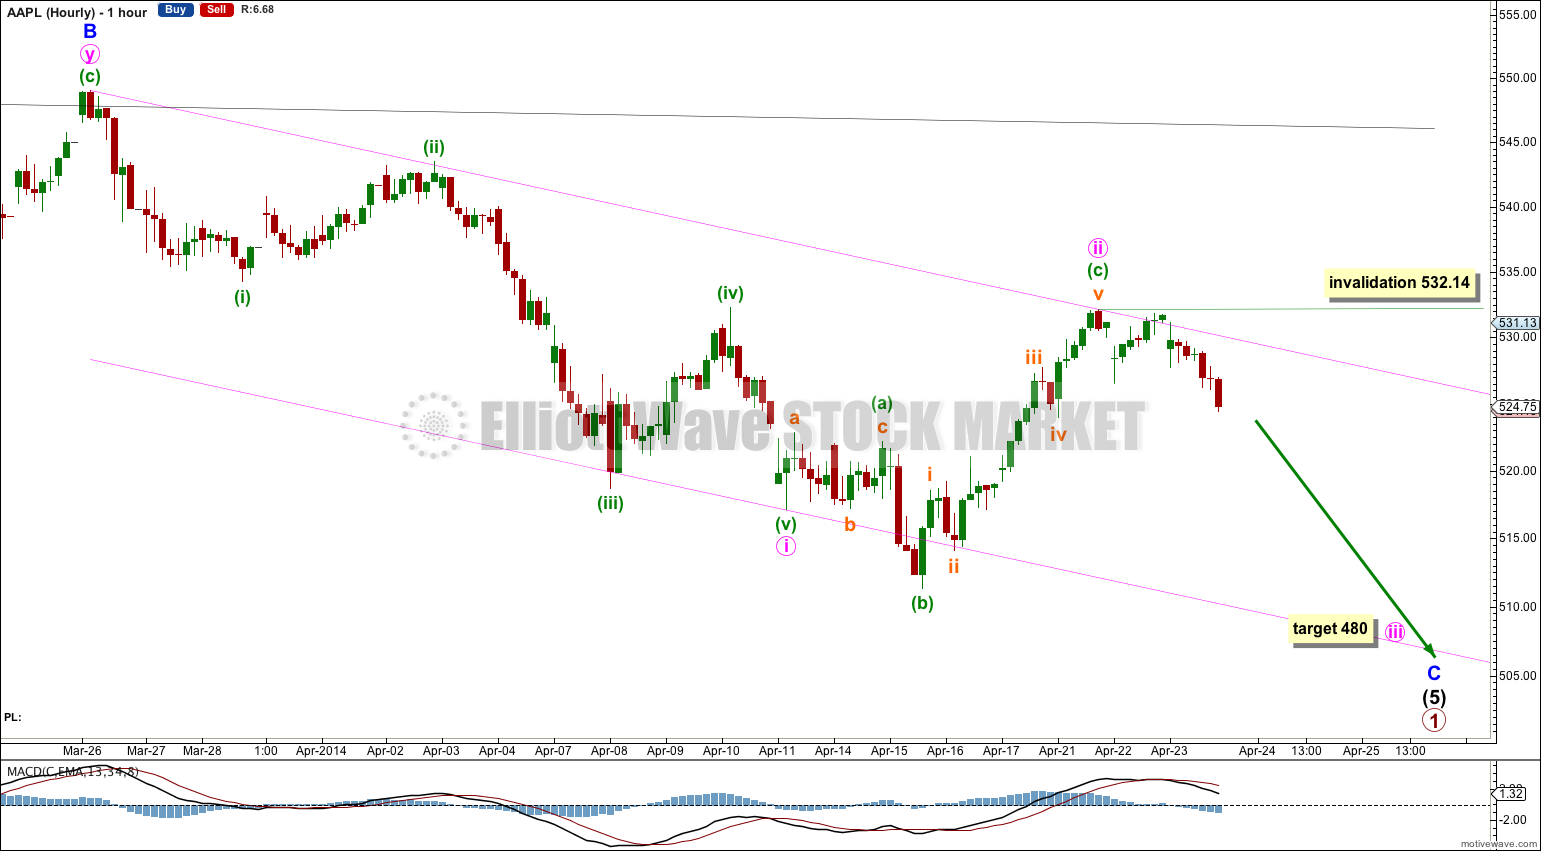
Within minor wave C minute wave i and now ii also are most likely complete.
At 480 minute wave iii would reach 1.618 the length of minute wave i.
The pink channel drawn about minute waves i and ii is a base channel. I would expect corrections along the way down to find resistance at the upper edge of the channel. Minute wave iii should breach the lower edge of the channel and should show an increase in downwards momentum.
Within minute wave iii no second wave correction may move beyond its start above 532.14.


Where i see that somebody is drawing expanding pattern i have always opposite position on the market and it works. Good trading indicator.
For me such thing like expanding diagonal never existed.
You can certainly hold to that idea, but it’s not true to say expanding diagonals never existed.
Go back to the beginning of March and see my daily Gold charts. There is a perfect leading expanding diagonal for an A wave there, followed by an expanded flat for a B wave.
I’ve seen plenty over the years.
But the problem with them (and triangles) is all that choppy overlapping movement can be analysed in more than one way while it’s unfolding, and only once the structure is complete is it clear. That is what makes diagonals, triangles and combinations so difficult. And there’s no way I’m always going to get it right.
Lara, I’m confused why you would post this count when AAPL was trading well above the invalidation points after the close? I saw a count yesterday which sees the correction from $385 still ongoing as a double zig zag. The X wave is shallow and I think it has a really good fit and the subdivisions seem to all fit. The movement today would be wave iii of c of Y.
Because the data I have is session only data. When I published this I had no idea price had jumped up so strongly.
The wave count is invalidated.
AAPL has been a pain lately.
According to your analysis, won’t this count be invalidated today when the stock opens up around 565?
Yes.
I’ll have to re-analyse AAPL.