
S&P 500: Elliott Wave and Technical Analysis | Charts – June 1, 2020
Attention remains on the second target.
Summary: The next target is at 3,238. Use the lower edge of the Elliott channel to indicate where support may be found on the way up.
Price and On Balance Volume have overcome resistance. We should continue to assume the upwards mid-term trend remains the same until proven otherwise.
The following points would provide confidence that the bounce is over:
1. A bearish candlestick reversal pattern.
2. A breach of the black upwards sloping Elliott channel on the main daily chart by downwards movement.
3. A new low below 2,933.59.
This bounce that began on 23rd of March is still expected to be a counter trend bounce within an ongoing bear market. When the bounce is complete, then the bear market is expected to resume with strength.
The biggest picture, Grand Super Cycle analysis, is here.
Last monthly charts are here. Video is here. Members are encouraged to view all three monthly charts. The third is much more bearish than this main wave count and remains a valid possibility.
ELLIOTT WAVE COUNTS
WEEKLY CHART
Click chart to enlarge.
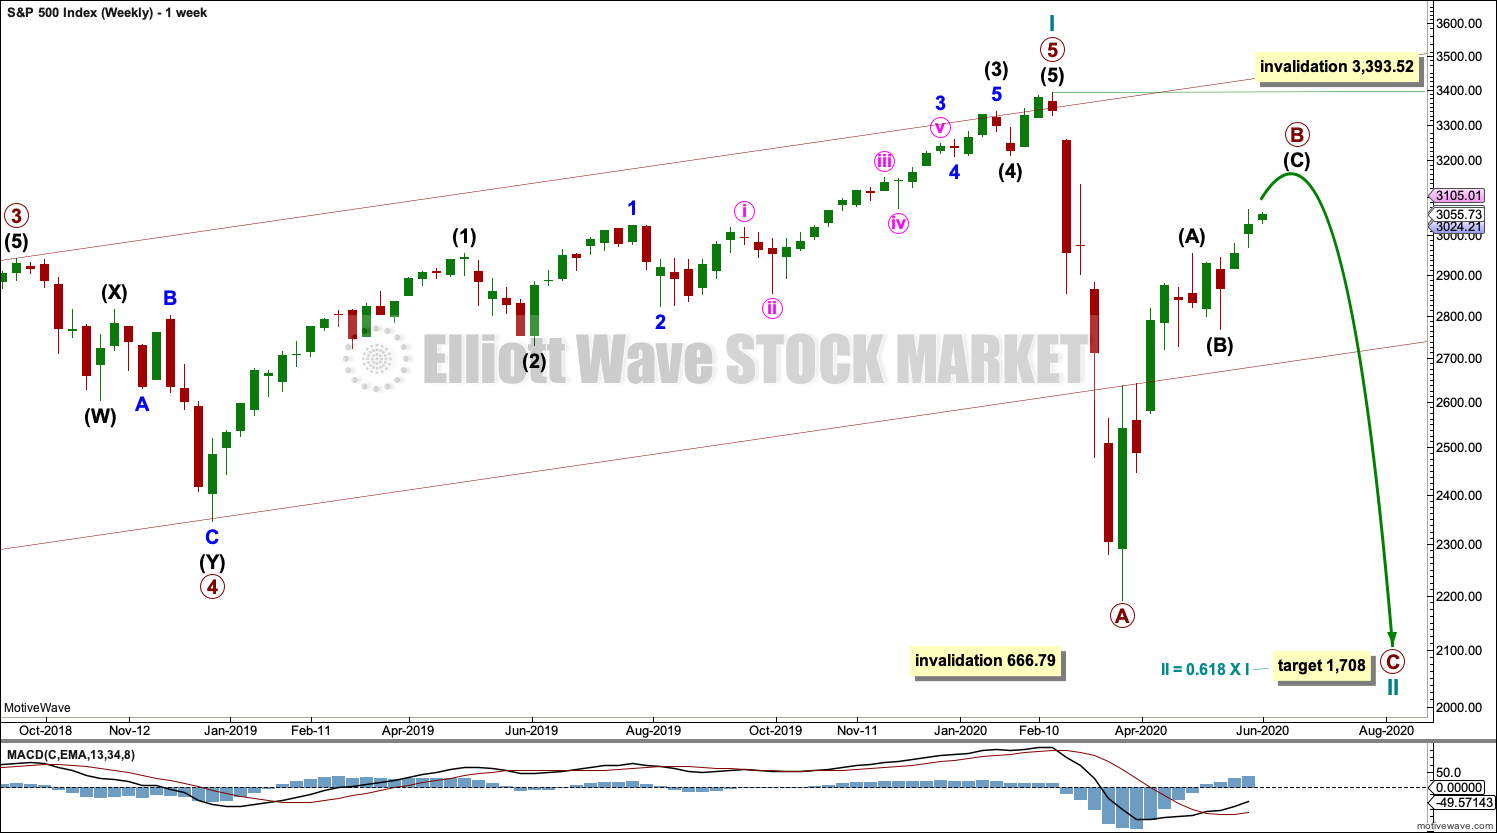
This main Elliott wave count expects that the bull market beginning in March 2009 was cycle wave I of Super Cycle wave (V). The trend change in February 2020 may have been only at cycle degree. Cycle wave II may last from one to a few years.
Cycle wave II would most likely subdivide as a zigzag; thus far that looks like what is unfolding. When primary waves A and B may both be complete, then the target may be calculated using a Fibonacci ratio between primary waves A and C. At that stage, the final target may change or widen to a zone.
Cycle wave II may not move beyond the start of cycle wave I below 666.79.
DAILY CHART
Click chart to enlarge.
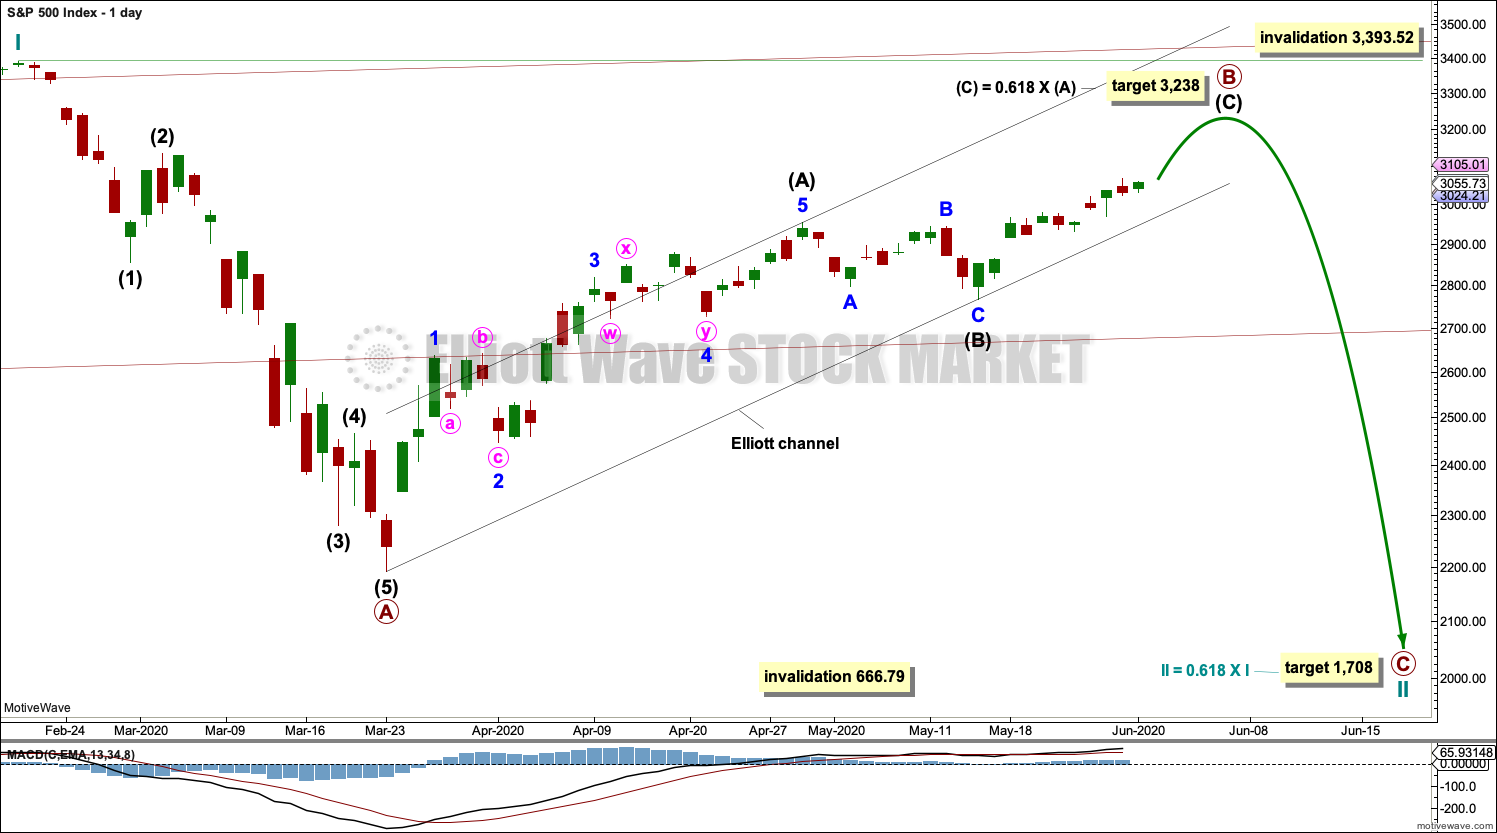
Draw the wide maroon trend channel carefully: draw the first trend line from the end of primary wave 1 at 2,093.55 (December 26, 2014), to the end of primary wave 3 at 2,940.91 (September 21, 2018), then place a parallel copy on the end of primary wave 2 at 1,810.10 (February 11, 2016). The channel is fully breached indicating a trend change from the multi-year bull trend to a new bear trend. Resistance at the lower edge has been overcome; price has closed above this trend line.
Cycle wave II may subdivide as any Elliott wave corrective structure except a triangle. It would most likely be a zigzag (zigzags subdivide 5-3-5). Primary wave A may be a complete five wave impulse downwards. Primary wave B may not move beyond the start of primary wave A above 3,393.52.
Draw a channel about primary wave B using Elliott’s technique for a correction. Draw the first trend line from the start of intermediate wave A to the end of intermediate wave B, then place a parallel copy on the end of intermediate wave A. Intermediate wave C may find resistance at the upper edge of the channel. While intermediate wave C unfolds higher, any smaller pullbacks within it may find support at the lower edge of this channel.
When this channel is breached by downwards movement, it would then indicate the bounce labelled primary wave B may be over and the next large downwards wave labelled primary wave C may then have begun. This is how the channel will be used this week.
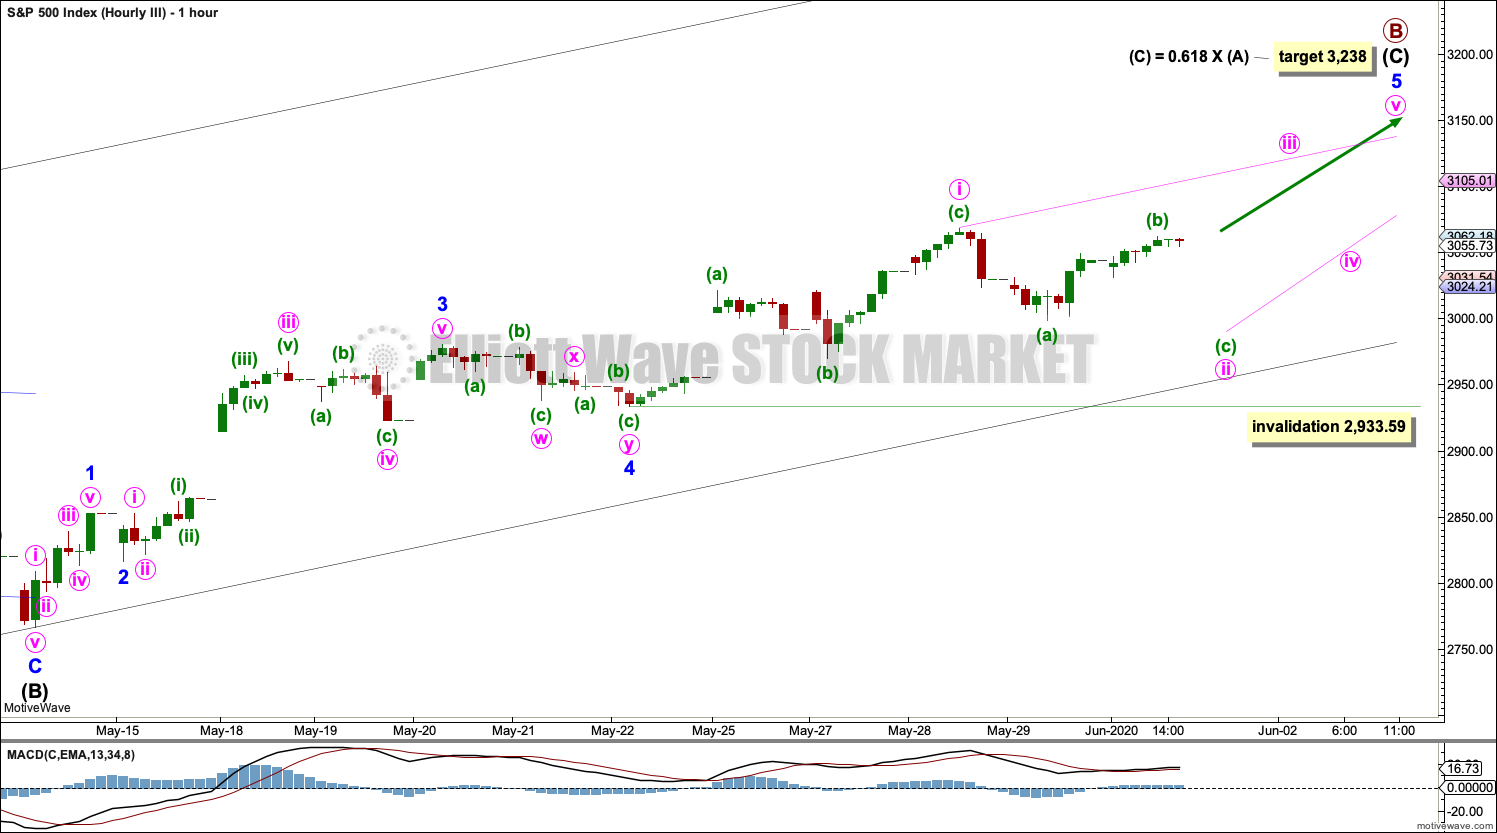
FIRST HOURLY CHART
Click chart to enlarge.
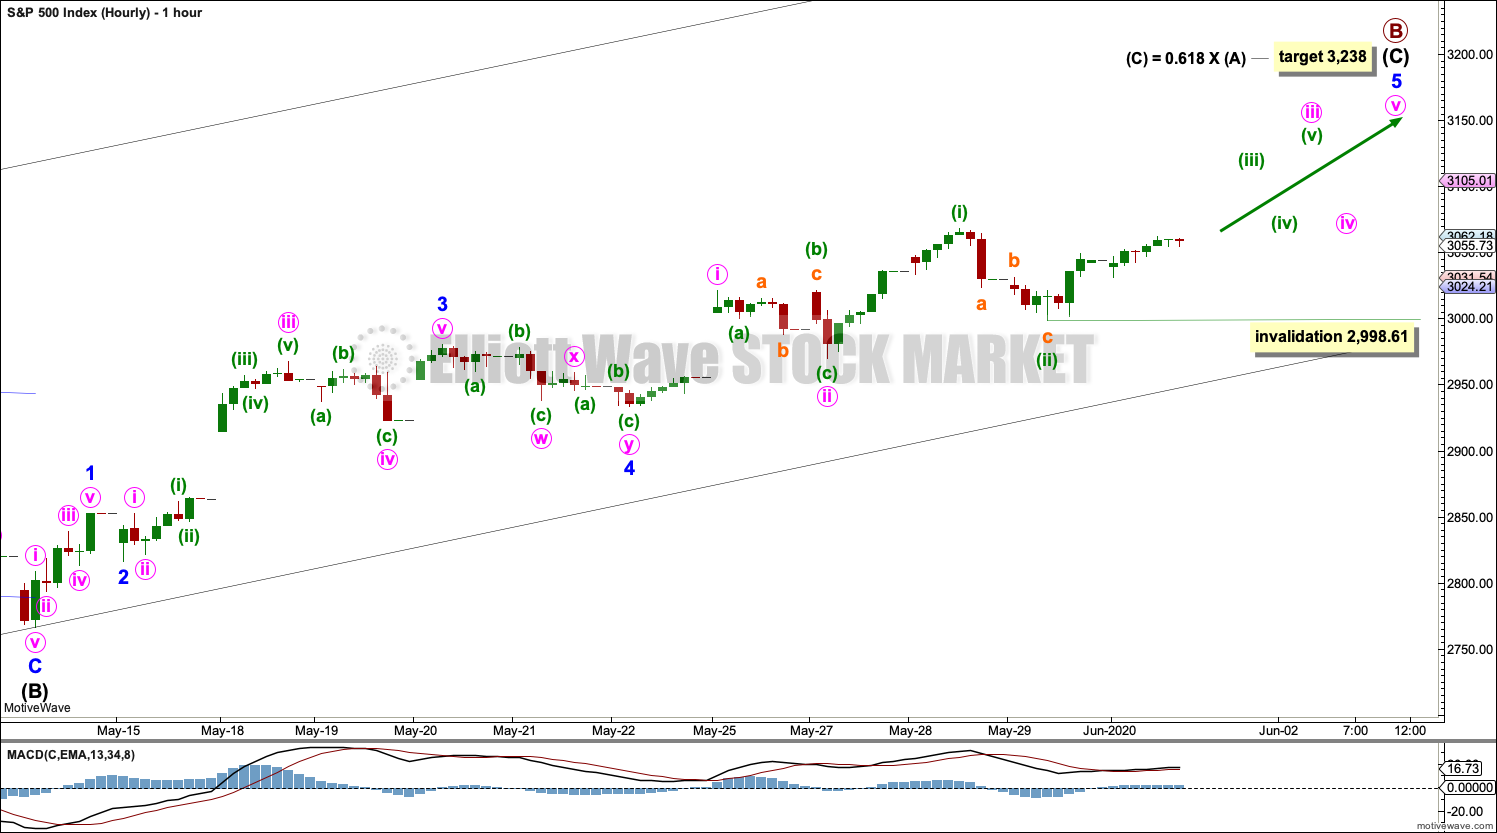
Intermediate wave (C) may continue for another one to two weeks.
Intermediate wave (C) must subdivide as a five wave motive structure, either an impulse or an ending diagonal. An impulse is much more likely, so that is what shall be expected unless overlapping suggests a diagonal.
Intermediate wave (C) is labelled to fit with MACD. Minute wave iii within minor wave 3 corresponds to the strongest momentum on MACD, and minuette wave (iii) as the middle of the third wave corresponds to the strongest portion of the histogram on MACD.
Minor wave 5 within intermediate wave (5) may be extending. Minute waves i and ii within minor wave 5 may be complete. Minute wave iii may only subdivide as an impulse. Minuette waves (i) and (ii) within minute wave iii may now be complete. No second wave correction within minuette wave (iii) may move beyond the start of its first wave below 2,998.61.
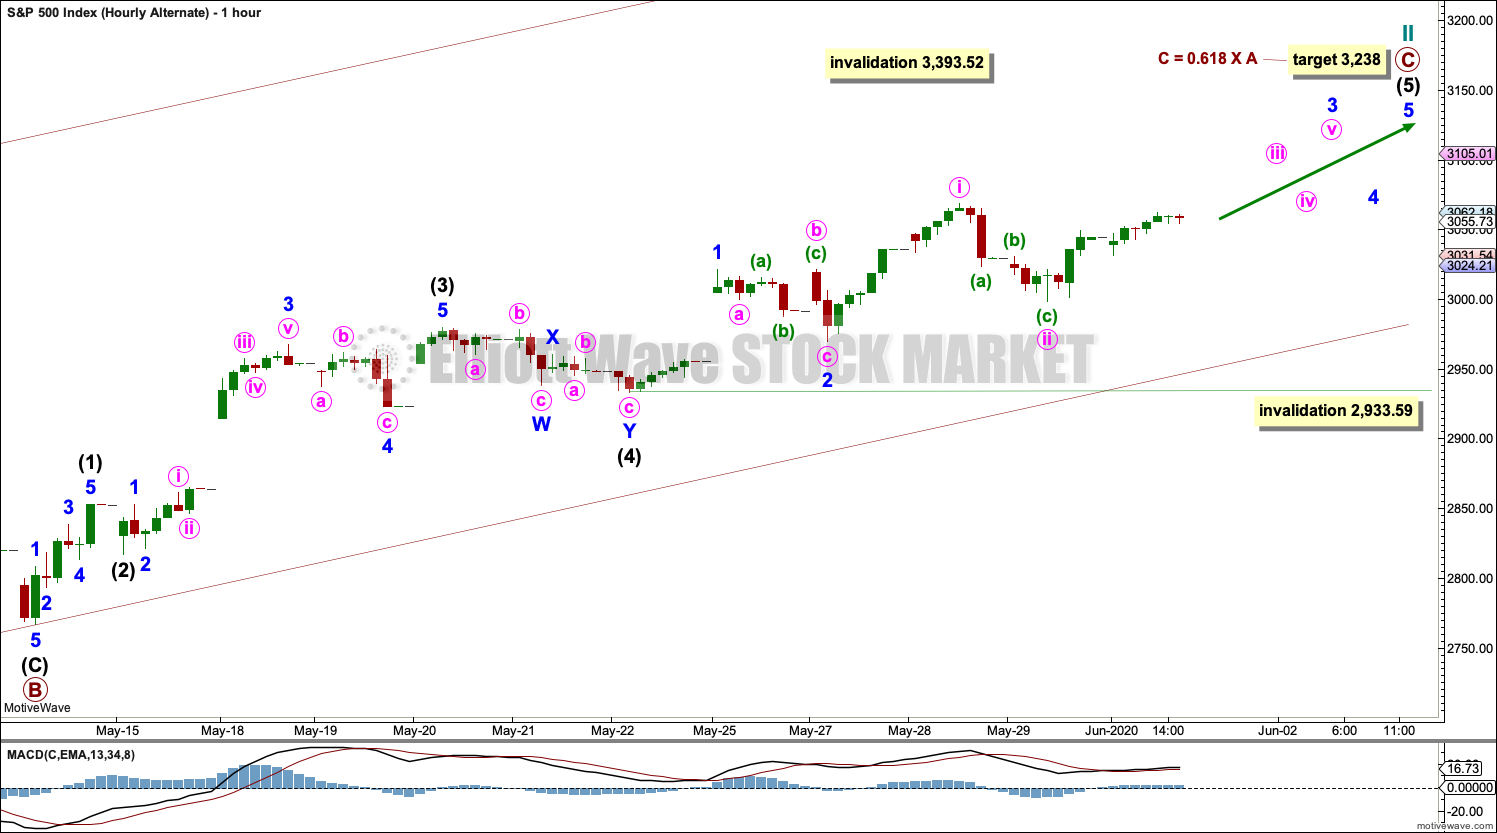
SECOND HOURLY CHART
Click chart to enlarge.
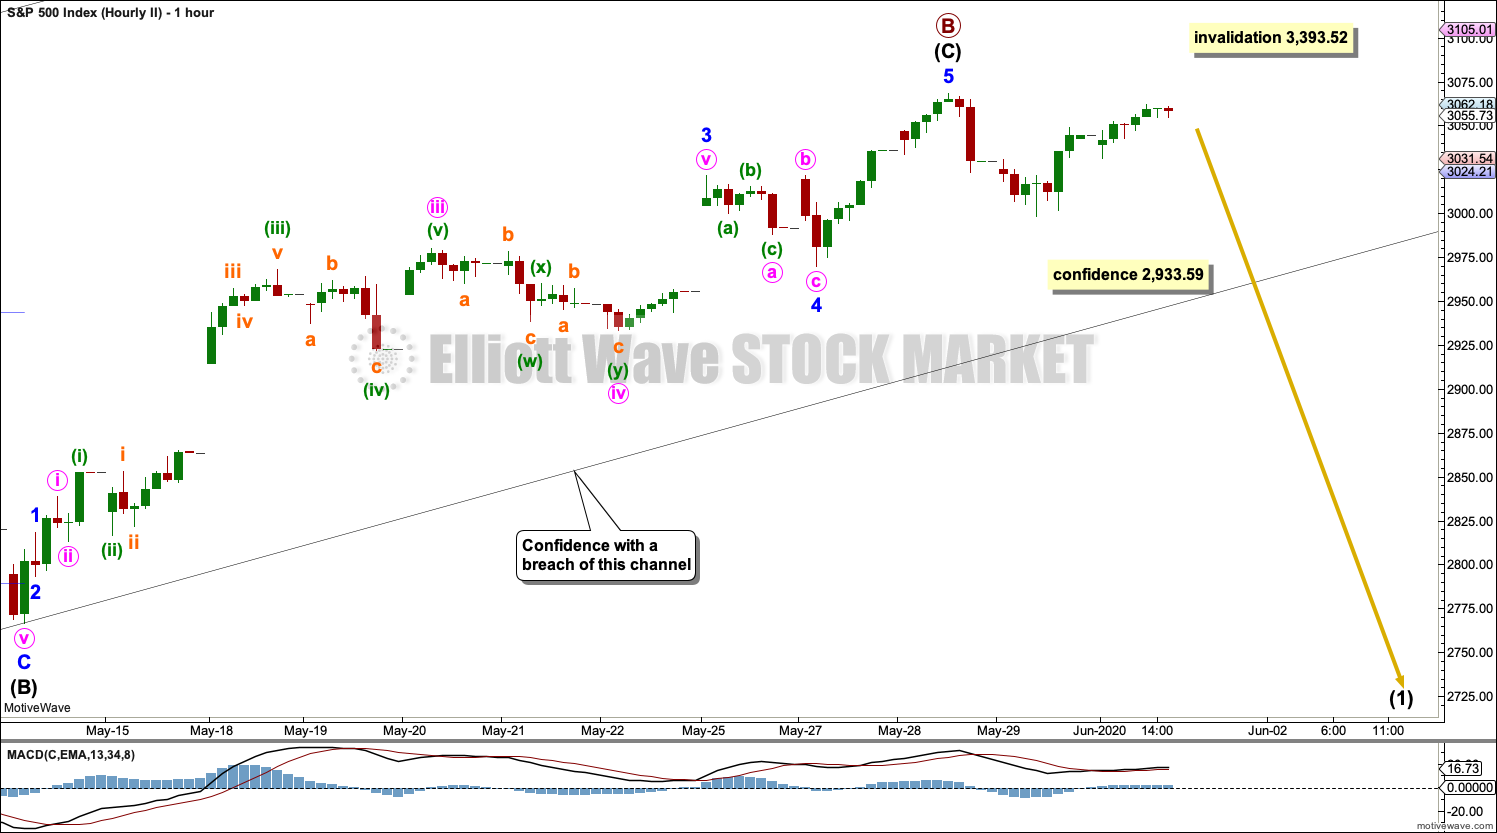
It is possible that intermediate wave (C) is complete.
This labelling also fits with MACD. The strongest momentum is still within the third wave.
A new low below 2,933.59 would increase the probability of this wave count.
If price breaks below the lower edge of the trend channel, then this wave count would be the most likely scenario. At that stage, a target for primary wave C would be calculated that would be reasonably below the end of primary wave A at 2,191.86.
The upper invalidation point for this wave count is left at 3,393.52 to allow for the possibility that minor wave 5 may extend higher. A new low below the start of minor wave 5 at 2,998.61 would eliminate this possibility with this labelling.
THIRD HOURLY CHART
Click chart to enlarge.
This third hourly chart is the same as the first up to the end of minor wave 4. Thereafter, it considers the less likely possibility that minor wave 5 may unfold as an ending diagonal.
All sub-waves within an ending diagonal must subdivide as zigzags. Minute wave i may now be a complete zigzag. Minute wave ii may now continue lower as a zigzag to end within a normal range of 0.66 to 0.81 the depth of minute wave i from 2,979.54 to 2,959.25.
Minute wave ii may not move beyond the start of minute wave i below 2,933.59.
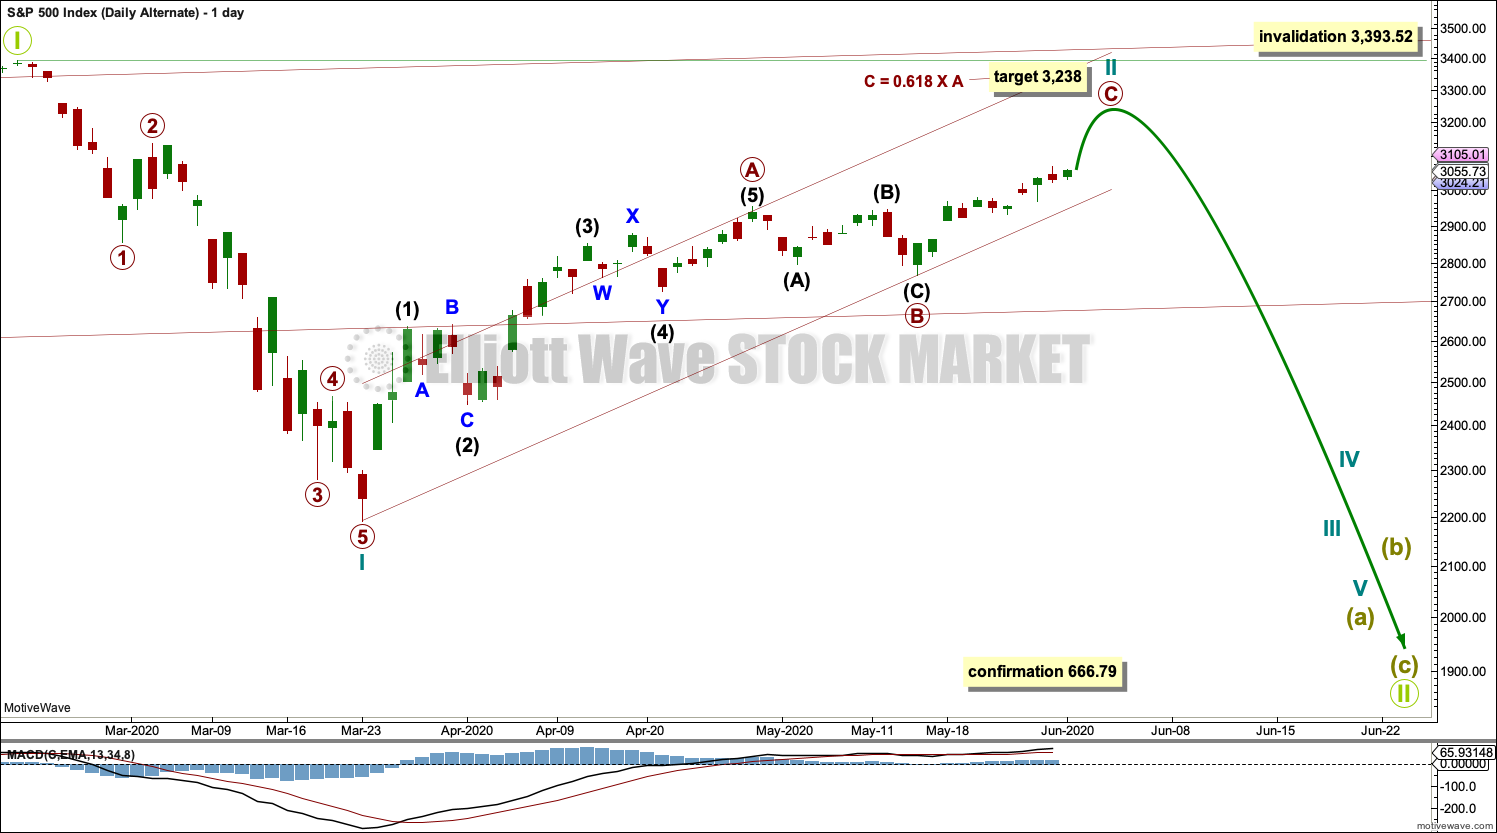
ALTERNATE DAILY CHART
Click chart to enlarge.
This alternate daily chart follows the Second Alternate Monthly chart published here. Video is here.
By simply moving the degree of labelling in the bull market beginning March 2009 up one degree, it is possible that a Grand Super Cycle trend change occurred on February 19, 2020. The bull market from March 2009 to February 2020 may have been a complete fifth wave labelled Super Cycle wave (V).
A bear market at Grand Super Cycle degree may be expected to last at least a decade, possibly longer. Corrections for this market tend to be much quicker than bullish moves, and so a fair amount of flexibility is required in expectations for duration of the different degrees.
Grand Super Cycle II would most likely subdivide as a zigzag, although it may be any corrective structure except a triangle. It should begin with a five down at the weekly chart time frame, which would be incomplete.
The first wave down on the daily chart is labelled cycle wave I. If this degree of labelling is wrong, it may be too high; it may need to be moved down one degree.
Following cycle wave I, cycle wave II may be continuing higher as a zigzag. Cycle wave II may not move beyond the start of cycle wave I above 3,393.52.
When cycle wave II may again be complete, then a target for cycle wave III may be calculated.
ALTERNATE HOURLY CHART
Click chart to enlarge.
Cycle wave II may be a continuing higher as a single zigzag. Hourly wave counts for the main daily chart work in the same way for this alternate. The degree of labelling for this alternate is all one degree higher.
TECHNICAL ANALYSIS
WEEKLY CHART
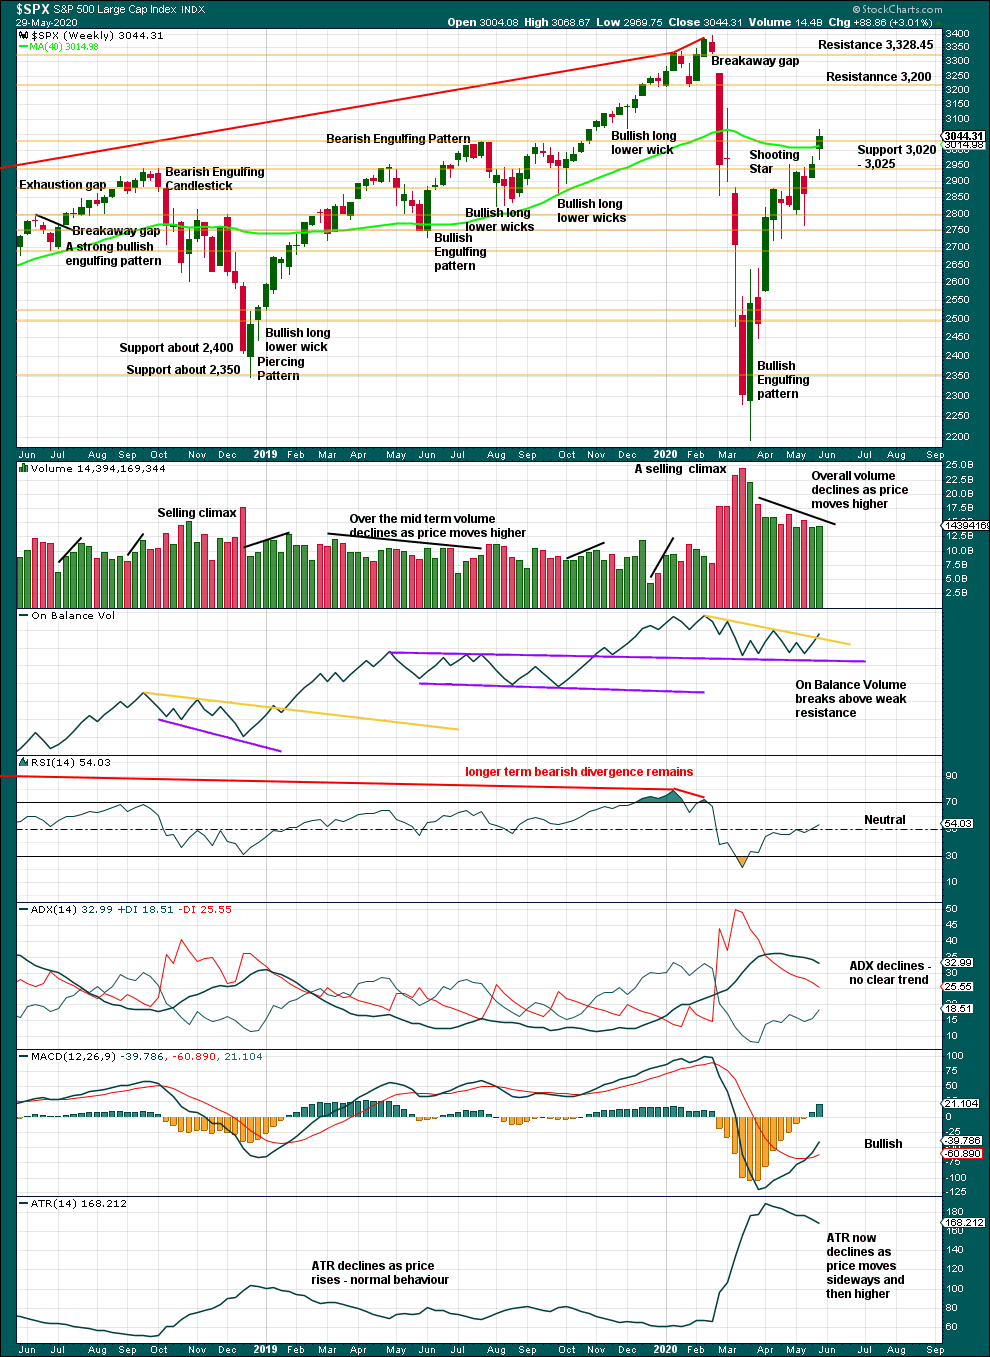
Click chart to enlarge. Chart courtesy of StockCharts.com.
Price and On Balance Volume have both broken above resistance. This may release some energy and allow price to move higher.
The breakaway gap has its upper edge at 3,328.45. This may offer strong and final resistance.
If this gap is closed and / or if the AD line makes a new all time high in the next week or two, then a much more bullish wave count would be considered. Until that happens this analysis will continue to expect upwards movement is the first deep counter trend bounce within an ongoing bear market.
DAILY CHART
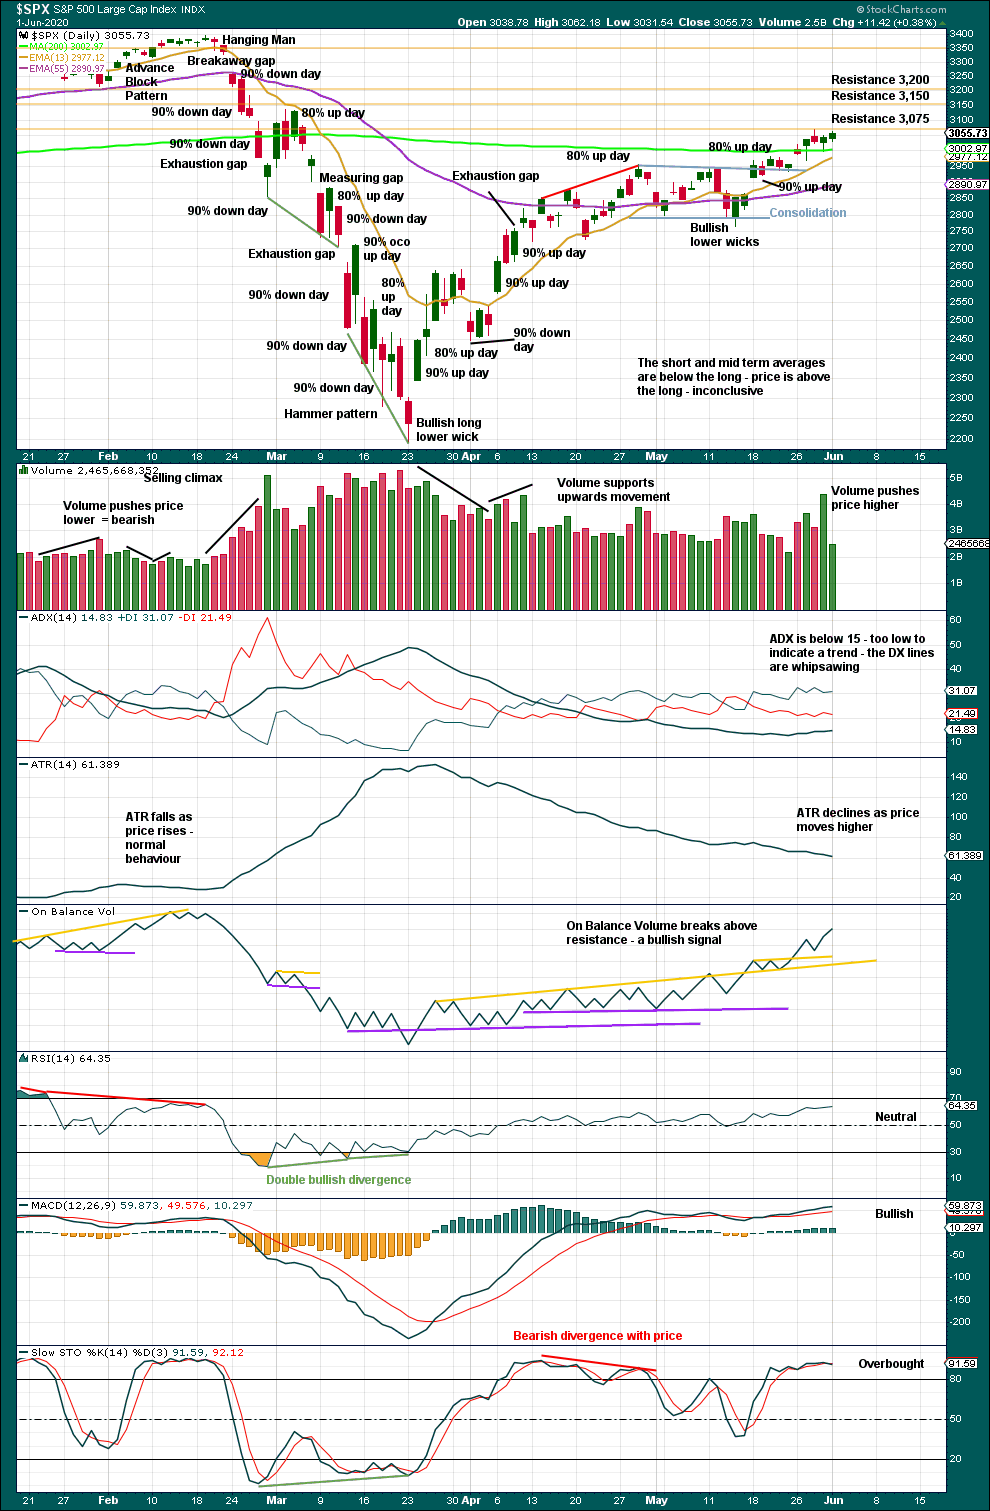
Click chart to enlarge. Chart courtesy of StockCharts.com.
In the bear market from October 2000 to March 2009, the first multi-day bounce retraced 0.73 of the first wave down. In the bear market from March 2000 to October 2002, the first multi-day bounce retraced 0.89 of the first wave down. So far this current bounce has retraced 0.73 of the first wave down, so it now seems reasonable to expect it to end here or very soon.
To see what signals may be looked for to identify a high, the two previous large bear markets were analysed in end of week analysis. The DotCom crash was analysed here with video here. The Global Financial Crisis was also analysed here with video here.
With a very strong decline in volume today, the short-term volume profile no longer suggests upwards movement immediately ahead. There is strong resistance here that price has not yet overcome.
The breakaway gap of 24th February has its upper edge at 3,328.45. A bearish analysis remains reasonable while this gap remains open. If this gap is closed, then a more bullish analysis that would expect new all time highs should then be considered.
BREADTH – AD LINE
WEEKLY CHART
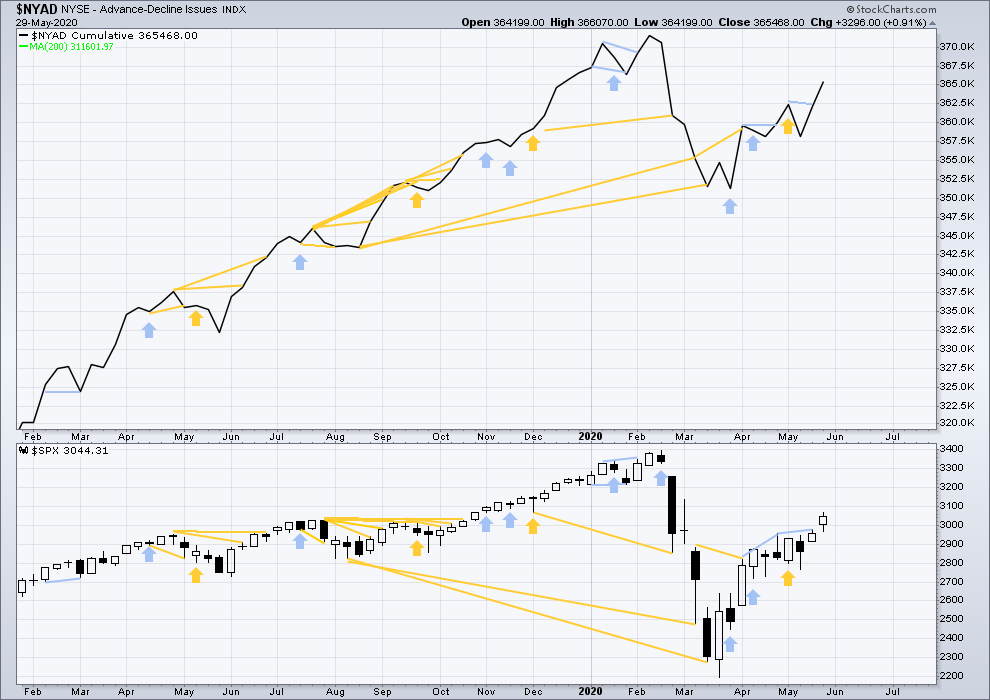
Click chart to enlarge. Chart courtesy of StockCharts.com. So that colour blind members are included, bearish signals will be noted with blue and bullish signals with yellow.
Breadth should be read as a leading indicator.
Last week both the AD line and price have moved higher. Upwards movement has support from rising market breadth. There is no new divergence.
Large caps all time high: 3,393.52 on 19th February 2020.
Mid caps all time high: 2,109.43 on 20th February 2020.
Small caps all time high: 1,100.58 on 27th August 2018.
DAILY CHART
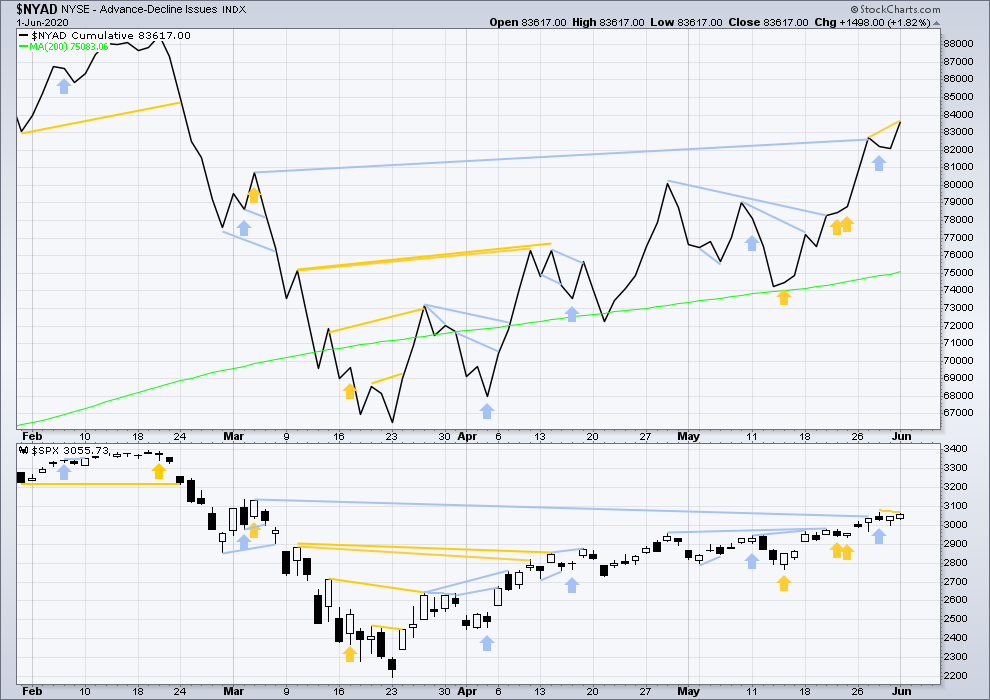
Click chart to enlarge. Chart courtesy of StockCharts.com. So that colour blind members are included, bearish signals will be noted with blue and bullish signals with yellow.
Today both price and the AD line have moved higher. The AD line has made a new short-term high, but price has not. This divergence is bullish and supports the first and third hourly charts.
VOLATILITY – INVERTED VIX CHART
WEEKLY CHART
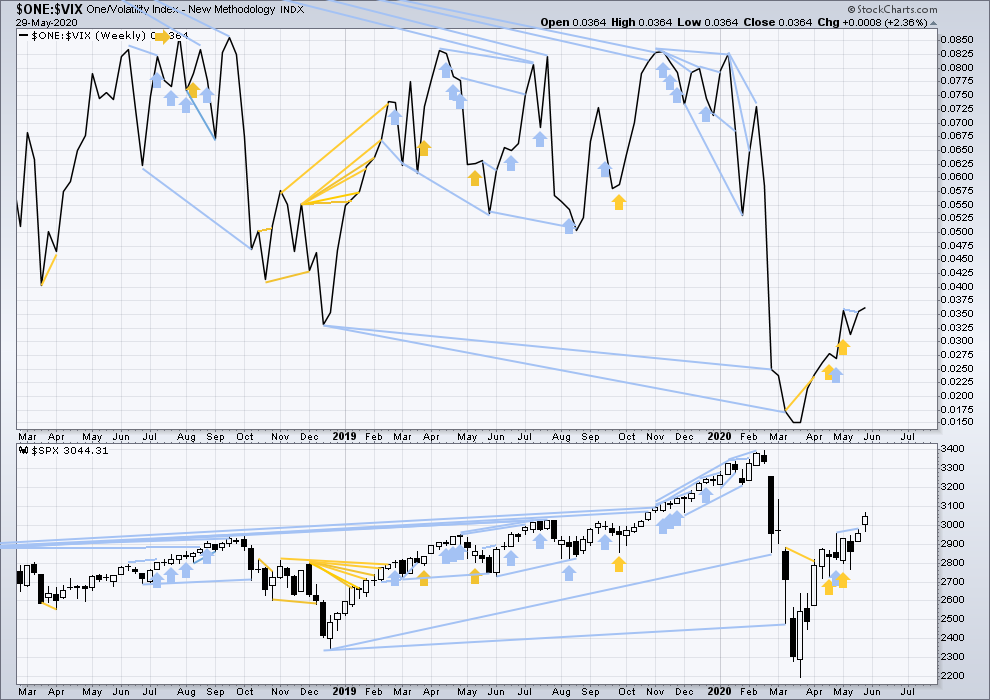
Click chart to enlarge. Chart courtesy of StockCharts.com. So that colour blind members are included, bearish signals will be noted with blue and bullish signals with yellow.
Last week both price and inverted VIX have moved higher. There is no new divergence.
DAILY CHART
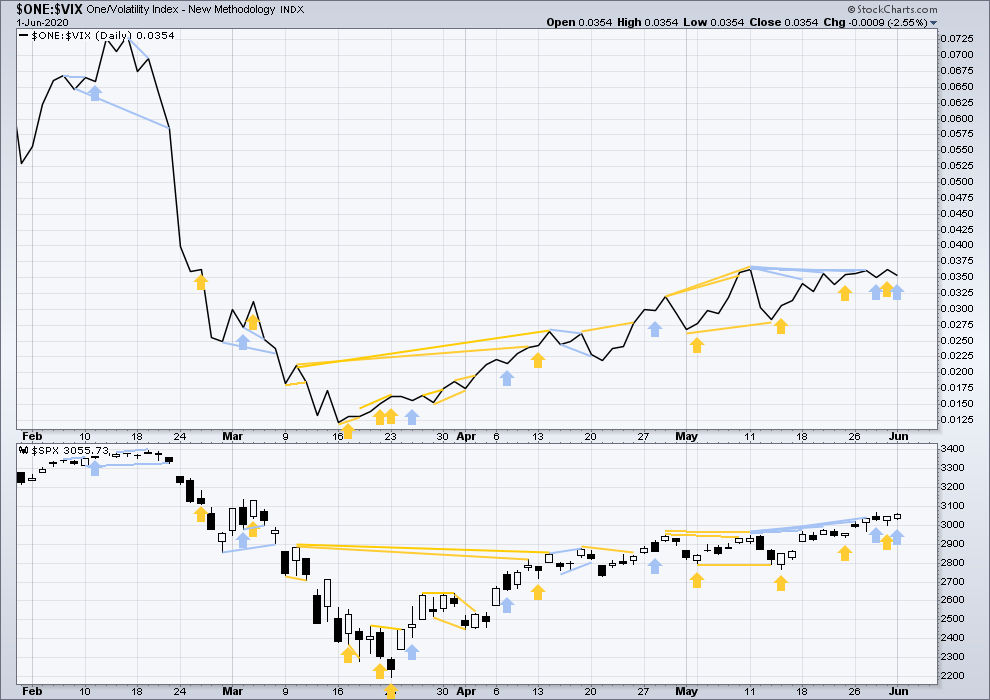
Click chart to enlarge. Chart courtesy of StockCharts.com. So that colour blind members are included, bearish signals will be noted with blue and bullish signals with yellow.
Bullish divergence noted in last analysis has been followed by an upwards day, so it may now be resolved.
Today price has moved higher, but inverted VIX has moved lower. Upward movement in price does not come with a normal corresponding decline in VIX. This divergence is bearish for the very short term.
DOW THEORY
Dow Theory has confirmed a bear market with the following lows made on a closing basis:
DJIA: 21,712.53 – a close below this point has been made on the March 12, 2020.
DJT: 8,636.79 – a close below this point has been made on March 9, 2020.
Adding in the S&P and Nasdaq for an extended Dow Theory, a bear market has now been confirmed:
S&P500: 2,346.58 – a close below this point has now been made on March 20, 2020.
Nasdaq: 7,292.22 – a close below this point was made on the March 12, 2020.
Published @ 08:00 p.m. EST.
—
Careful risk management protects your trading account(s).
Follow my two Golden Rules:
1. Always trade with stops.
2. Risk only 1-5% of equity on any one trade.
—
New updates to this analysis are in bold.