
S&P 500: Elliott Wave and Technical Analysis | Charts – April 3, 2020
Another small range day fits expectations for price to consolidate this week.
Summary: A correction may continue into next week. It may be shallow if it continues to find resistance at the lower edge of the multi-year channel. A target for it to end is about 2,651.
Thereafter, the downwards trend may resume with strength.
Alternatively, it is possible that the correction is over although this has a lower probability. This possibility is outlined in the second hourly chart below.
The biggest picture, Grand Super Cycle analysis, is here.
Last monthly charts are here. Video is here. Members are encouraged to view all three monthly charts. The third is much more bearish than this main wave count and remains a valid possibility.
ELLIOTT WAVE COUNTS
WEEKLY CHART
Click chart to enlarge.
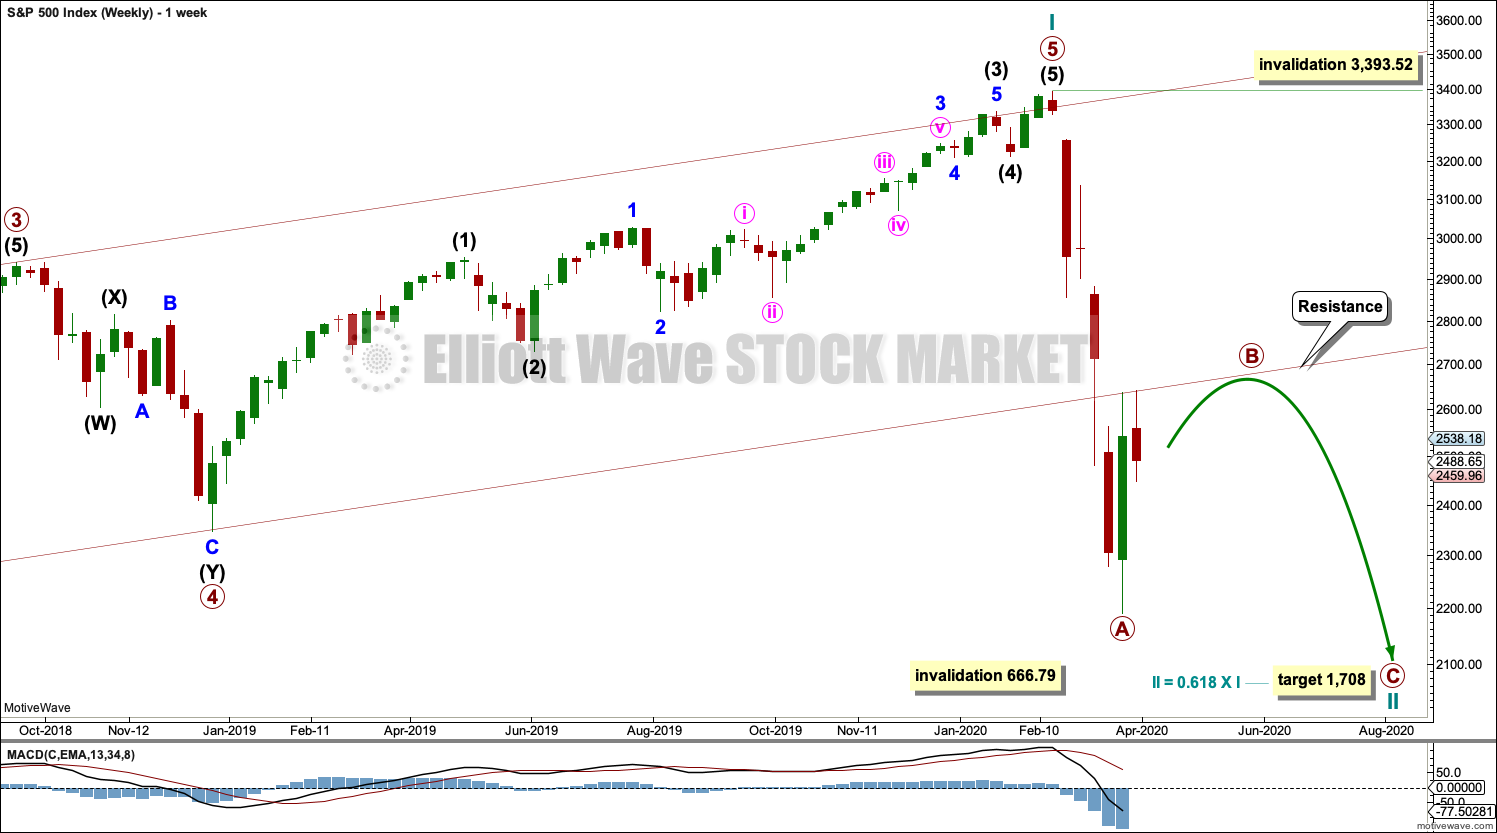
The channel is now breached by a full weekly candlestick below and not touching the lower edge. Further confidence in this wave count may be had. The lower edge of this channel is continuing so far to provide resistance.
Price is now below the 0.382 Fibonacci ratio of cycle wave I at 2,352. The structure of cycle wave II may need further to go to complete. The next Fibonacci ratio at 0.618 is now a preferred target for cycle wave II to end.
Cycle wave II would most likely subdivide as a zigzag; thus far that looks like what it is unfolding. When primary waves A and B may both be complete, then the target may be calculated using a Fibonacci ratio between primary waves A and C. At that stage, the final target may change or widen to a zone.
Cycle wave II may not move beyond the start of cycle wave I below 666.79.
DAILY CHART
Click chart to enlarge.
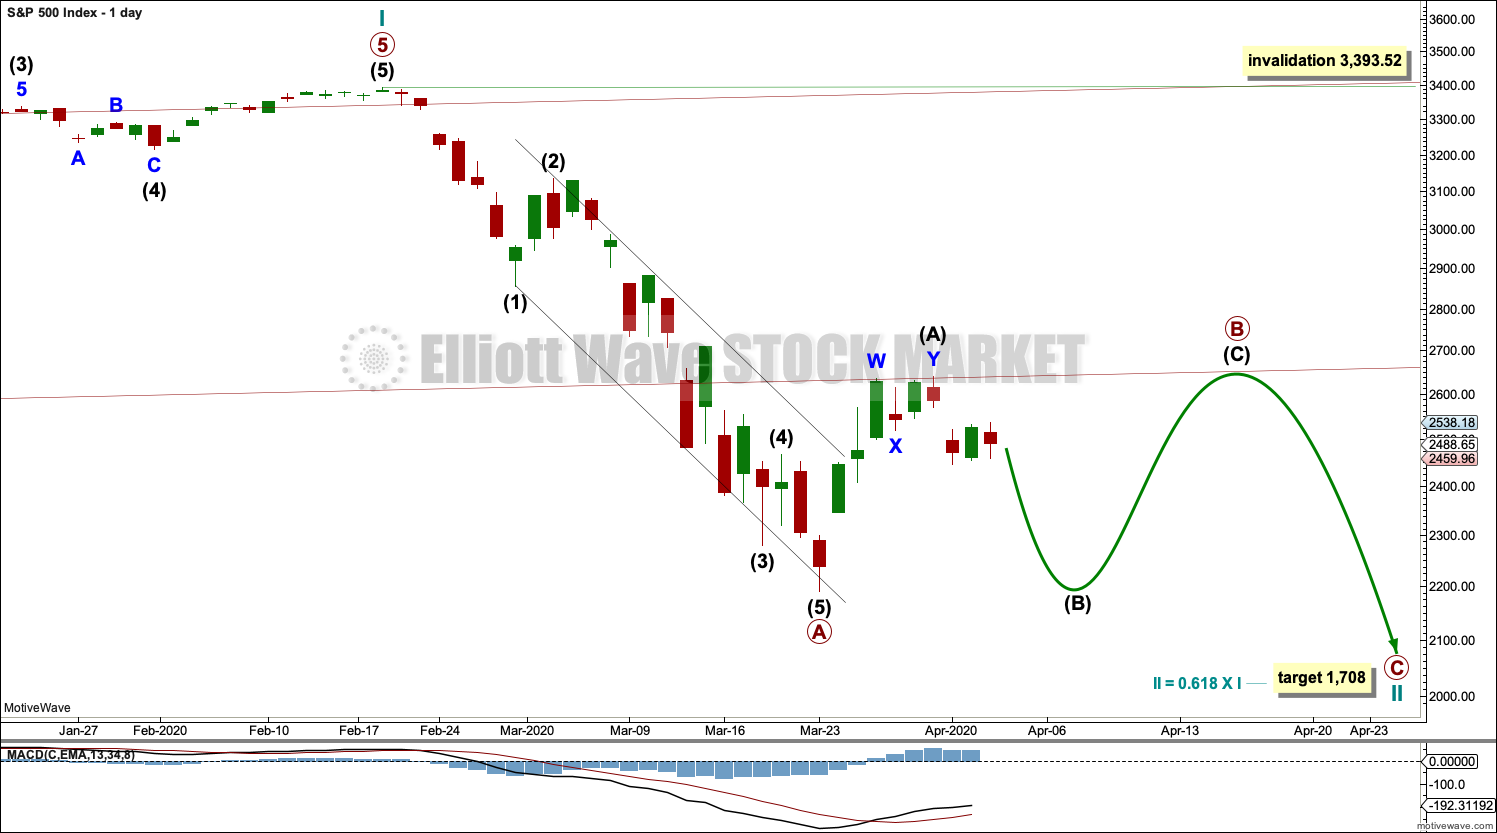
Draw the wide maroon trend channel carefully: draw the first trend line from the end of primary wave 1 at 2,093.55 (December 26, 2014), to the end of primary wave 3 at 2,940.91 (September 21, 2018), then place a parallel copy on the end of primary wave 2 at 1,810.10 (February 11, 2016). The channel is fully breached indicating a trend change from the multi-year bull trend to a new bear trend. The lower edge may now be an important line of resistance. If resistance at this line holds, then primary wave B may end close to the 0.382 Fibonacci ratio of primary wave A at 2,651.
Cycle wave II may subdivide as any Elliott wave corrective structure except a triangle. It would most likely be a zigzag. Primary wave A may be a complete five wave impulse. Primary wave B may not move beyond the start of primary wave A above 3,393.52.
HOURLY CHART – FLAT
Click chart to enlarge.
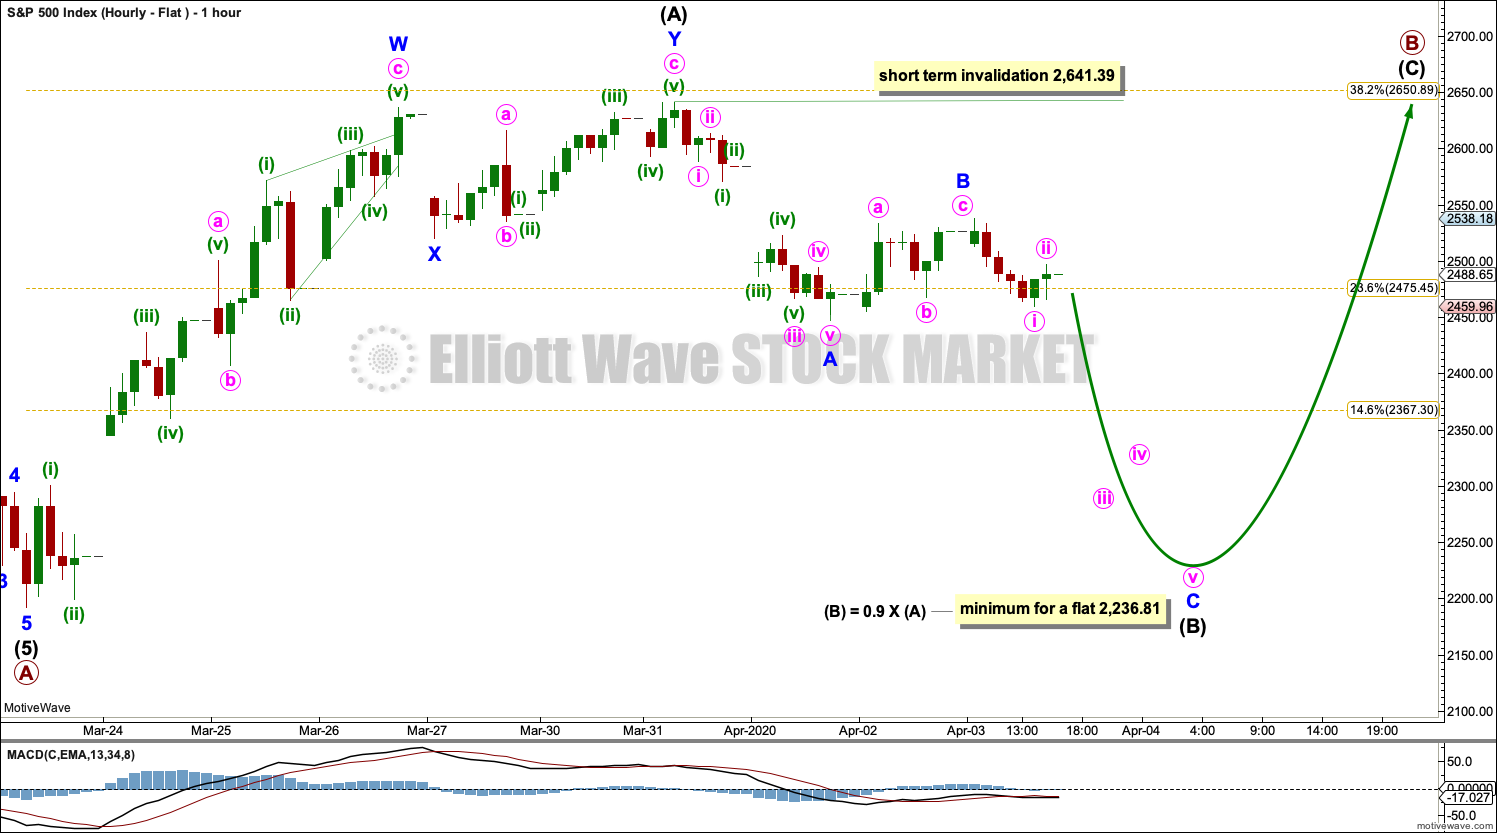
At this stage, it would be clearer to provide separate charts for the various possible structures that primary wave B may be unfolding as.
This first chart considers the possibility that primary wave B may be continuing sideways as a flat correction.
Within a flat correction, intermediate wave (A) must subdivide as a three, a corrective structure. Intermediate wave (A) may be a complete double zigzag.
Within a flat correction, intermediate wave (B) must retrace a minimum 0.9 length of intermediate wave (A) at 2,236.81. Intermediate wave (B) may make a new low below the start of intermediate wave (A) as in an expanded flat. Intermediate wave (B) may be subdividing as a zigzag. There is no lower invalidation point for this wave count.
HOURLY CHART – TRIANGLE
Click chart to enlarge.
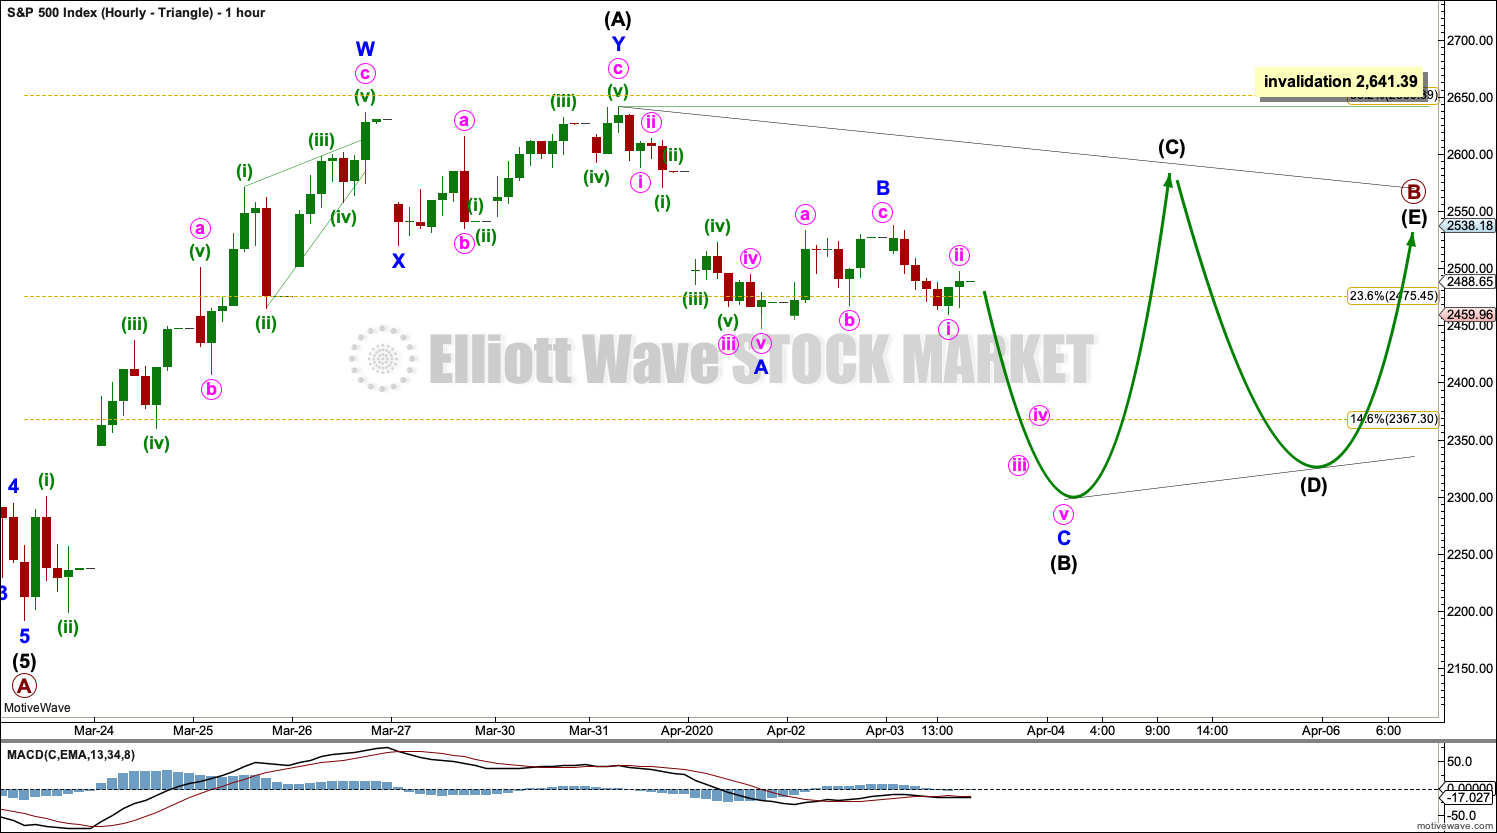
Primary wave B may be subdividing as a triangle.
Within a triangle, four of the five sub-waves must subdivide as zigzags or multiple zigzags, with only one sub-wave being a multiple. Intermediate wave (A) may be complete as a double zigzag.
Three of the four remaining sub-waves must subdivide as single zigzags.
Intermediate wave (B) may be subdividing as a zigzag. Within intermediate wave (B), minor wave B may not move beyond the start of minor wave A above 2,641.39.
Intermediate wave (B) may make a new low below the start of intermediate wave (A) as in a running triangle. There is no lower invalidation point for this wave count.
HOURLY CHART – COMBINATION

Click chart to enlarge.
It is also possible that primary wave B may be subdividing as a double combination. The first structure in a double may now be a complete zigzag labelled intermediate wave (W). The double may be joined by a complete three in the opposite direction, a flat correction labelled intermediate wave (X).
The second structure in a double may have begun and may be subdividing as a flat correction labelled intermediate wave (Y). Within the flat correction of intermediate wave (Y), minor waves A and B both subdivide as threes. Minor wave B may make a new low below the start of minor wave A at 2,447.49 as in an expanded flat.
Thereafter, minor wave C may end at least slightly above the end of minor wave A at 2,538.18 to avoid a truncation. Intermediate wave (Y) would most likely end about the same level as intermediate wave (W) at 2,637.01, so that the whole structure takes up time and moves price sideways.
HOURLY CHART – ZIGZAG
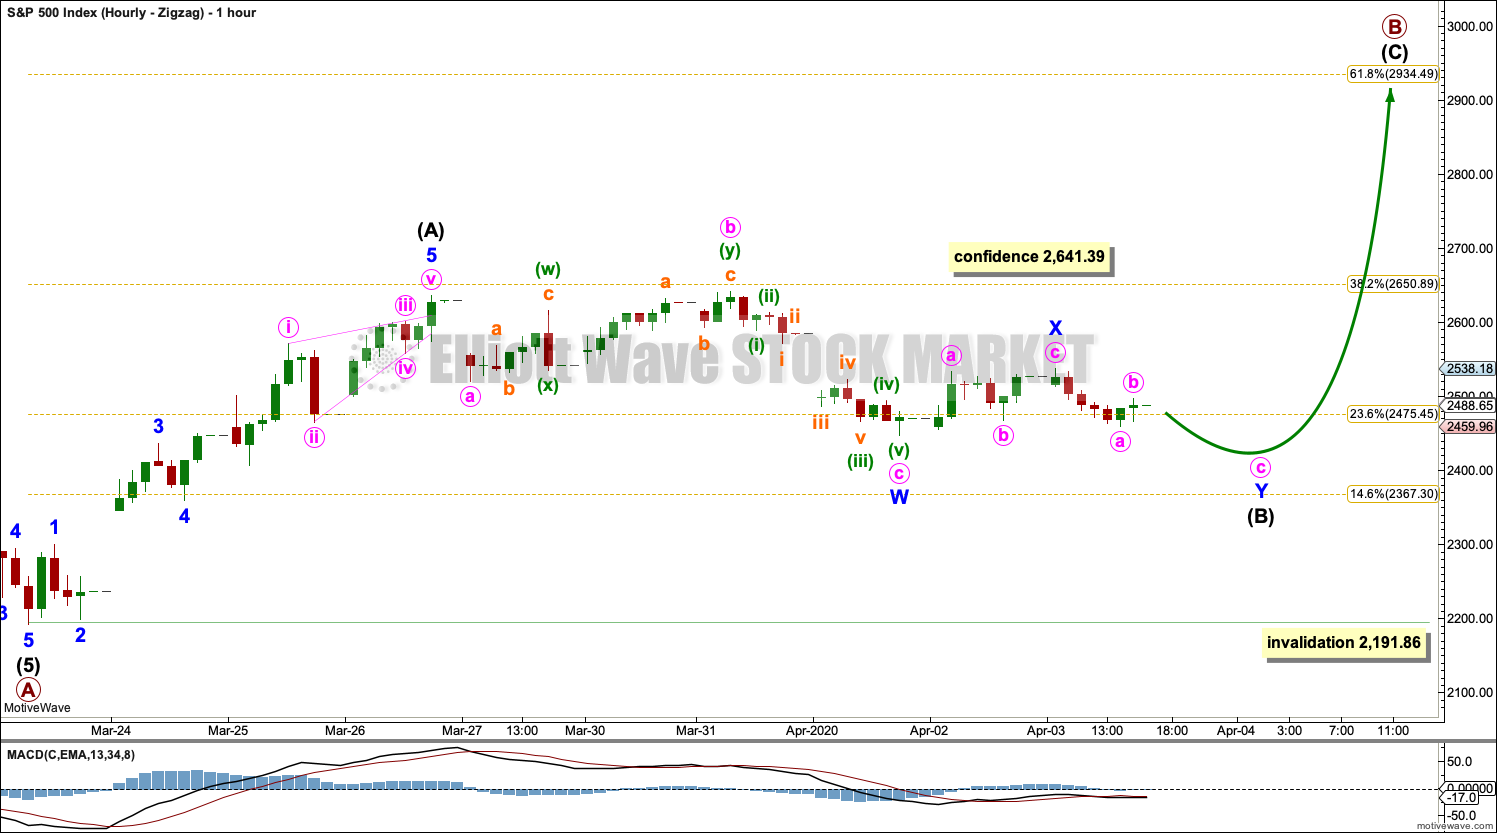
Click chart to enlarge.
It is also possible that primary wave B may subdivide as a zigzag. Within the zigzag, intermediate wave (A) may be a complete impulse.
Intermediate wave (B) may be continuing sideways as a double combination: flat – X – zigzag. Intermediate wave (B) may not move beyond the start of intermediate wave (A) below 2,191.86.
This wave count would require resistance at the lower edge of the multi-year trend channel to be breached. For this reason it has a lower probability. Assume resistance at that trend line is likely to hold. If it is breached, then this wave count would increase in probability and may become the main hourly wave count.
SECOND HOURLY CHART
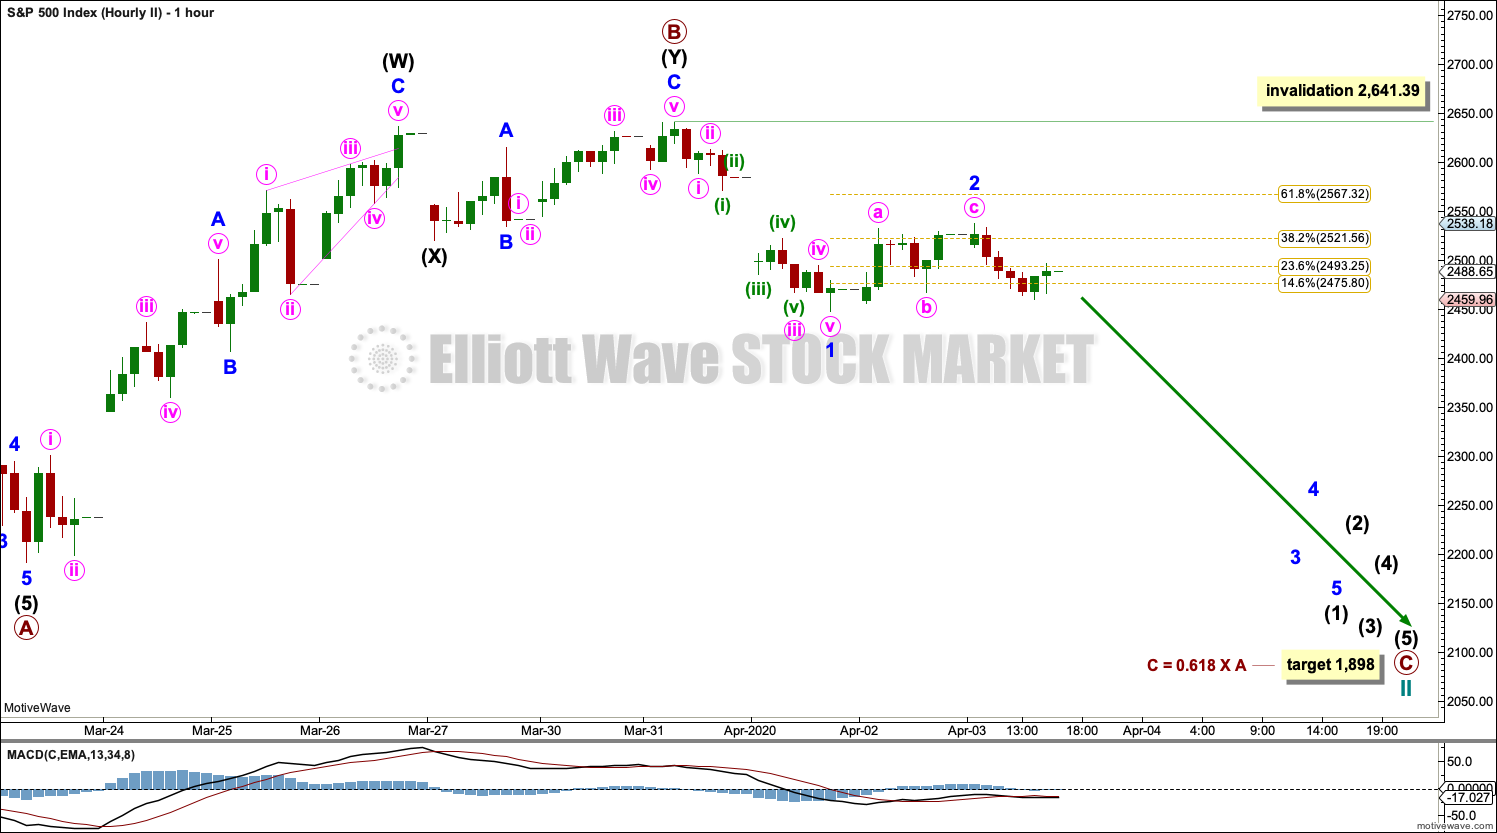
Click chart to enlarge.
By moving the degree of labelling within primary wave B up one, it is possible that it could be over as a brief and shallow double zigzag.
The brevity of this wave count reduces the probability.
A new target is calculated for primary wave C to end.
ALTERNATE DAILY CHART
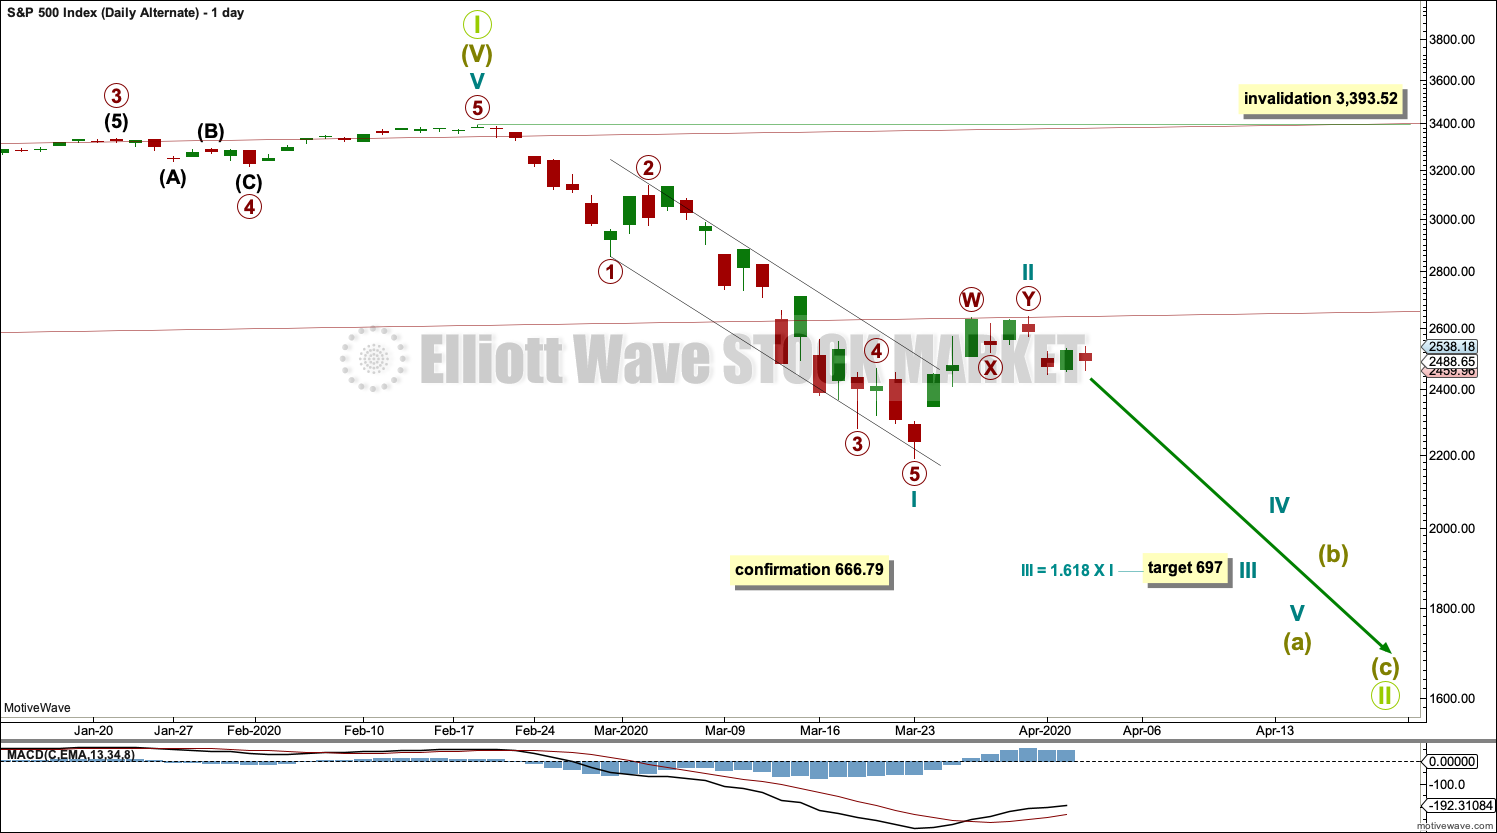
Click chart to enlarge.
This alternate daily chart follows the Second Alternate Monthly chart published here. Video is here.
By simply moving the degree of labelling in the bull market beginning March 2009 up one degree, it is possible that a Grand Super Cycle trend change occurred on the February 19, 2020.
A correction at Grand Super Cycle degree may be expected to last at least a decade, possibly longer. Corrections for this market tend to be much quicker than bullish moves, and so a fair amount of flexibility is required in expectations for duration of the different degrees.
Grand Super Cycle II would most likely subdivide as a zigzag, although it may be any corrective structure except a triangle. It should begin with a five down at the weekly chart time frame, which would be incomplete.
The first five down on the daily chart is labelled cycle wave I. If this degree of labelling is wrong, it may be too high; it may need to be moved down one degree.
Following cycle wave I, cycle wave II may be complete as a relatively brief and shallow double zigzag. If it continues further as a flat correction, then cycle wave II may not move beyond the start of cycle wave I above 3,393.52.
A target is calculated for cycle wave III to end based upon a common Fibonacci ratio to cycle wave I.
ALTERNATE HOURLY CHART
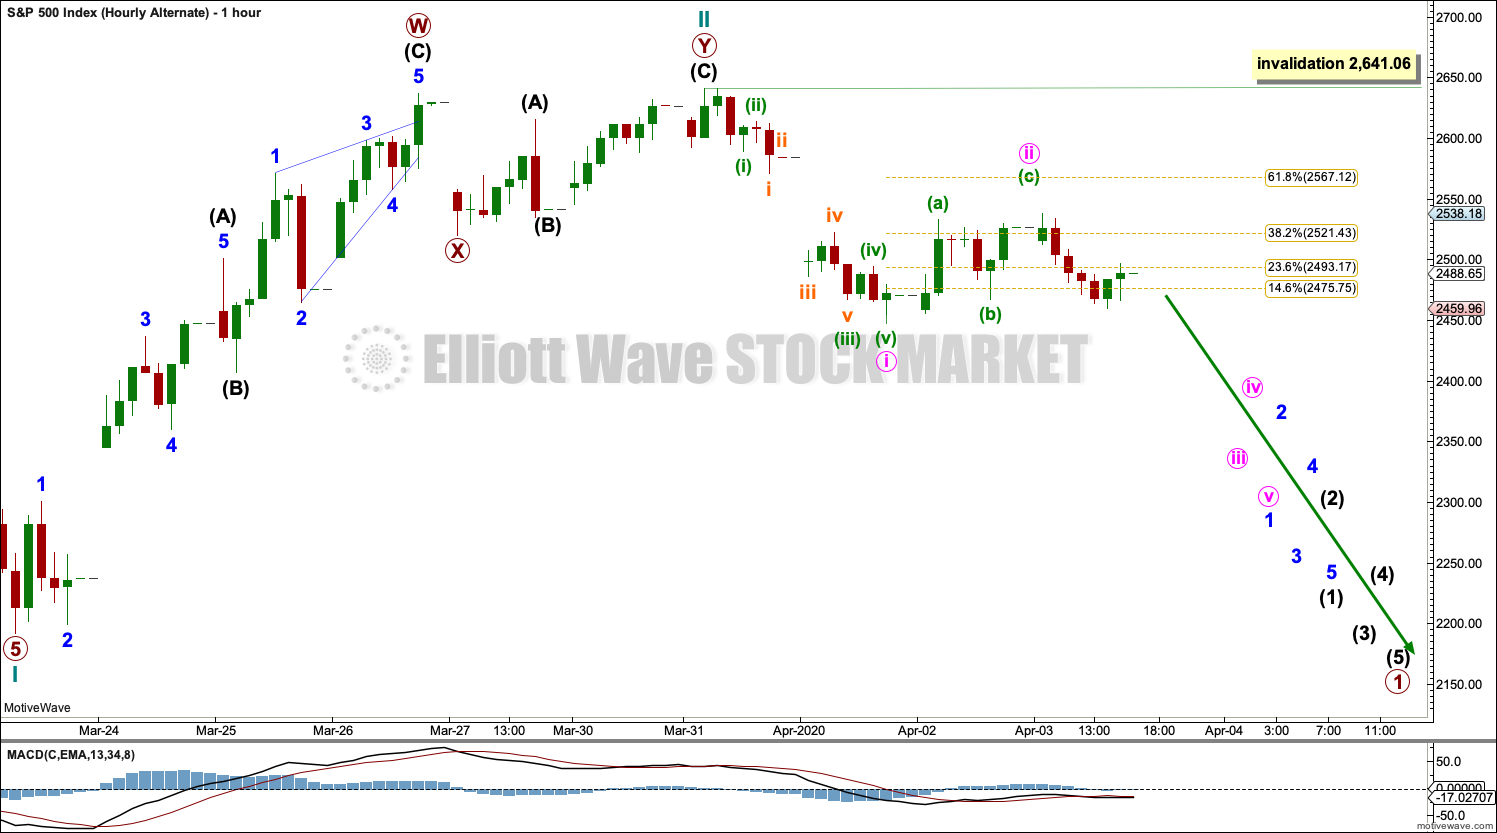
Click chart to enlarge.
Cycle wave II may be a completed double zigzag. Cycle wave III may have begun. Within cycle wave III, no second wave correction may move beyond its start above 2,641.06.
TECHNICAL ANALYSIS
MONTHLY CHART
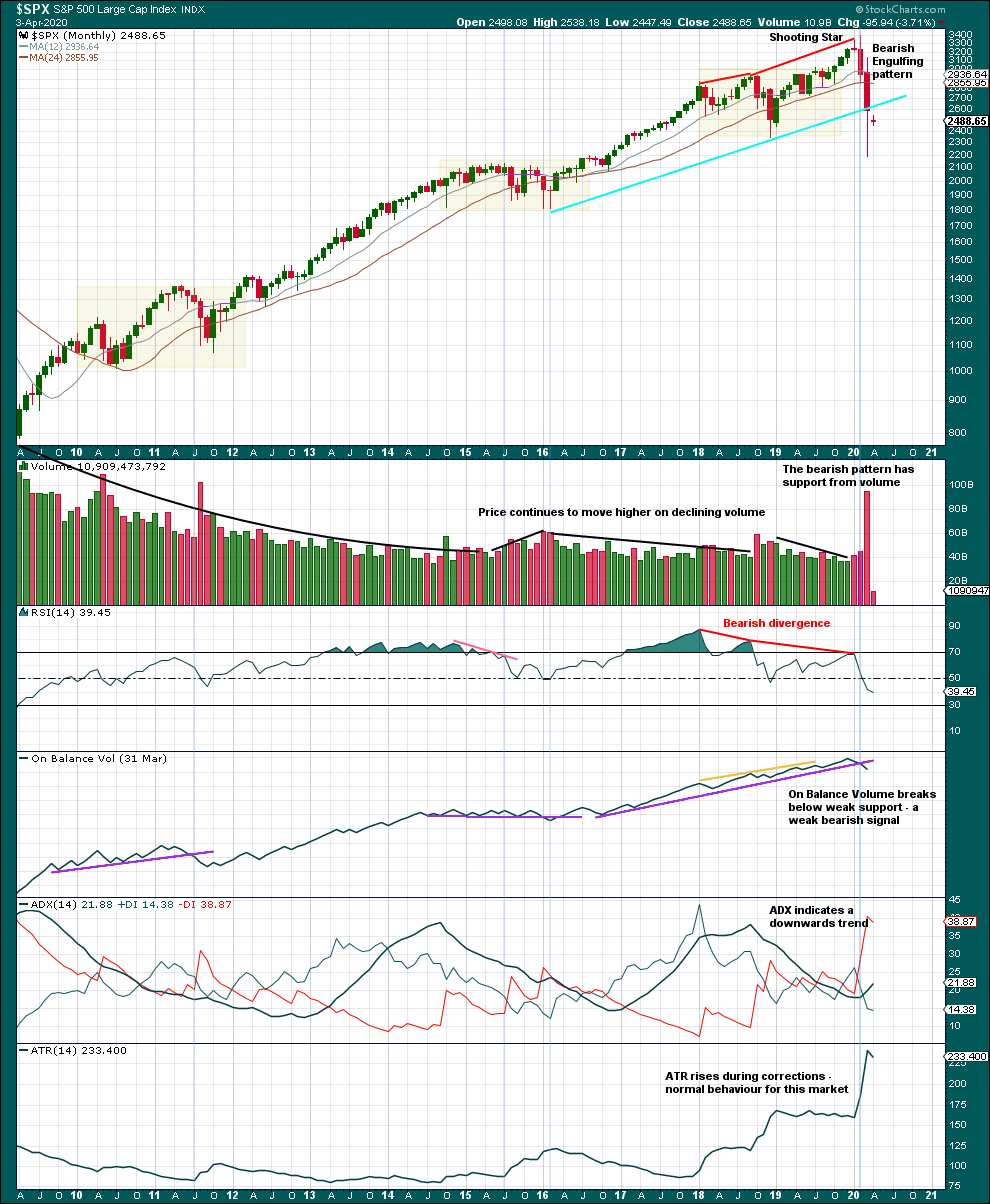
Click chart to enlarge. Chart courtesy of StockCharts.com.
Volume for March 2020 is the highest since August 2011.
With declining volume overall since the beginning of the bull market in March 2009, support below here may be thin and weak. This may allow price to fall faster. The breach of the blue trend line is significant. The long lower wick for the candlestick of March 2020 is bullish, so look for a bounce.
WEEKLY CHART
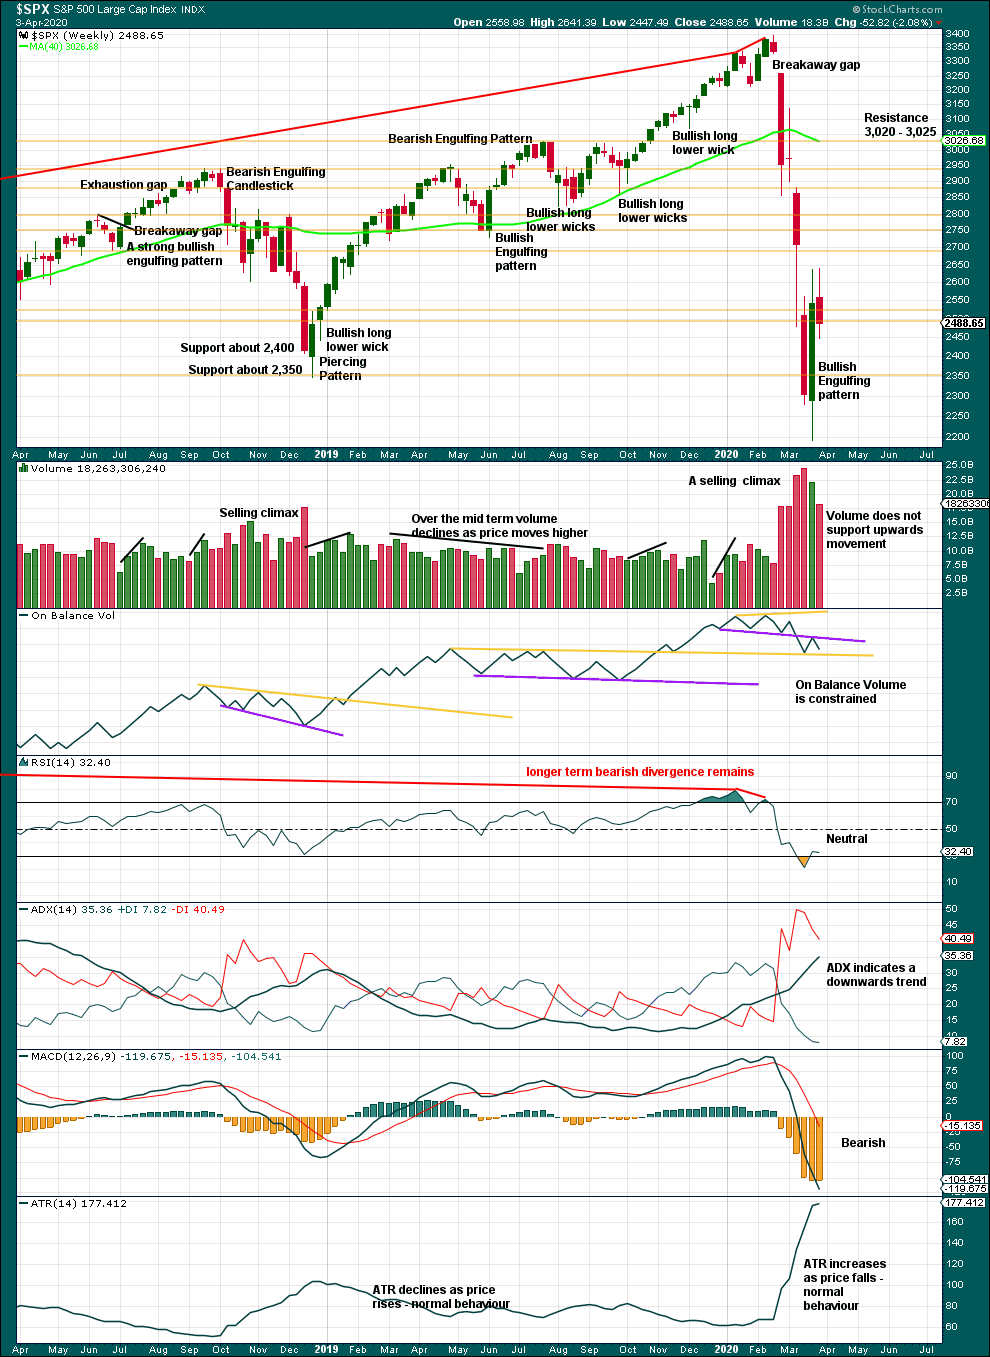
Click chart to enlarge. Chart courtesy of StockCharts.com.
The bounce has relieved RSI somewhat. ADX is still not extreme; there is room for this trend to continue. Watch On Balance Volume carefully for a breakout.
DAILY CHART
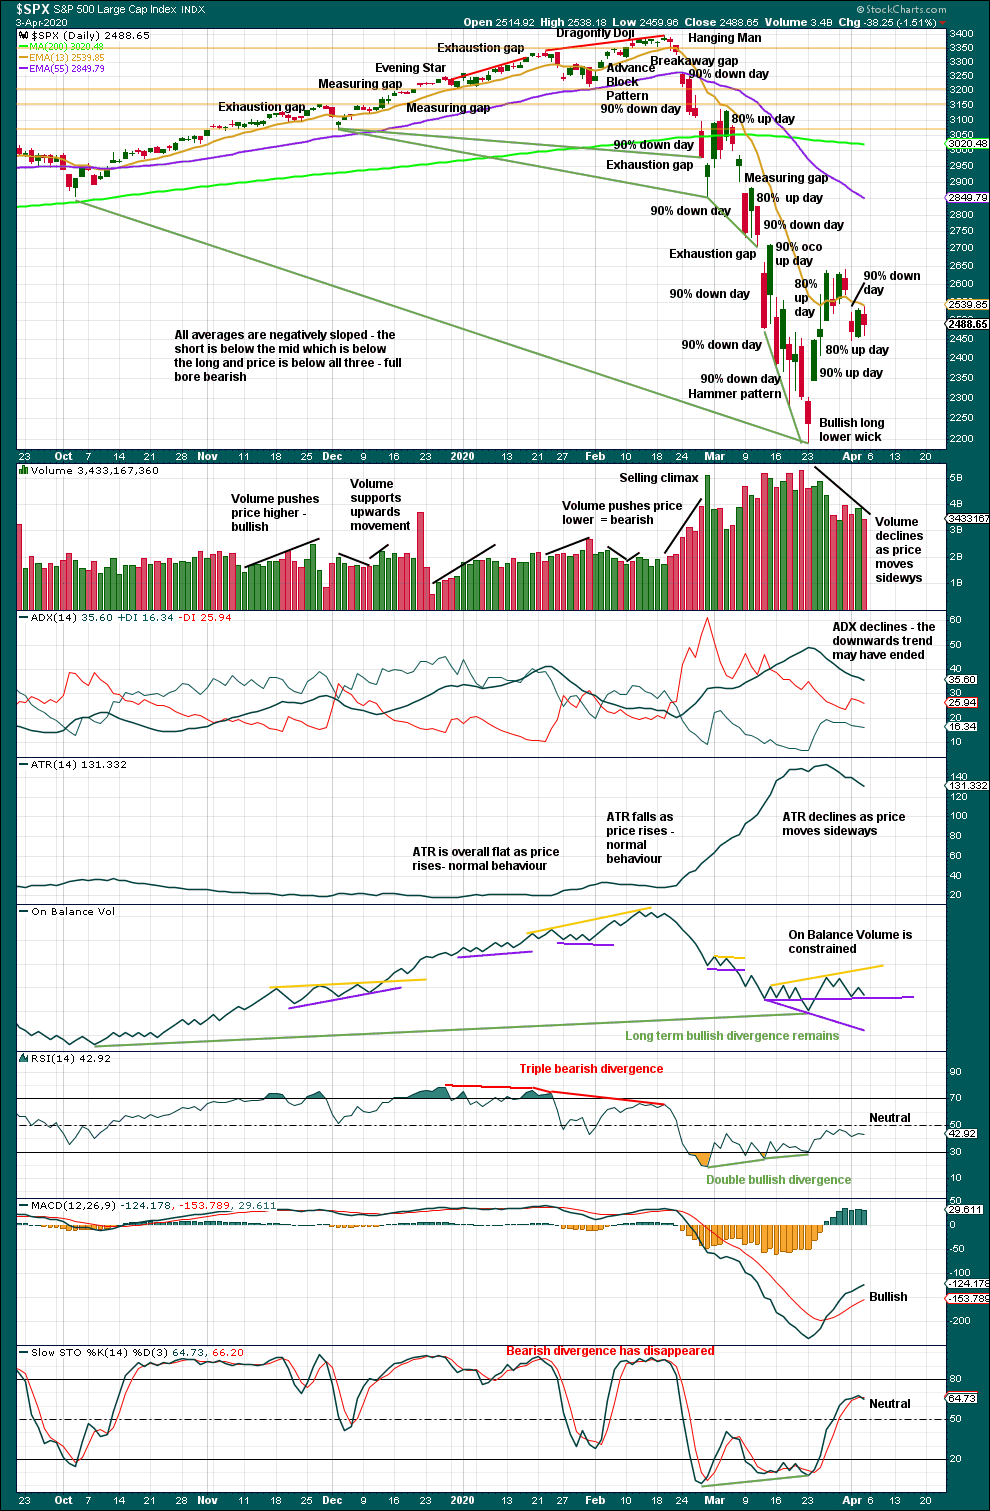
Click chart to enlarge. Chart courtesy of StockCharts.com.
Another 90% downwards day today indicates it is most likely that the bear market is incomplete. It would be highly unusual to see a 90% downwards day so close to a sustainable low.
Volume and range overall continue to decline. So far this movement this week looks like a pause within an ongoing downwards trend.
To see what signals may be looked for to identify a high, the two previous large bear markets will be analysed in end of week analysis. The DotCom crash was analysed last week here with video here.
BREADTH – AD LINE
WEEKLY CHART
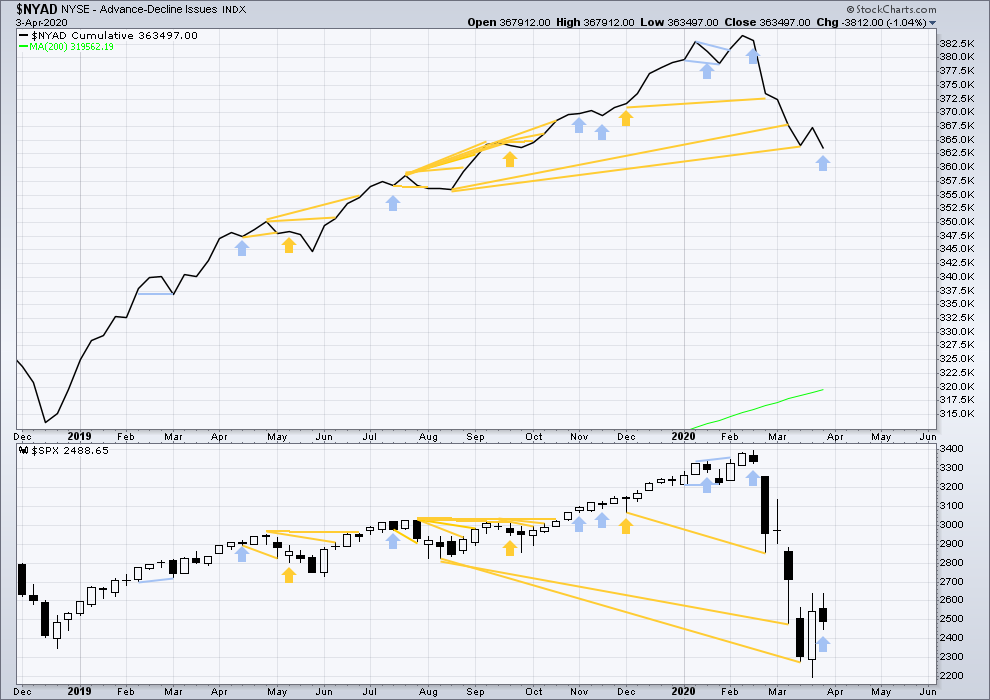
Click chart to enlarge. Chart courtesy of StockCharts.com. So that colour blind members are included, bearish signals will be noted with blue and bullish signals with yellow.
Bear markets from the Great Depression and onwards have been preceded by an average minimum of 4 months divergence between price and the AD line with only two exceptions in 1946 and 1976. With no divergence between the AD line and price at the last all time high, this current bear market now makes a third exception.
In all bear markets in the last 90 years there is some positive correlation (0.6022) between the length of bearish divergence and the depth of the following bear market. No to little divergence is correlated with more shallow bear markets. Longer divergence is correlated with deeper bear markets.
This bear market comes after no bearish divergence. It would more likely be shallow, but this is a statement of probability and not certainty. So far it is slightly more than the 0.382 Fibonacci ratio of the bull market it is correcting (beginning March 2009).
This week price has moved higher although the candlestick has closed red. The AD line has declined. This divergence is bearish for the short term.
Large caps all time high: 3,393.52 on 19th February 2020.
Mid caps all time high: 2,109.43 on 20th February 2020.
Small caps all time high: 1,100.58 on 27th August 2018.
DAILY CHART
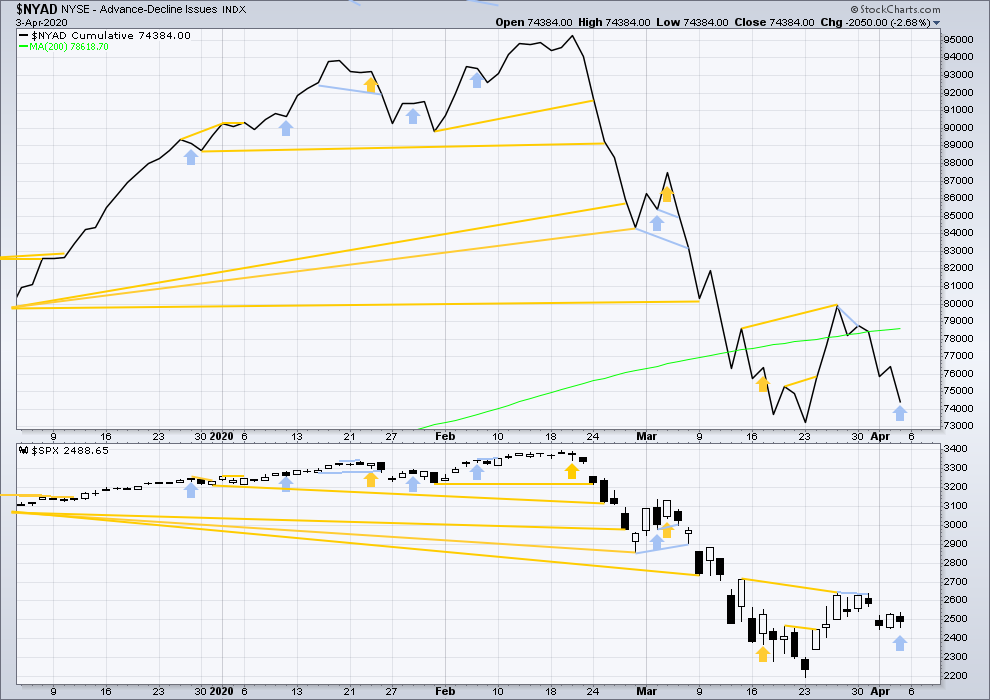
Click chart to enlarge. Chart courtesy of StockCharts.com. So that colour blind members are included, bearish signals will be noted with blue and bullish signals with yellow.
Breadth should be read as a leading indicator.
On Friday price has moved higher although the candlestick has closed red. The AD line has declined. This divergence is bearish for the short term.
VOLATILITY – INVERTED VIX CHART
WEEKLY CHART
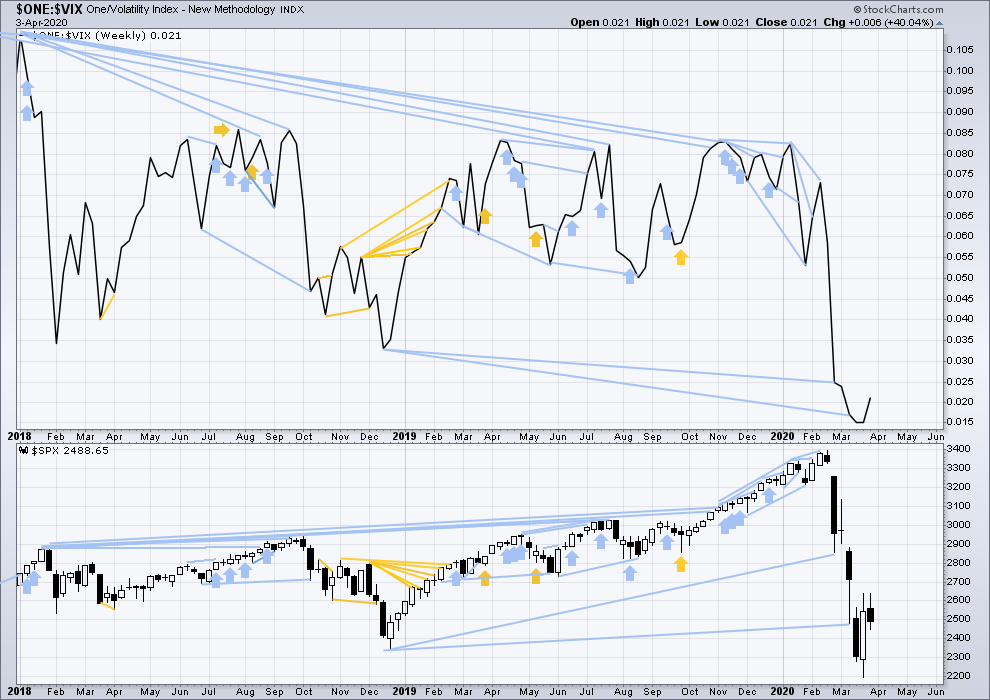
Click chart to enlarge. Chart courtesy of StockCharts.com. So that colour blind members are included, bearish signals will be noted with blue and bullish signals with yellow.
This week both price and inverted VIX have moved higher. There is no new short term divergence.
DAILY CHART
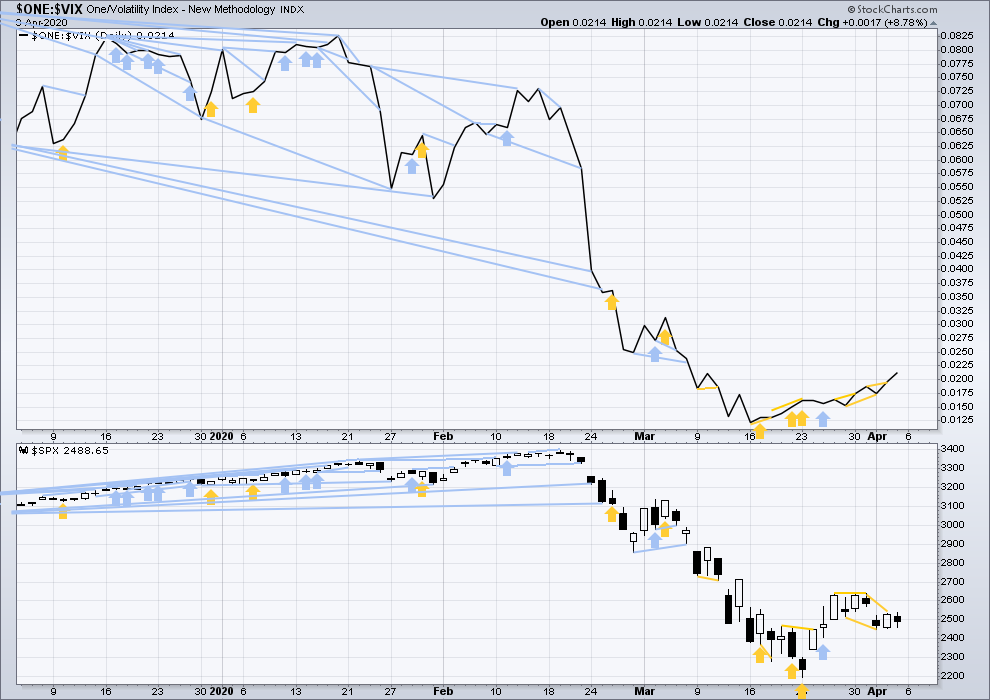
Click chart to enlarge. Chart courtesy of StockCharts.com. So that colour blind members are included, bearish signals will be noted with blue and bullish signals with yellow.
Today both price and inverted VIX have moved higher. There is no new short-term divergence.
DOW THEORY
Dow Theory has confirmed a bear market with the following lows made on a closing basis:
DJIA: 21,712.53 – a close below this point has been made on the March 12, 2020.
DJT: 8,636.79 – a close below this point has been made on March 9, 2020.
Adding in the S&P and Nasdaq for an extended Dow Theory, a bear market has now been confirmed:
S&P500: 2,346.58 – a close below this point has now been made on March 20, 2020.
Nasdaq: 7,292.22 – a close below this point was made on the March 12, 2020.
ANALYSIS OF CORRECTIONS WITHIN BEAR MARKETS
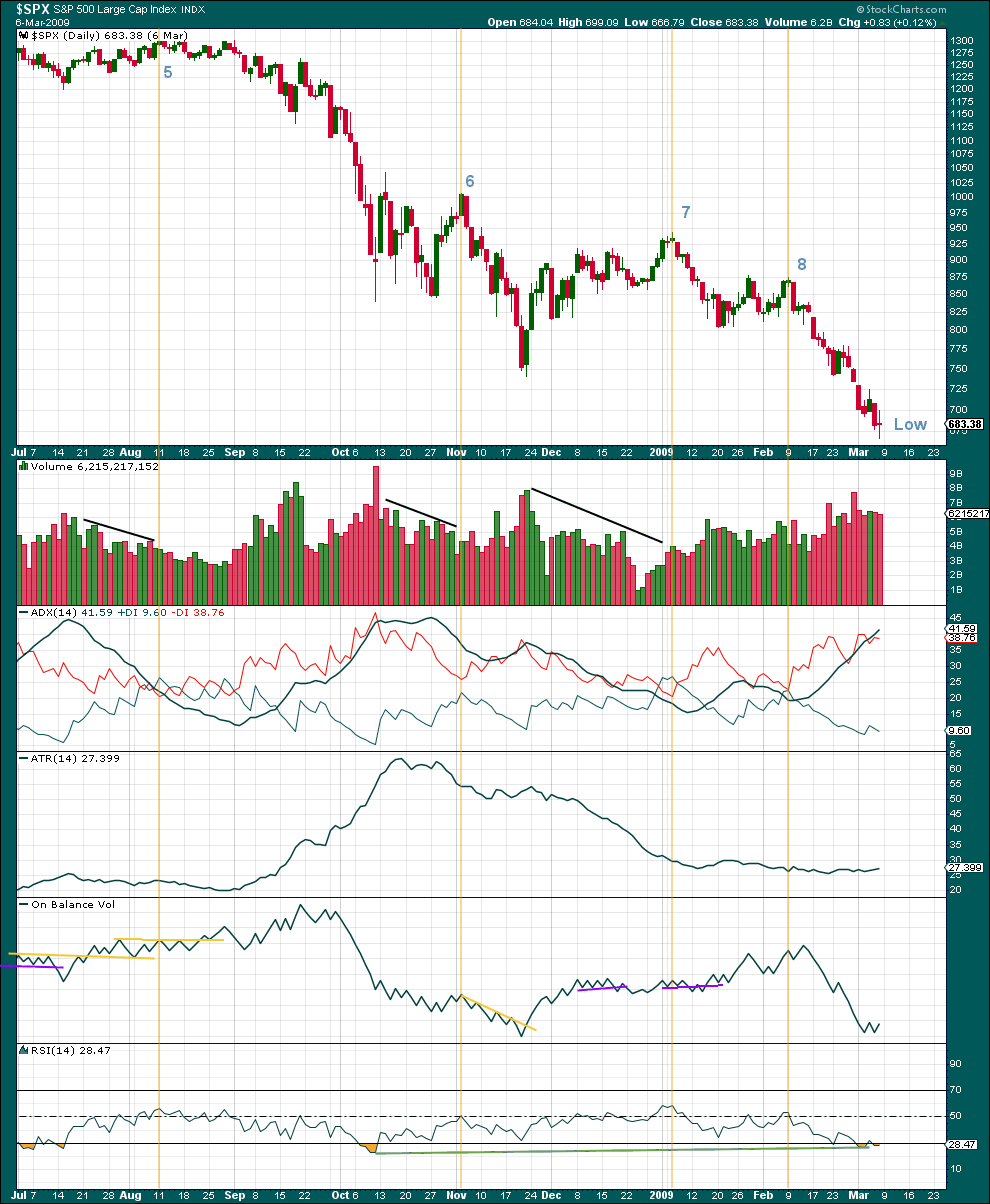
SECOND HISTORICAL EXAMPLE: GLOBAL FINANCIAL CRISIS: OCTOBER 2007 – MARCH 2009
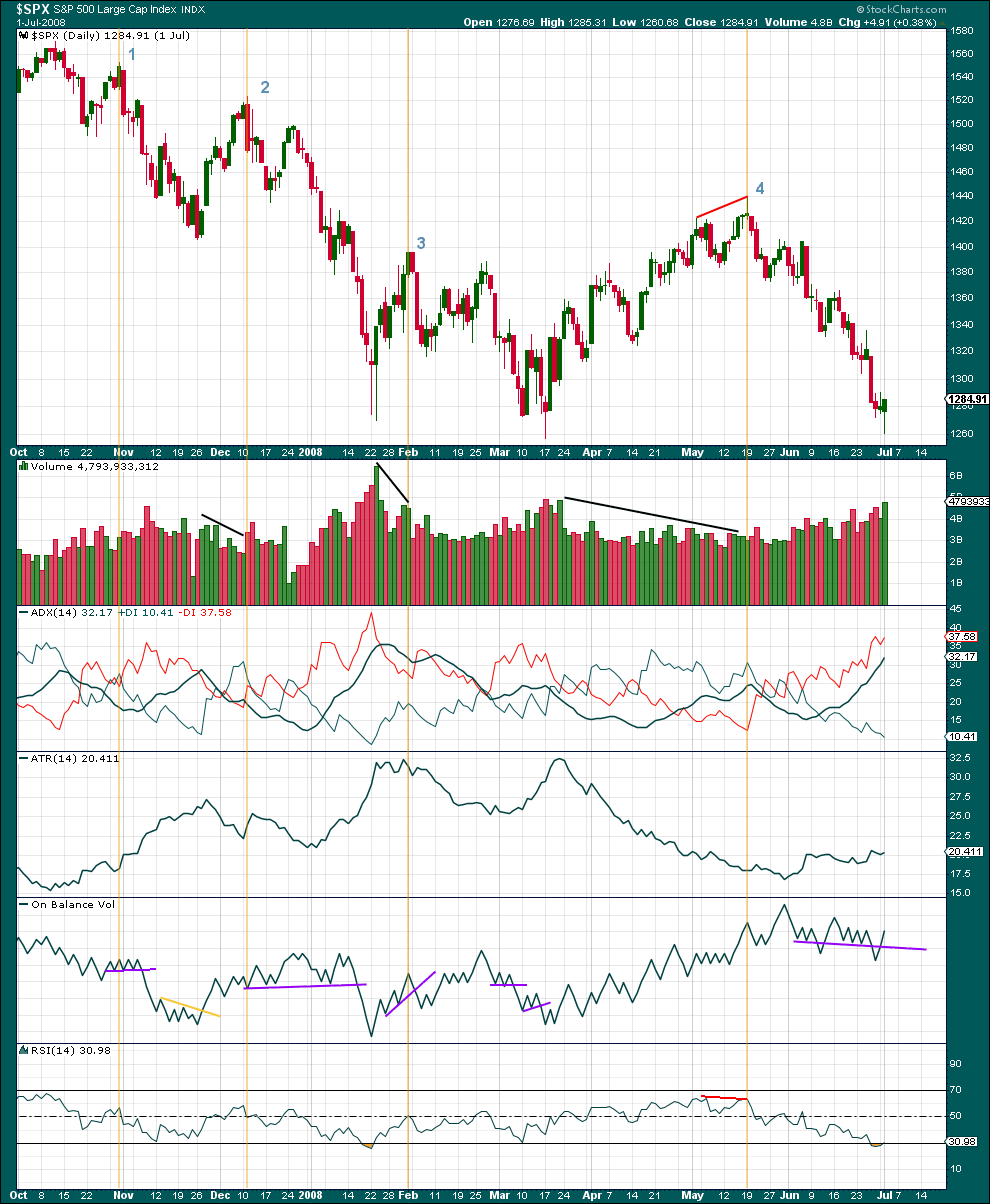
Click chart to enlarge. Chart courtesy of StockCharts.com.
This first chart looks at the first half of the Global Financial Crisis. Several bounces are noted. Each is analysed below:
1. Ended October 31, 2007. The bounce lasted 5 days. A Bearish Engulfing candlestick at the end, which had support from volume; volume declined throughout; ADX declined throughout; ATR declined throughout; On Balance Volume confirmed highs at the end; RSI exhibited no divergence at the high and did not reach overbought.
2. Ended December 11, 2007. The bounce lasted 11 days. A Bearish Engulfing candlestick at the end; volume declined throughout; ADX indicated an upwards trend at the end; ATR was overall flat; On Balance Volume confirmed highs at the end; RSI exhibited no divergence at the high and did not reach overbought.
3. Ended February 1, 2008. The bounce lasted 7 days. A Dark Cloud Cover candlestick at the end did not have support from volume; volume overall declined throughout but showed short-term increase on the final upwards days; ADX declined throughout; ATR was overall flat; On Balance Volume confirmed highs at the end; RSI exhibited no divergence at the high and did not reach overbought.
4. Ended May 19, 2008. The bounce lasted 44 days. An Evening Doji Star candlestick at the end had a little support from volume; volume declined throughout; ADX indicated an upwards trend for much of the bounce; ATR declined; On Balance Volume confirmed highs at the end; RSI exhibited short-term bearish divergence at the high and did not reach overbought.
Click chart to enlarge. Chart courtesy of StockCharts.com.
5. Ended August 11, 2008. The bounce lasted 19 days. A weak Bearish Engulfing candlestick at the end did not have support from volume; volume declined throughout; ADX declined throughout; ATR was overall flat; On Balance Volume was flat at the end; RSI exhibited no divergence at the high and did not reach overbought.
6. Ended November 4, 2008. The sideways consolidation lasted 17 days. A Bearish Engulfing candlestick at the end had a very little support from volume; volume declined throughout; ADX declined; ATR declined; On Balance Volume confirmed the final high; RSI exhibited no divergence at the high and did not reach overbought.
7. Ended January 6, 2009. The bounce lasted 29 days. A Evening Star candlestick at the end did not have support from volume; volume declined throughout but showed short-term increase at the end; ADX declined; ATR declined; On Balance Volume was overall flat at final highs; RSI exhibited no divergence at the high and did not reach overbought.
8. Ended February 9, 2009. The sideways consolidation lasted 13 days. A Evening Star candlestick at the end had strong support from volume; volume was overall flat but showed a strong decline in the last two days; ADX declined; ATR declined; On Balance Volume confirmed final highs; RSI exhibited no divergence at the high and did not reach overbought.
Summary:
Major bounces may last at least 5 days or as much as 2 months. At the end of every bounce: There was a bearish candlestick pattern (although within bounces were several bearish reversal patterns that may have given false signals of a more sustainable high in place); ATR was flat or more often declined throughout; On Balance Volume most often confirmed highs at the end except for two examples where it was flat; RSI exhibited bearish divergence only once and did not reach overbought for any corrections.
Conclusion:
The presence of a bearish candlestick pattern should be looked for.
Expect ATR to decline throughout as very likely.
On Balance Volume may confirm new highs at the end of a bounce.
RSI may not exhibit bearish divergence at the end of a bounce.
Published @ 10:20 p.m. EST.
—
Careful risk management protects your trading account(s).
Follow my two Golden Rules:
1. Always trade with stops.
2. Risk only 1-5% of equity on any one trade.
—
New updates to this analysis are in bold.