
Downwards movement ended the week, which is what the main Elliott wave count had expected.
Summary: It may be safest to assume the downwards trend remains intact while price remains below 2,466.97. The short-term target remains at 2,173.
However, at the last low there is a Hammer reversal pattern that comes while RSI exhibits triple bullish divergence, On Balance Volume has not confirmed new lows, and ADX is now very extreme. Conditions are now set for a strong bounce. Be aware this market is vulnerable to large whipsaws.
A breach of the downwards sloping channel on the daily chart would strongly indicate a multi-day to multi-week bounce may have arrived. A new high above 2,466.97 would provide further confidence.
The final target is now at 1,708.
The biggest picture, Grand Super Cycle analysis, is here.
ELLIOTT WAVE COUNTS
MAIN WAVE COUNT
MONTHLY CHART
Click chart to enlarge.
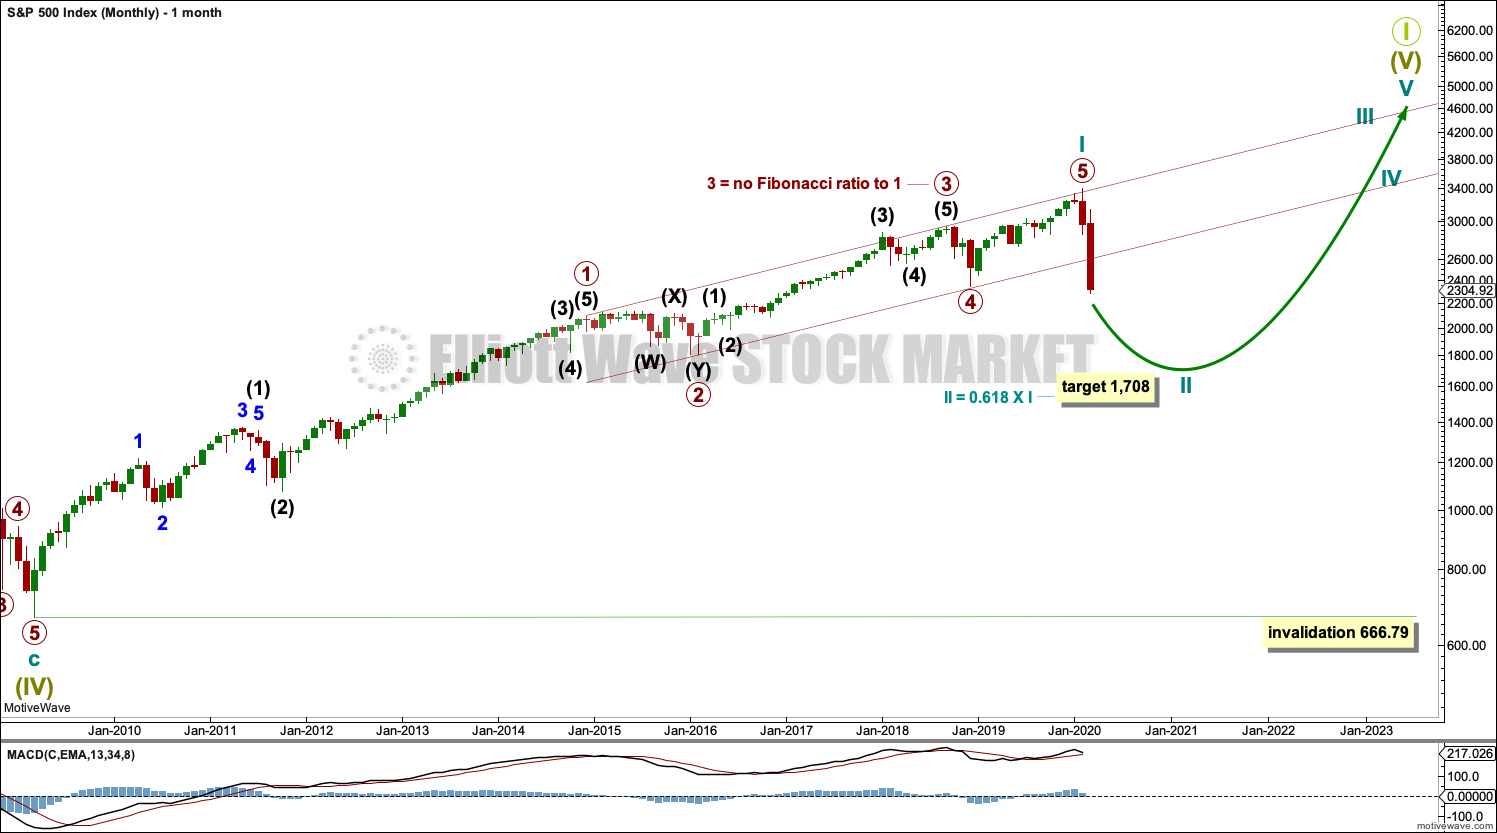
The 0.236 and now also 0.382 Fibonacci ratios of cycle wave I have both been passed. The next Fibonnacci ratio in the sequence is used for the next target for cycle wave II to end.
The channel drawn about cycle wave I is drawn using Elliott’s first technique. This channel looks text book perfect. The channel is now strongly breached confirming an end to the bull market, which began in 2009, and confirming a new bear market to follow.
Cycle wave II may not move beyond the start of cycle wave I below 666.79.
Cycle wave II may last about one to two years in total. In the middle should be a B wave bounce or consolidation that may last some months.
WEEKLY CHART
Click chart to enlarge.
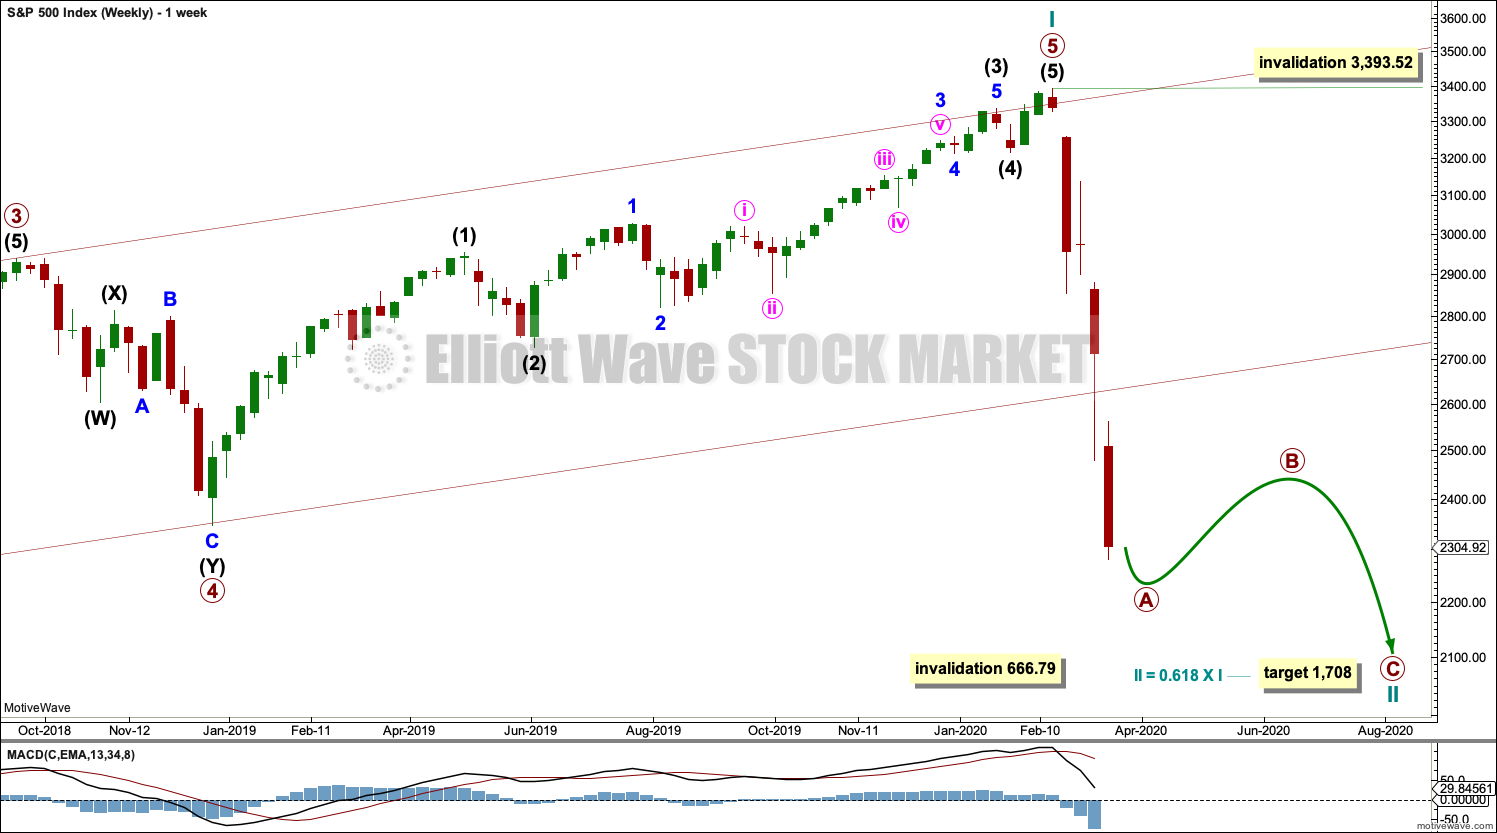
The channel is now breached by a full weekly candlestick below and not touching the lower edge. Further confidence in this wave count may be had.
Price is now below the 0.382 Fibonacci ratio of cycle wave I at 2,352. The structure of cycle wave II may need further to go to complete. The next Fibonacci ratio at 0.618 is now a preferred target for cycle wave II to end.
It is possible now that cycle wave II could be complete. This is outlined in a second alternate hourly chart below; in analysis of that chart I have outlined what needs to be seen for confidence in the alternate wave count.
Cycle wave II may not move beyond the start of cycle wave I below 666.79.
DAILY CHART
Click chart to enlarge.
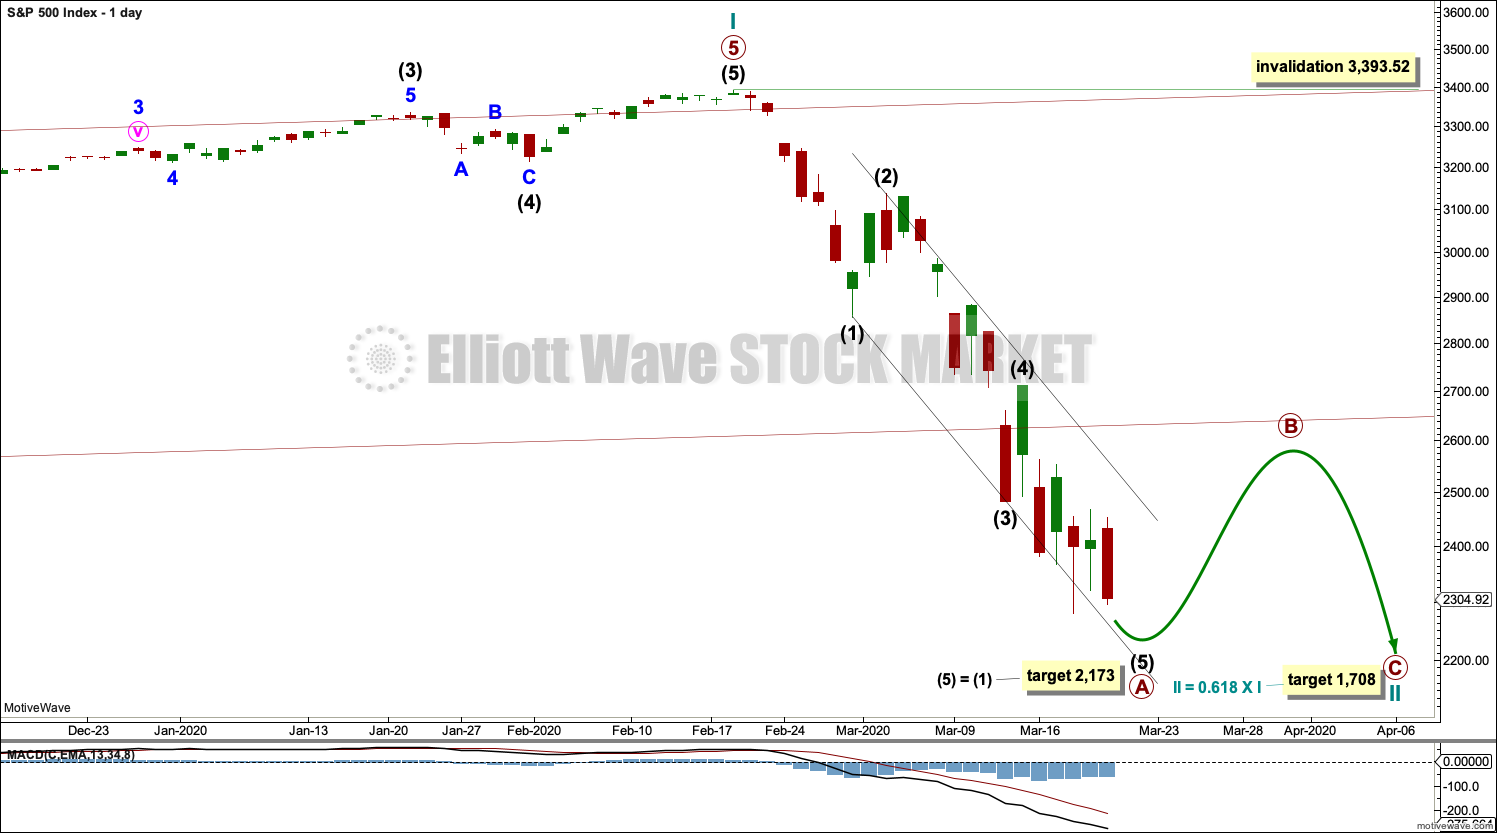
Redraw the wide maroon trend channel carefully: draw the first trend line from the end of primary wave 1 at 2,093.55 (December 26, 2014), to the end of primary wave 3 at 2,940.91 (September 21, 2018), then place a parallel copy on the end of primary wave 2 at 1,810.10 (February 11, 2016). The channel is fully breached indicating a trend change from the multi-year bull trend to a new bear trend.
Cycle wave II may subdivide as any Elliott wave corrective structure except a triangle. It would most likely be a zigzag. Primary wave A may be an incomplete five wave impulse. Primary wave B may not move beyond the start of primary wave A above 3,393.52.
Within primary wave A, there is no Fibonacci ratio between intermediate waves (1) and (3). This makes it more likely that intermediate wave (5) may exhibit a Fibonacci ratio to either of intermediate waves (1) or (3). The most common Fibonacci ratio for a fifth wave is equality in length with its counterpart first wave.
MAIN HOURLY CHART
Click chart to enlarge.
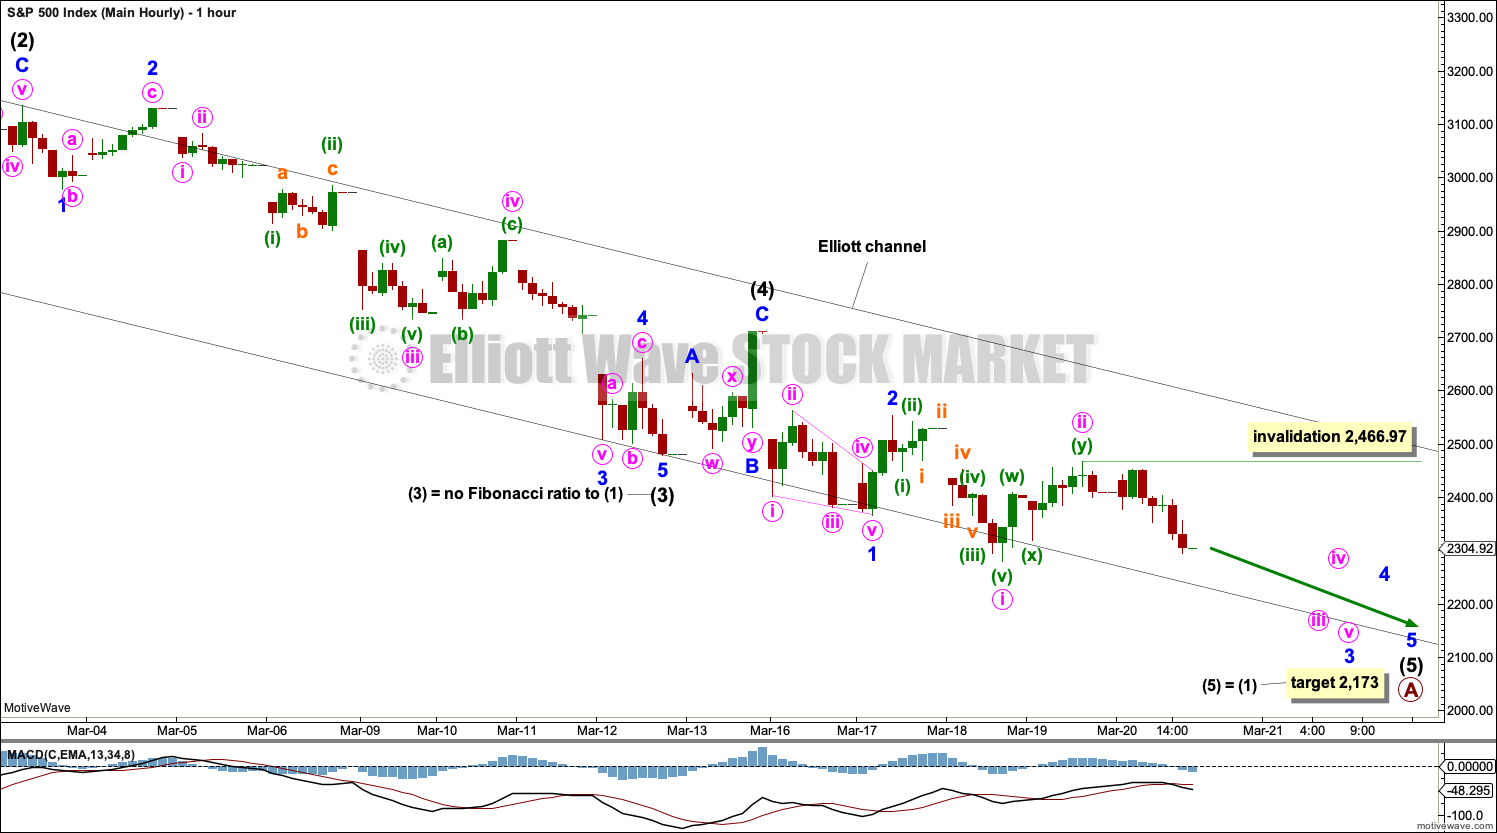
This remains the main wave count because it is always safest to assume the trend remains the same until proven otherwise. The trend now is down, so assume it may continue down until this wave count is invalidated.
Primary wave A may be an incomplete five wave impulse.
Draw a channel about primary wave A using Elliott’s first technique: draw the first trend line from the ends of intermediate waves (1) to (3), then place a parallel copy on the end of intermediate wave (2).
During bear moves, this market sometimes behaves like commodities. It may exhibit swift strong fifth waves. Look for the possibility for intermediate wave (5) to end with further strength.
Intermediate wave (5) must subdivide as a five wave motive structure, either an impulse or an ending diagonal. An impulse is most likely. That is what shall be expected until and unless overlapping indicates a diagonal.
Within intermediate wave (5), minor waves 1 and 2 may be complete. Minor wave 3 may have begun and may only subdivide as an impulse. Within minor wave 3, minute waves i and ii may be complete. Within minute wave iii, no second wave correction may move beyond the start of its first wave above 2,466.97.
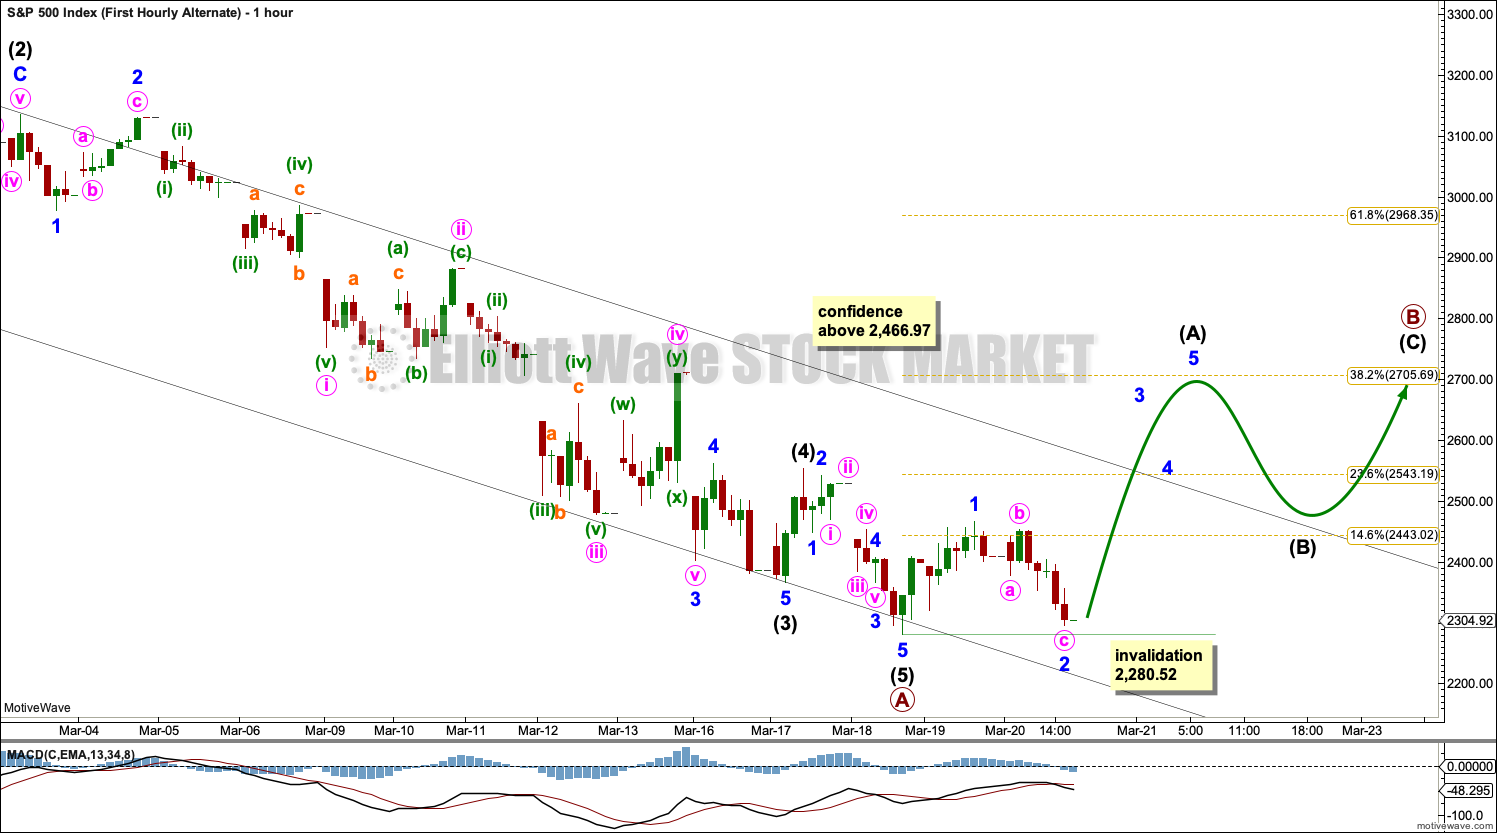
FIRST ALTERNATE HOURLY CHART
Click chart to enlarge.
It is possible that primary wave A may be over. There is some support for this first alternate wave count from classic technical analysis.
Primary wave B may subdivide as any Elliott wave corrective structure. It may be a quick sharp bounce as a zigzag, or it may be a more time consuming sideways consolidation as a flat, combination or triangle.
A new wave at primary degree should begin with a five wave structure upwards on the hourly chart. Within that first five up, no second wave correction may move beyond its start below 2,280.52.
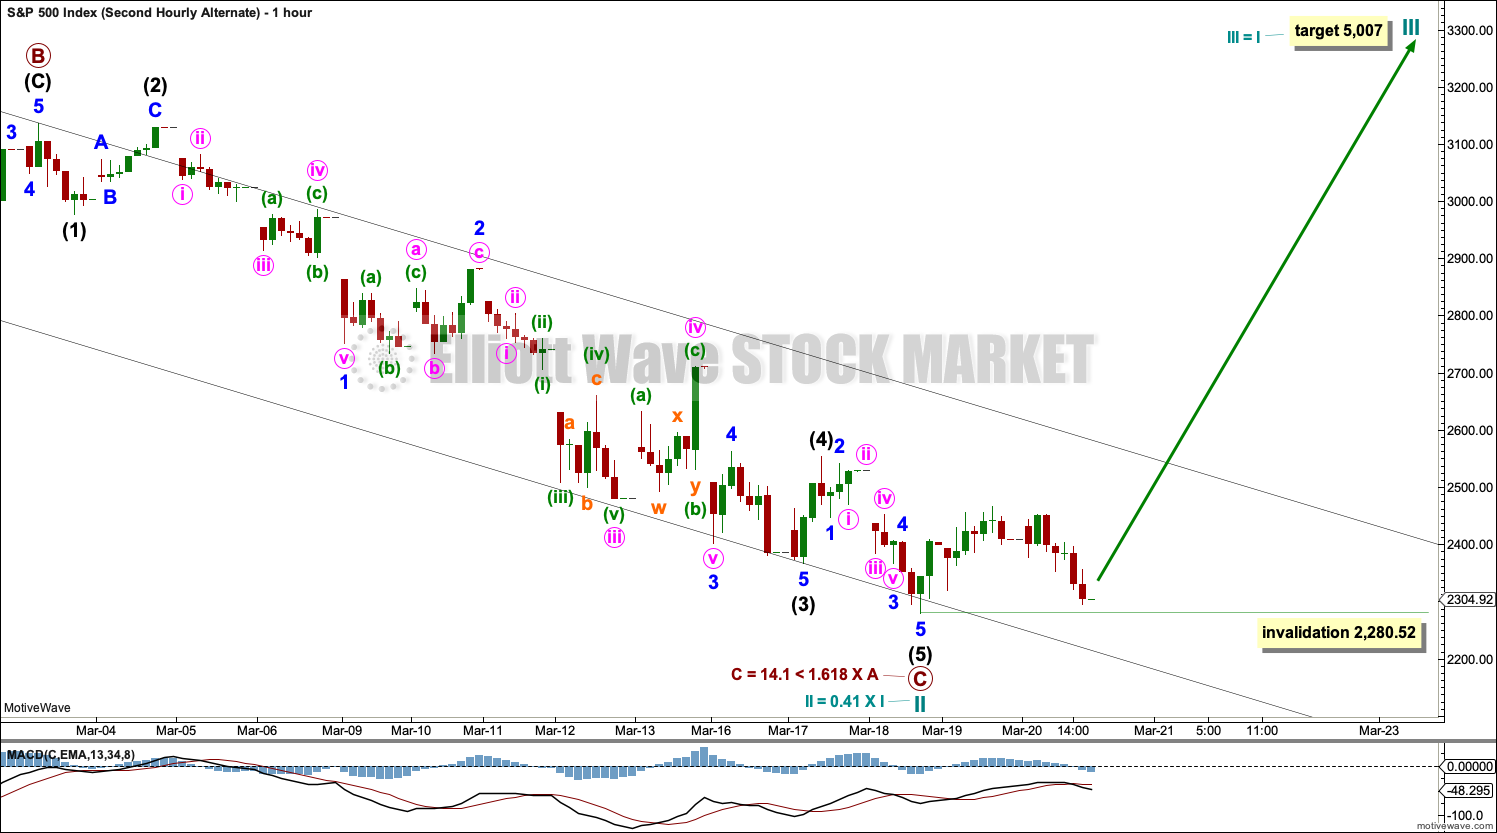
SECOND ALTERNATE HOURLY CHART
Click chart to enlarge.
It is possible that cycle wave II may be a complete quick relatively shallow zigzag at 0.41 of cycle wave I. Coming after zero divergence between price and market breadth at the all time high, statistically a shallow bear market would be most likely.
This wave count absolutely requires some confidence from classic technical analysis before it may be considered seriously. It is published to consider all possibilities.
This wave count may require one or more of the following conditions to be met for confidence in it:
– A 90% up day or two back to back 80% up days within three sessions from today.
– A 6 point rise in Lowry’s short-term index.
– A new high by the AD line.
– A new high above 3,393.52.
– A bullish candlestick reversal pattern with support from volume at the daily, weekly or monthly chart level.
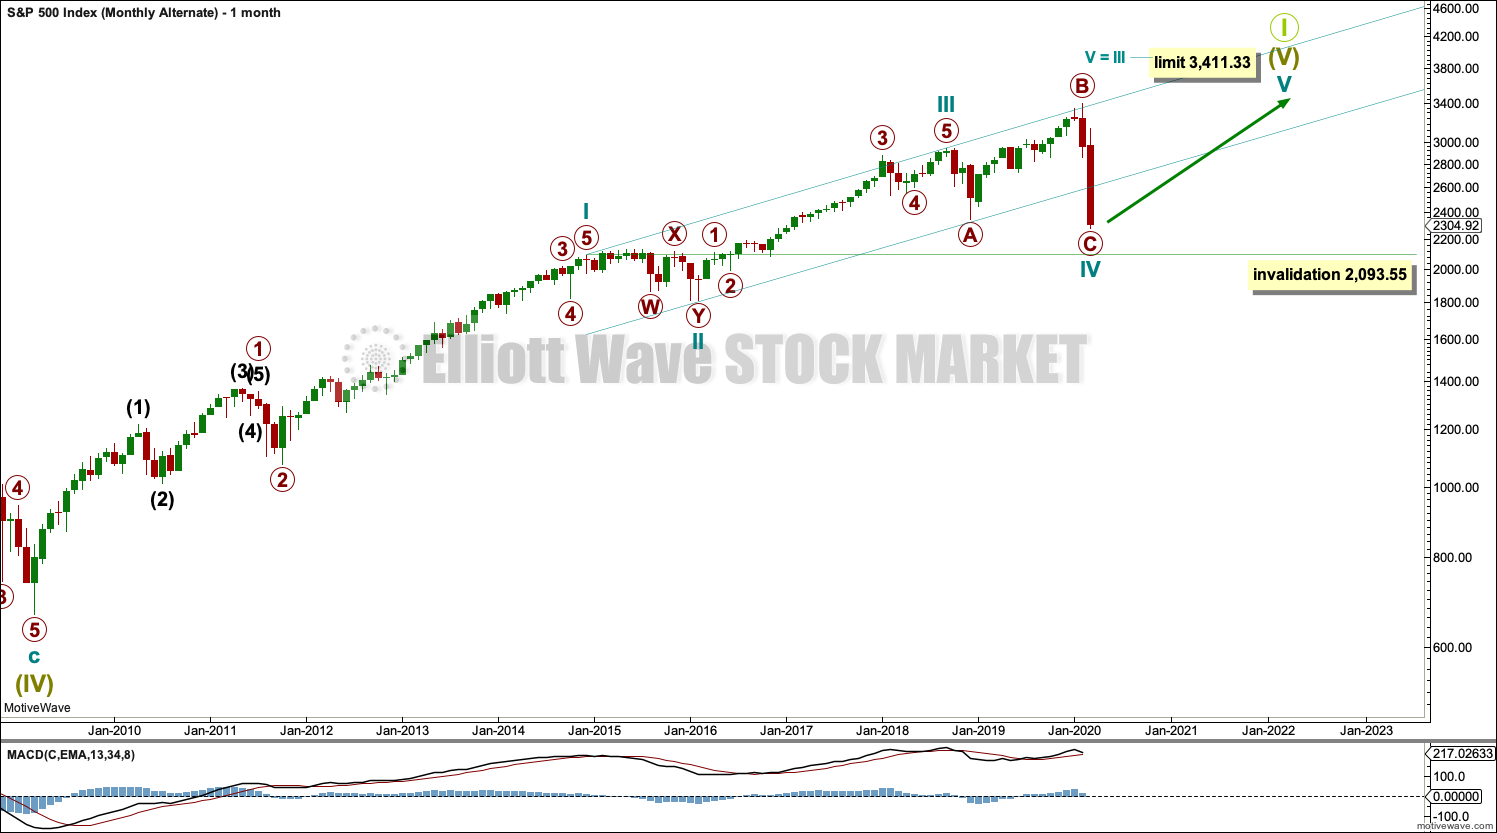
FIRST ALTERNATE MONTHLY CHART
Click chart to enlarge.
It is also possible that an impulse higher is incomplete and the sharp fall of the last few weeks is wave C of an expanded flat correction for cycle wave IV.
Cycle wave IV may not move into cycle wave I price territory below 2,093.55.
Cycle wave III would be shorter than cycle wave I. This limits cycle wave V to no longer than equality in length with cycle wave III. If cycle wave IV moves lower, then this limit must also move correspondingly lower.
This wave count is possible.
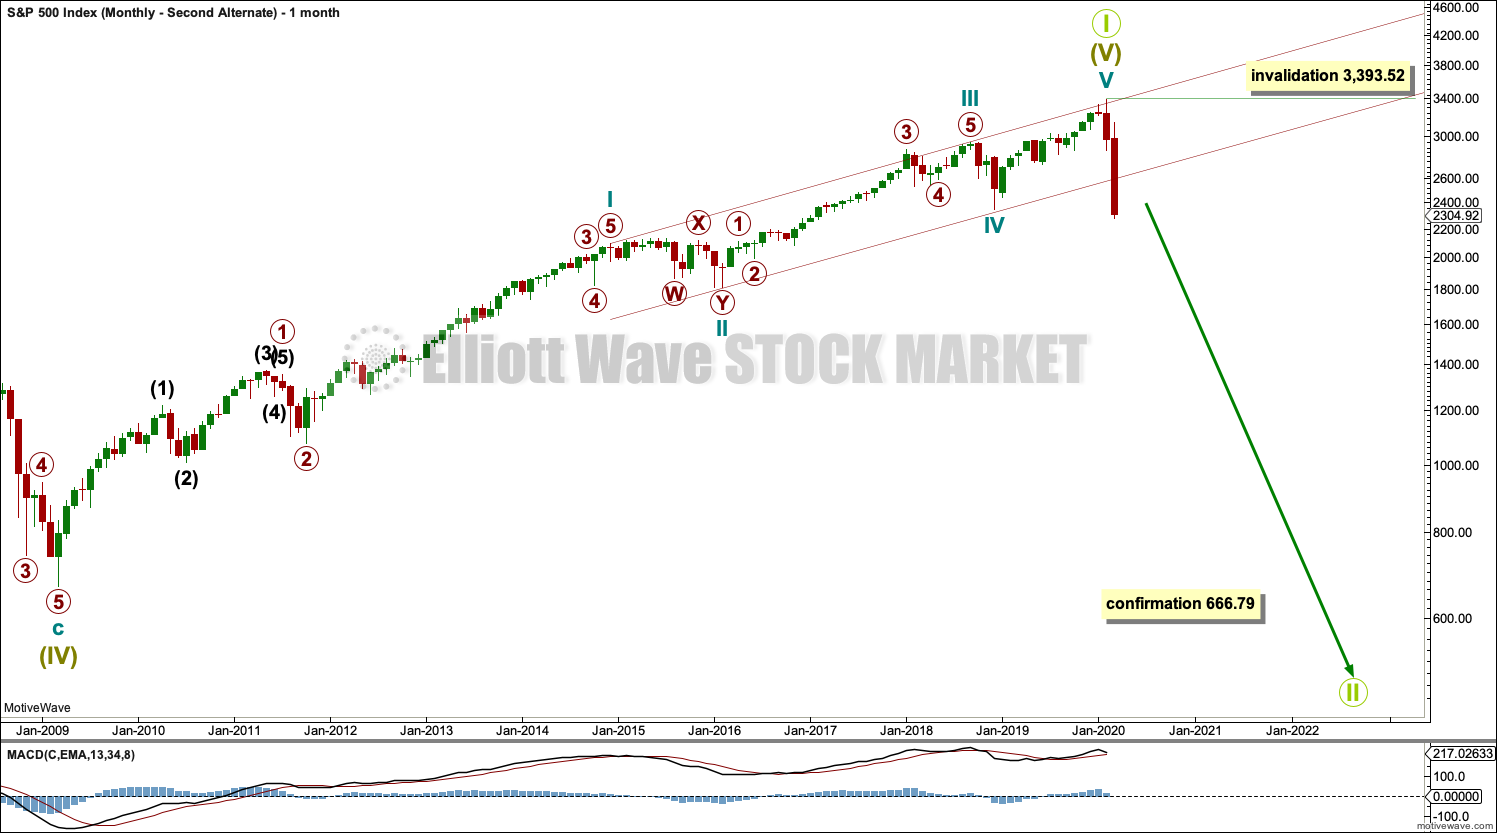
SECOND ALTERNATE MONTHLY CHART
Click chart to enlarge.
This wave count is the same as the first monthly chart, but the degree of labelling is moved down one degree. It is possible that the all time high was the end of a Grand Super Cycle first wave, and a huge market crash to historic lows may have just begun.
However, at this time with the data in hand this wave count does not have good support from classic technical analysis: There was non divergence between price and market breadth at the high, and there is currently bullish divergence between both of price and On Balance Volume and the AD line. While this data could change, analysis may only be performed on data in hand at this time.
TECHNICAL ANALYSIS
WEEKLY CHART

Click chart to enlarge. Chart courtesy of StockCharts.com.
A 32.8% drop in price (high to low) no longer has precedent within the larger bull market.
At the weekly chart level, conditions are now oversold; it is now more possible that a bounce or consolidation may arrive.
DAILY CHART
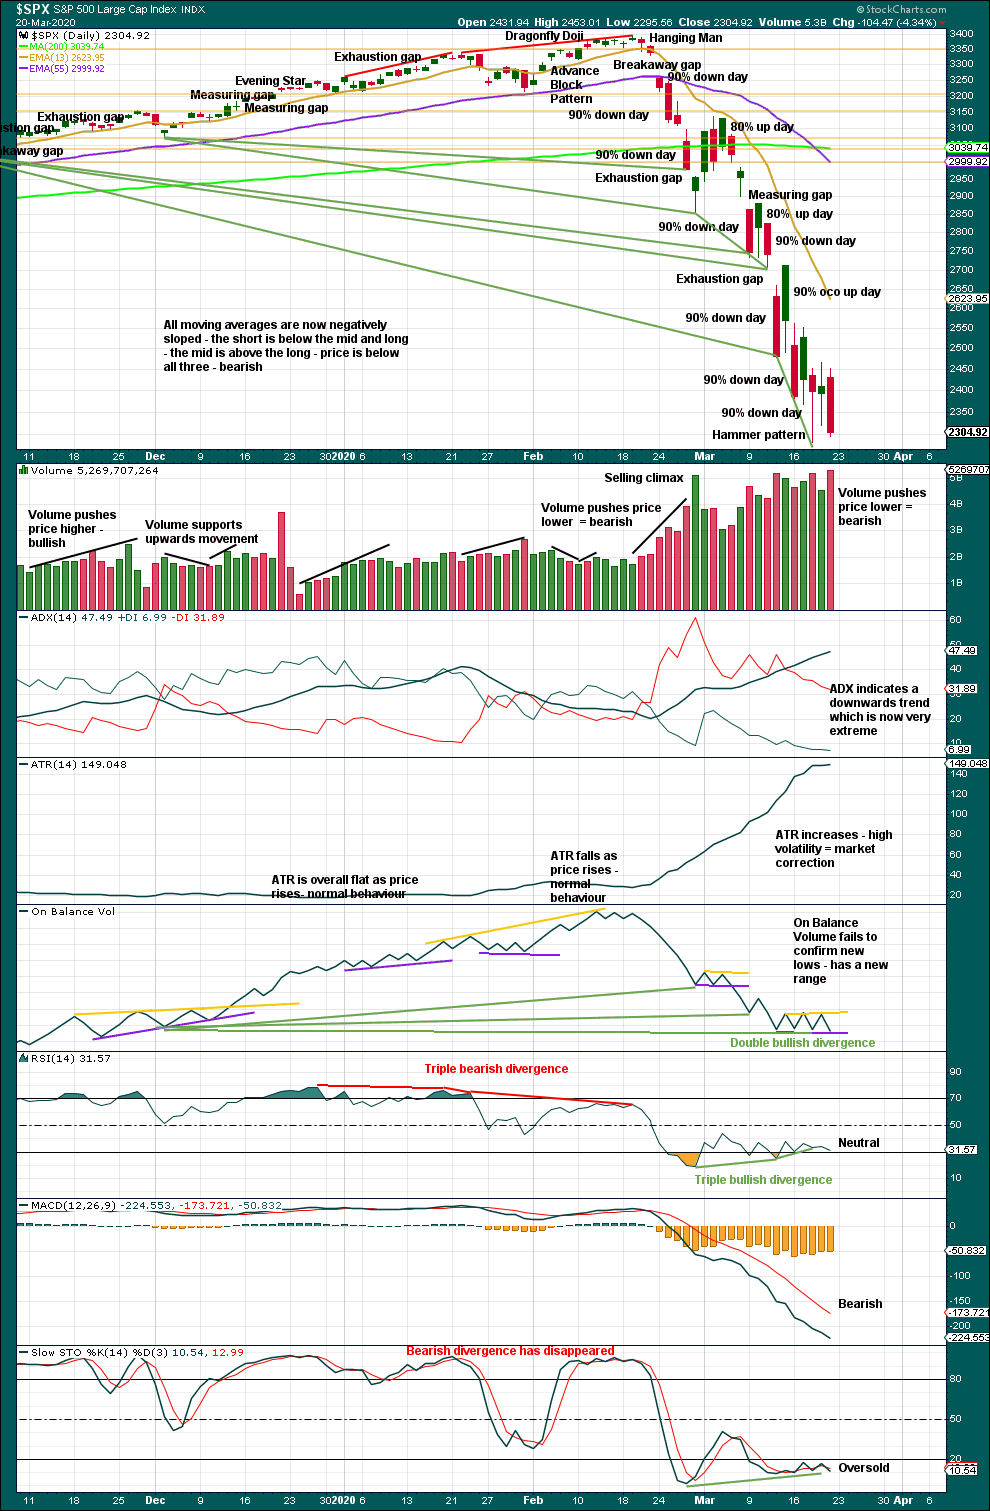
Click chart to enlarge. Chart courtesy of StockCharts.com.
There are now eight 90% downwards days in this strong downwards movement.
The following indicators still suggest a low may be in place soon:
– RSI reached deeply oversold and now exhibits short-term triple bullish divergence with price.
– Stochastics reached oversold and now exhibits short-term bullish divergence with price.
– On Balance Volume continues to exhibit double bullish divergence with price. On Balance Volume has failed to confirm the last three days’ lows.
If price bounces here, then it would most likely be a correction within an ongoing bear market and not necessarily the end of the bear market.
At this stage, there is not any evidence of a sustainable low in place.
BREADTH – AD LINE
WEEKLY CHART
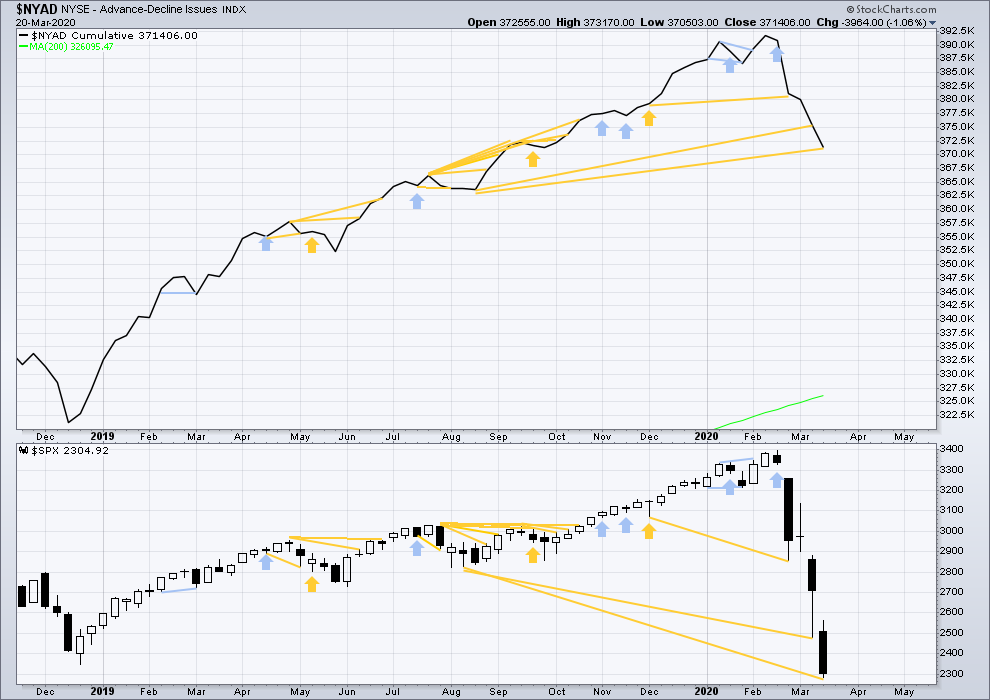
Click chart to enlarge. Chart courtesy of StockCharts.com. So that colour blind members are included, bearish signals
will be noted with blue and bullish signals with yellow.
Bear markets from the Great Depression and onwards have been preceded by an average minimum of 4 months divergence between price and the AD line with only two exceptions in 1946 and 1976. With no divergence between the AD line and price at the last all time high, this current bear market now makes a third exception.
In all bear markets in the last 90 years there is some positive correlation (0.6022) between the length of bearish divergence and the depth of the following bear market. No to little divergence is correlated with more shallow bear markets. Longer divergence is correlated with deeper bear markets.
This bear market comes after no bearish divergence. It would more likely be shallow, but this is a statement of probability and not certainty. So far it is slightly more than the 0.382 Fibonacci ratio of the bull market it is correcting (beginning March 2009).
Again this week price made new lows below prior lows of August 2019, but the AD line has not. This fall in price does not have support from a corresponding decline in market breadth. This divergence is bullish and supports the view that this bear market may more likely be shallow.
Large caps all time high: 3,393.52 on 19th February 2020.
Mid caps all time high: 2,109.43 on 20th February 2020.
Small caps all time high: 1,100.58 on 27th August 2018.
DAILY CHART
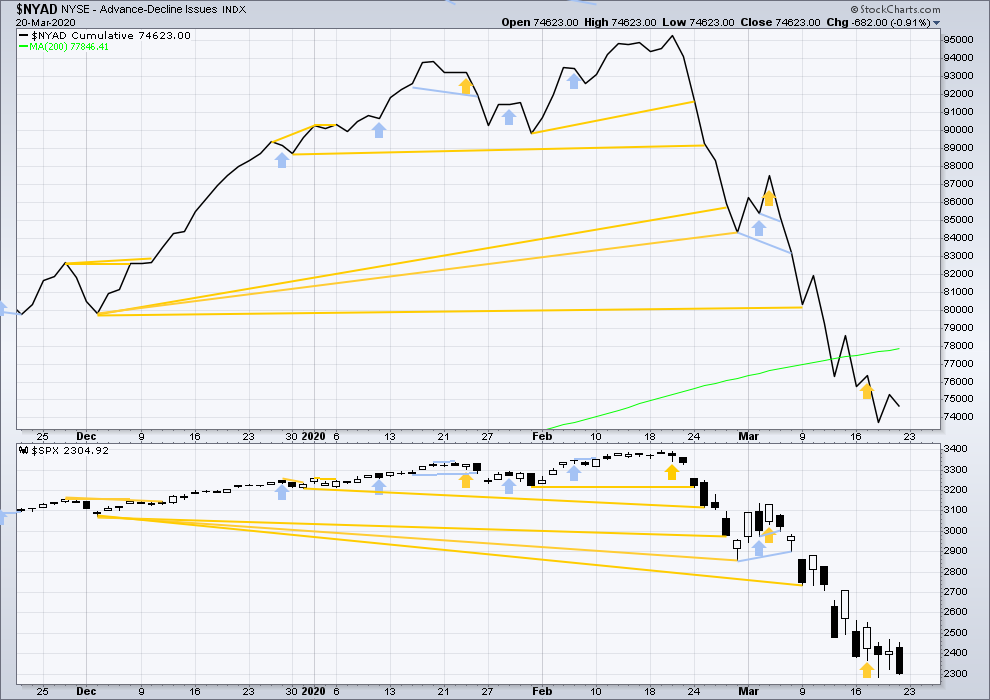
Click chart to enlarge. Chart courtesy of StockCharts.com. So that colour blind members are included, bearish signals
will be noted with blue and bullish signals with yellow.
Breadth should be read as a leading indicator.
Both price and breadth have moved lower on Friday. Neither made new lows. There is no new short-term divergence.
VOLATILITY – INVERTED VIX CHART
WEEKLY CHART
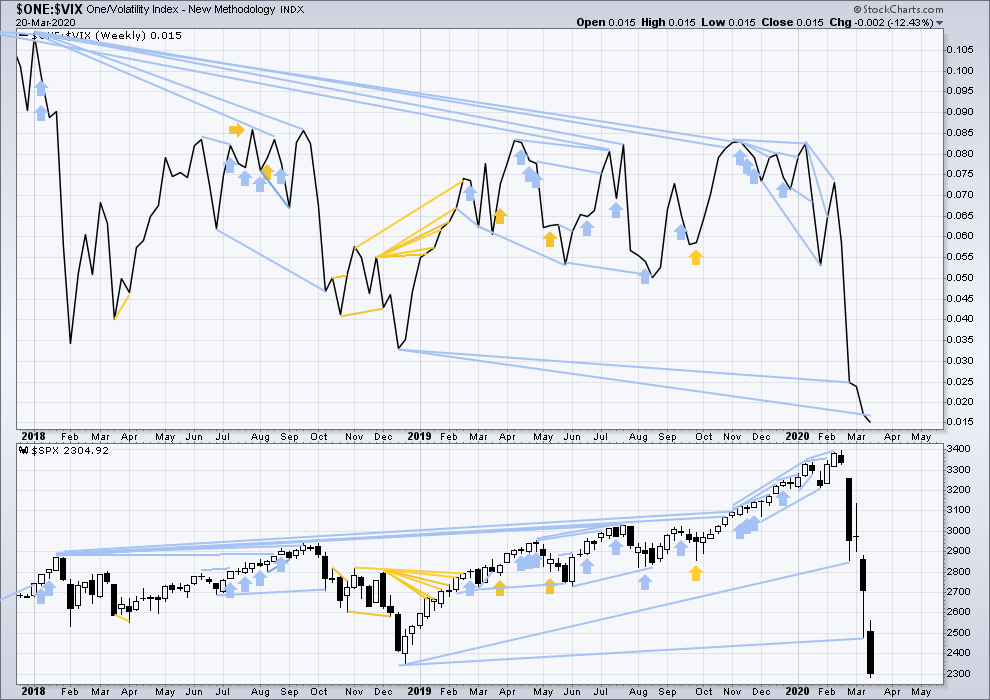
Click chart to enlarge. Chart courtesy of StockCharts.com. So that colour blind members are included, bearish signals
will be noted with blue and bullish signals with yellow.
The all time high for inverted VIX was on 30th October 2017. There is now over two years of bearish divergence between price and inverted VIX.
The rise in price is not coming with a normal corresponding decline in VIX; VIX remains elevated. This long-term divergence is bearish. It may now be resolved by this last fall in price, which meets the technical definition of a bear market.
This week both price and inverted VIX moved lower to new lows. There is no new divergence.
DAILY CHART
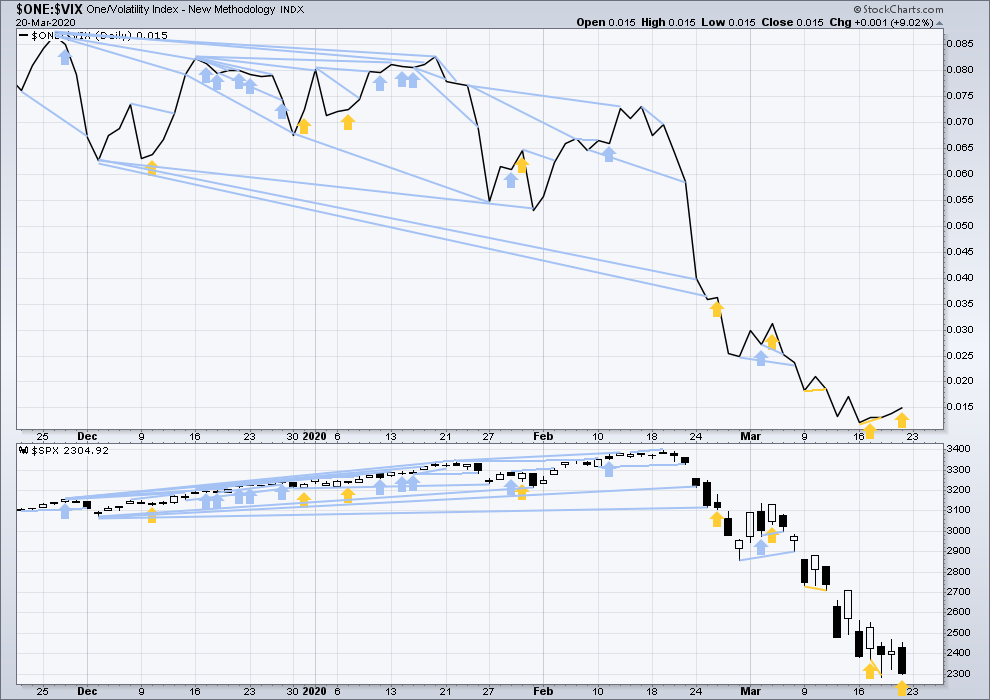
Click chart to enlarge. Chart courtesy of StockCharts.com. So that colour blind members are included, bearish signals
will be noted with blue and bullish signals with yellow.
On Friday price has moved lower, but inverted VIX has moved higher. This divergence is bullish.
DOW THEORY
Dow Theory has confirmed a bear market with the following lows made on a closing basis:
DJIA: 21,712.53 – a close below this point has been made on the March 12, 2020.
DJT: 8,636.79 – a close below this point has been made on March 9, 2020.
Adding in the S&P and Nasdaq for an extended Dow Theory, a bear market has now been confirmed:
S&P500: 2,346.58 – a close below this point has now been made on March 20, 2020.
Nasdaq: 7,292.22 – a close below this point was made on the March 12, 2020.
Published @ 02:41 p.m. EST on March 21, 2020.
—
Careful risk management protects your trading account(s).
Follow my two Golden Rules:
1. Always trade with stops.
2. Risk only 1-5% of equity on any one trade.
—
New updates to this analysis are in bold.
One of my reason for cycle wave II being correct and Grand Cycle V not being over is there was no parabolic move prior to drop and public was not completely suckered in. Now every common man is looking at the news or market (or getting drunk) and once/if market rallies after 1-3 months they will jump in, not completely knowing it could be too late.
Emotional cycles..
I completely agree with Verne – that’s what you get with the market when you let quants run the market. They push it to the extreme on the upside and now they will do the same on the downside. Fundamentals don’t matter in this day and age.
Hourly chart updated:
The middle of intermediate (5) may have now passed today. Now for another three fifth waves down with another two fourth wave corrections between them.
The invalidation point is moved lower. Minute iv may not move into minute i price territory.
Safest to assume the trend remains the same, until proven otherwise.
Yep!
wonky vix again, did they forget to turn the vix trading machine on? somebody kick it, make sure its working.
Price is also getting squeezed between the bottom of the “big channel” down, and the steeper “narrow channel” down.
Robert Miner is calling for SPX to 2080 minimum, and 1810 or below “probable”.
I never thought I would be so delighted to see banksters with egg dripping off their corrupt faces!! It’s a new day….Yes Siree!!! 😀
This market is a different beast that 2000 and 2008 but they only know how to print and drop cheap money.
The FED decision to buy corporate debt is beyond stunning.
This is the debt, mind you, irresponsible boards used to expand P.E. multiples with hundreds of billions in share buy-backs, and if course the fat bonuses that went with that particular scheme. The FED may be criminal and corrupt but they are not stupid, at least I don’t think so.
There is nothing altruistic about buying corporate debt. It is an attempt to control interest rates!
You now know more than 90% of traders out there and what to watch… 😉
The weekend Ciovacco short takes video is a must watch.
The two examples in history of the interest rate spread getting this high and what followed in the market over the next 1-2 years (-40% and -43%) is rather compelling.
Fed actions aren’t likely to dramatically change the final outcome…this market is heading further down, probably A LOT, over time.
🙂
Oh, by the way, the risk to the FED is that like the asinine and ill-advised recent rate cuts, this rally also could be faded…!
Not saying it necessarily will, but if that happens it is the END of central banks, the FED included…
shorted that rally, now thinking about some calls
Gonna gamble with some calls, SPY 20 APR 263. limit order at 1$
Try a bear vertical call credit spread to reduce risk. Exit the short let once we have a confirmed reversal for lower cost basis…. 🙂
House money… risk ON!
The FED has taken an awful risk this morning. Never mind the hubris of the specious notion that they can bail out the global economy. The subterfuge of their making this announcement pror to the open should be obvious to all as nothing but a brazen attempt to manipulate both sentiment and price. We KNOW what is being “announced” is actually what has been going on all along. Someone opined no one ever went broke under-estimating the stupidity of the American public. I have a feeling that folk are soon going to figure out the FED is as “ne-ked” as the storied emporer…
Getting dyslexic…meant emperor… 🙂
I have been in a running debate with Bob Prechter over the years over his contention that news have no effect on market price. I have told Bob on many occasions that with all due respect to EWT, that argument is non-sensical on its face, as it implies traders do not REACT to news. I love sending him funny missives on days like today! 😉
How does he reply? By saying it’s only a temporary response by traders?
His general theme is that co-incidence does not necessarily imply causality.
I typically retort- “But Bob, neither does it necessarily EXCLUDE it!”
I do think he is right in that news will probably not affect the larger TREND, which is not the same as PRICE…
Exactly. The trend is normally your friend but price can sometimes be a bad enemy.
You’re one smart cookie! 🙂
I stopped subscribing a few years ago, as the analysis was too much one sided. A RP quote from December, 21 2012:
“One of the most important things to understand about the stock market is its relationship to news. Aside from emotional reactions lasting just minutes, news does not cause the market to move in any meaningful sense. News is the result of trends in social mood. Many people who say they understand this idea nevertheless continue to monitor news as if it is meaningful to their investment decisions. This belief is deadly.”
Like clock-work, here comes the FED with a Q.E. infinity announcement.
Here’s the dirty little secret, just keep it between us….we have ALREADY been in Q.E. infinity. This is nothing but shameless propagandising and an attempt to jawbone the market out of free-fall. The hubris of these criminals knows no bounds. How long before the herd figures this out?
That was the last silver bullet in the chamber Verne.
Few weeks max right into mid April window
Financial mischief, in nickels & dimes or in trillions, is death to rich and poor alike.
Now they want quants to be shutdown… it was good to use quants when things were going straight up..No one said hey wait a minute , let’s see if these valuations make any sense.
60 minutes will air a piece tonight showing a vaccine in hand, for covid19
https://www.sciencemag.org/news/2020/03/who-launches-global-megatrial-four-most-promising-coronavirus-treatments
If you are holding puts and plan to sell at the open, DO NOT use a market order. Market makers have been engaging in some funny business with scandalous bids WAY below intrinsic value of options in the first few minutes of trading. Never seen anything quite like it…
Excellent point
Hi Bech, nice to meet’cha
Sooooo, correct me if I am wrong but I cant find SIX weekly red candles in a row on the SPX
Looks like if one wanted to GAMBLE and buy some cheap calls tomorrow AND/OR Tuesday……… man Im getting 5% of my portfolio in 50 cent SPY call for like mid April. I have 1% from last week, 1% tomorrow at open, and the rest around roundies….. this is a TERRIBLE plan, but a GREAT gamble
Peter – recommended strikes if you can.
never listen to me …..
oh my,, are we going to hop right over our target? limit down in 10 min.
took 4 min
gonna be some expensive hot cakes
Vernes Vix is going to be perky
Looking for a lower high today or Tuesday…. 🙂
Short term target of 2173 in Lara’s count is reached.
any idea of next target if this holds up?
isn’t 1,996-1,997 a short stop?
Bech that’s only on ES not SPX not which is what Lara is talking about.
Sorry I’ll say that again! That’s only on ES not SPX which is the chart Lara’s talking about.
The latest in daily new Covid-19 infections, world wide.
Up to 32000 a day and continuing an exponential rise.
The bar for yesterday CLOSED OUT LOWER than 3/21.
We should watch this development closely. I don’t expect that to continue as a trend but if it does…the end of this disaster could be closer than we have expected.
Anyone dug into Rob Smith’s price structure based analysis approach?
Being a price structure oriented trader with a lot of multi-time frame analysis focus, it really appeals to me.
He identifies “reversals” (pivots) at their most fundamental level: from a bar to bar structure perspective, every bar is either a (1) inside bar, (2) thrust bar (inside on one end point, outside on another), or a (3) outside bar. And every outside bar at some point in it’s development is a thrust bar which reverses.
He identifies inside bars as the critical “equilibrium” state, and movement beyond the either end point of a inside bar is a potential trigger (continuing the prior price movement, or reversing it). And that you can trade any time frame using this core set up and trigger.
He points to the high EV value of having “full time frame continuity”, which is every bar across all time frames having the same body direction. Right now obviously there are lots of “down” full continuities. RUT and MSFT are two you could look at as examples (monthly, weekly, daily, hourly, just looking at the direction of the body of the last bar at each time frame).
He also argues that the fundamental structural feature of market price action is expanding triangles (which exist at multiple time frames), and identifying the position and direction price swings within such triangles gives edge too.
So right now RUT is in a perfect short set up at the hourly time frame. Full time frame downward price continuity, and the most recent hourly bar is an inside (and down) bar.
Sell the break below the low of the last hour RUT bar. Stop just above it, and lower that stop fast on price movement going our way. If there is ANY hourly bar that is an up bar (the body), EXIT, the idea is to catch a run of 1-7 (typically 2-3) larger time frame (hourly in this case) bars on the break out of the inside bar.
Well maybe old hat to many, but I like it. Extremely “evidential”, no real room for any subjectivity or even “parameters” of any type. And 100% price action based.
Per the same technique there’s a very similar excellent set up in MSFT short on the hourly. There, it’s several hours of inside bars in the shadow of a larger bar on Thursday.
The concept also is very akin to the “squeeze” concept of tightening range in both price swings and bar size leading to explosive moves.
ES may be showing the way to lower prices confirming the main chart, as the low on the 18th has not held on ES but has held on SPX.
You could say it’s a bullish divergence between the 2 markets but I doubt it, as I tried to put a bullish count on ES via an expanding ending diagonal for (5) but the internals just don’t work.
I know they’re different markets but they are obviously closely related and at the moment ES may be the one confirming that the trend is still down.
They are literally “different markets”, but pragmatically they are not, they are interlocked. I consider /ES “the nose of the dog” and SPX the “body of the dog”. /ES leads, by virtue of being a blend of futures markets discounting the likely future value of SPX, and /ES operating while SPX is sleeping. They run fairly closely in lock step once the day session starts, though my sense is even then /ES leads by a minute or so.
/ES price movement overnight has been HUGE, and note that started well before the collapse from the ATH. We started getting more and more big high momentum upside gaps in the run up starting Fall’19, which of course are overnight price run ups in /ES. And now we are getting MASSIVE overnight price moves in /ES. I find a lot of value in analyzing /ES with it’s “full picture” of price movement data, rather than just seeing that movement as “instantaneous gaps” as portrayed in SPX day session data.
True and in this instance the difference on Friday between the ES making a new low relative to the 18th and SPX not, means that the 1st and 2nd hourly alternates cannot apply to ES, thereby putting more emphasis on the main count.
Yes, the main is looking substantially more likely, for /ES reasons, because the push down Friday broke 78% retrace level, and we have down bars across the time frames (monthly, weekly, daily, hourly!). This high Fibo fit low stalled price…but it appears to be about to fail now.
My lower high fit targets are in blue. And my more generalized target zones in time and price marked in gray ellipses.
Let ‘er rip…
Yep.
Great observation Peter H. I have also noticed that SPX divergence from ES has been bullish on the way up, with SPX ultimately going on to confirm an earlier divrrgent high by ES. Good Eye!
Those seemingly quirky observations are often worth their weight in Vibranium…! 😉
Ha, no doubt Verne !
Lara,
Hope you are well and staying safe! Your alternate count that has Cycle 4 unfolding as an expanded flat is interesting. I’m wondering if another alternate might have Cycle I ending where you have Primary 1 (or even intermediate 1 of primary 1) ending. If so, there would be no upper limit to Cycle 5, is that correct?
Both the alternate monthly carts have cycle wave I ending where you suggest.
The problem then becomes that cycle III to follow it may only subdivide as an impulse. And the depth of the current bear market means cycle III should be over, this may be labelled cycle IV.
Chart of the idea here. Invalid below 2,093.55.
I’ll keep an eye on this idea too, essentially it needs the bear market to stop here or very soon indeed. If we see strength off a low and an expansion of breadth and buying power, then this idea may be more seriously considered.
But what if Cycle I actually ended where you have Primary 1of Cycle I (looks to be around 1500). Then Cycle III would be longer than Cycle I and Cycle V would have no limit. This would also allow Cycle IV to fall further.
In the chart above cycle III is longer than cycle I. It just looks shorter because of the semi log scale. Cycle III is 156.66 points greater than cycle I, it’s noted on the chart.
Ah…Thank you. I should have noted that.
Lara, I would like to suggest you provide an alternative model in which GSC II has started (assuming one is possible), to aid us in identifying incremental confirming price action vs. not. This possibility, while low in probability, is one I think we should keep an eye on. This price action since the ATH is unique re: initial multi-week momentum, as we might expect a GSC II’s initial period to be.
It’s the last monthly chart. Do you mean you’d like me to follow that daily?
Ah, sorry I didn’t catch that. No, not suggesting daily coverage. I am interested in if/when there is price action that further distinguishes (add confirming evidence to) a GSC II in play model. So if that occurs, by all means highlight it! And I’ll try to be a more careful reader.
No worries. The price point which differentiates that very bearish scenario from all others is 666.76 and unfortunately while price has not broken below that point it will probably remain indistinguishable from the main count.
For those with (plenty) of time, this is a well done article that had a number of quality likes on my LinkedIn feed where I found it:
https://medium.com/@tomaspueyo/coronavirus-the-hammer-and-the-dance-be9337092b56
Best info on CV spread and impacts of alternative actions I seen by far. MUST READ! Thanks Arnaud.
After reading this, you’ll have data based clarity on why the US gov’t failure to act early and aggressively is virtually criminal.
You can apply that to Australia as well Kevin. Started well failed dismally. Each state is now locking down
I wouldn’t say locking down. Non essential travel for example driving for holidays is not allowed but people are still able to leave their homes for work, shopping and other specific purposes etc.
Congregating at public places is now banned and rightly so after the absurd behaviour at Bondi beach while pubs and clubs are shutting down. Schools are still open except for the State of Victoria where they’ve brought the holidays forward to tomorrow.
It’s up to the people-if they don’t mix, the Government won’t bring in draconian measures.
I think it’s comming tho
Thanks for sharing
Much appreciated Arnaud!
Foist!
congrats