
S&P 500: Elliott Wave and Technical Analysis | Charts – May 11, 2020
A signal today from On Balance Volume suggests a new Elliott wave count.
Summary: It is possible the pullback within this bounce is over and the bounce may continue this week to a target at 3,269.
It remains possible that a downwards or sideways movement may continue here, which may last another couple of weeks and may find support about 2,663 to 2,650.
Thereafter, upwards movement to a final target about 3,069 to 3,261 may begin.
This bounce that began on 23rd of March is still expected to be a counter trend bounce within an ongoing bear market. When the bounce is complete, then the bear market is expected to resume with strength.
The biggest picture, Grand Super Cycle analysis, is here.
Last monthly charts are here. Video is here. Members are encouraged to view all three monthly charts. The third is much more bearish than this main wave count and remains a valid possibility.
ELLIOTT WAVE COUNTS
WEEKLY CHART
Click chart to enlarge.
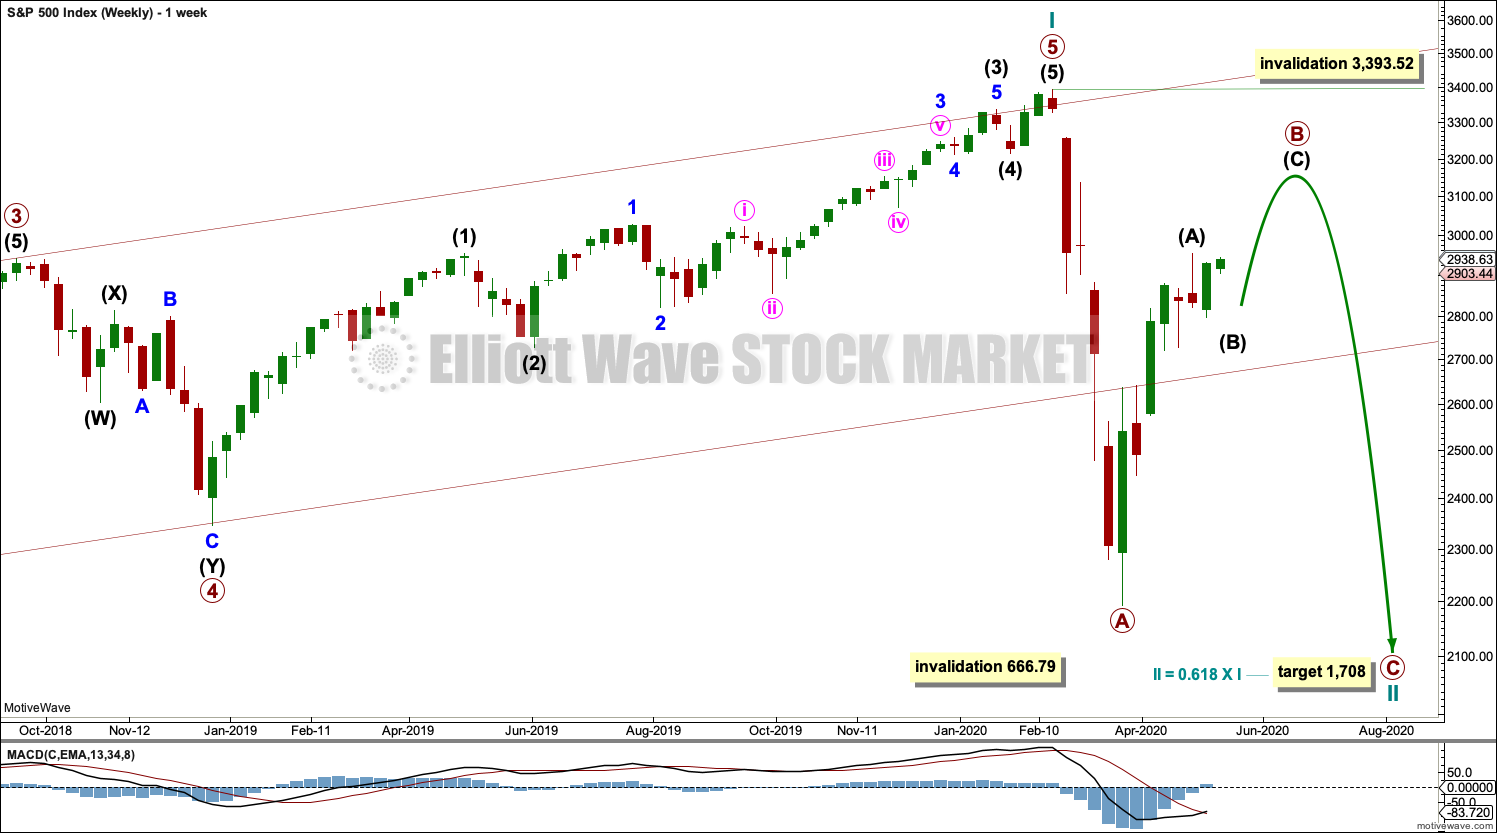
The channel is now breached by a full weekly candlestick below and not touching the lower edge. Further confidence in this wave count may be had.
Price has reached below the 0.382 Fibonacci ratio of cycle wave I at 2,352 on the last downwards movement. The structure of cycle wave II may need further to go to complete. The next Fibonacci ratio at 0.618 is now a preferred target for cycle wave II to end.
Cycle wave II would most likely subdivide as a zigzag; thus far that looks like what is unfolding. When primary waves A and B may both be complete, then the target may be calculated using a Fibonacci ratio between primary waves A and C. At that stage, the final target may change or widen to a zone.
Cycle wave II may not move beyond the start of cycle wave I below 666.79.
DAILY CHART
Click chart to enlarge.
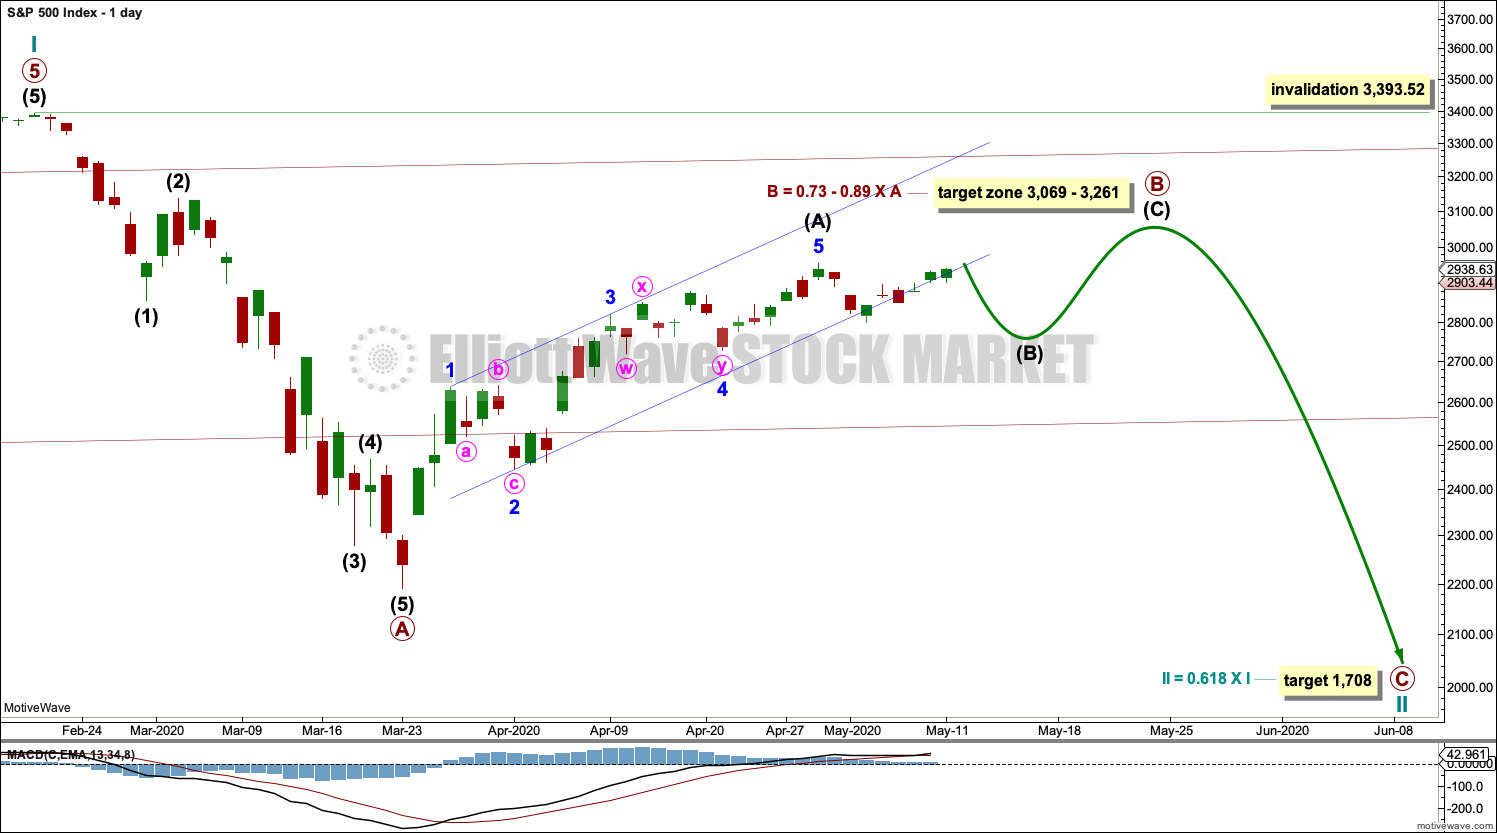
Draw the wide maroon trend channel carefully: draw the first trend line from the end of primary wave 1 at 2,093.55 (December 26, 2014), to the end of primary wave 3 at 2,940.91 (September 21, 2018), then place a parallel copy on the end of primary wave 2 at 1,810.10 (February 11, 2016). The channel is fully breached indicating a trend change from the multi-year bull trend to a new bear trend. Resistance at the lower edge has been overcome; price has closed above this trend line. The lower edge of this trend channel may provide support now as primary wave B continues.
Cycle wave II may subdivide as any Elliott wave corrective structure except a triangle. It would most likely be a zigzag. Primary wave A may be a complete five wave impulse downwards. Primary wave B may not move beyond the start of primary wave A above 3,393.52.
Draw a channel about intermediate wave (A) using Elliott’s first technique: draw the first trend line from the end of minor waves 1 to 3, then place a parallel copy on the end of minor wave 2. Intermediate wave (B) may breach this channel. Intermediate wave (B) may find support at the lower edge of the wider maroon channel. At this stage, the channel is breached at the hourly chart level but not yet at the daily chart level. A breach may be defined as at least one full candlestick below and not touching the lower trend line.
When intermediate wave (B) may be complete, then a new and wider channel may be drawn to contain all of primary wave B.
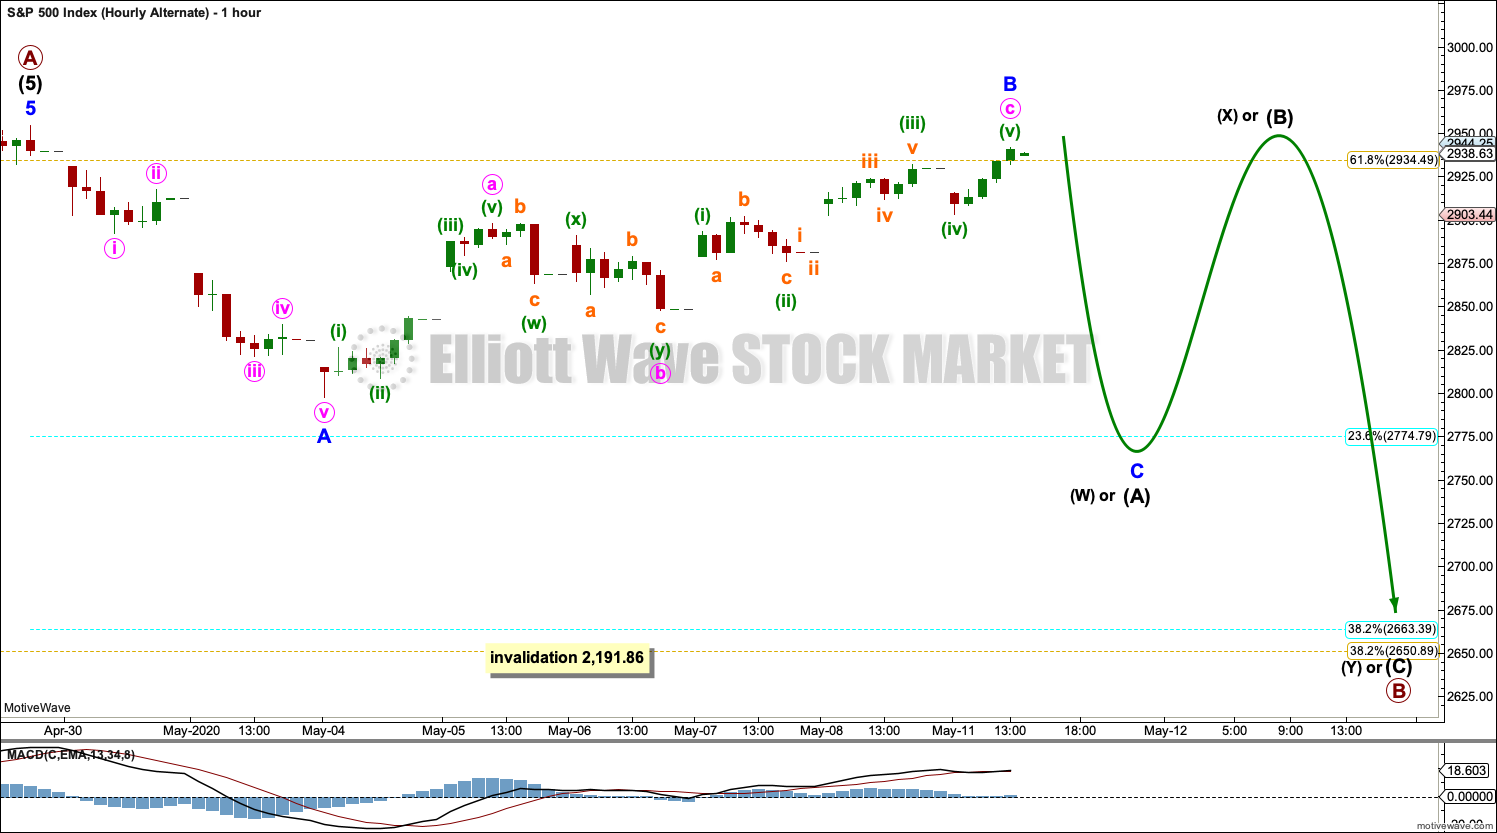
ALTERNATE HOURLY CHART
Click chart to enlarge.
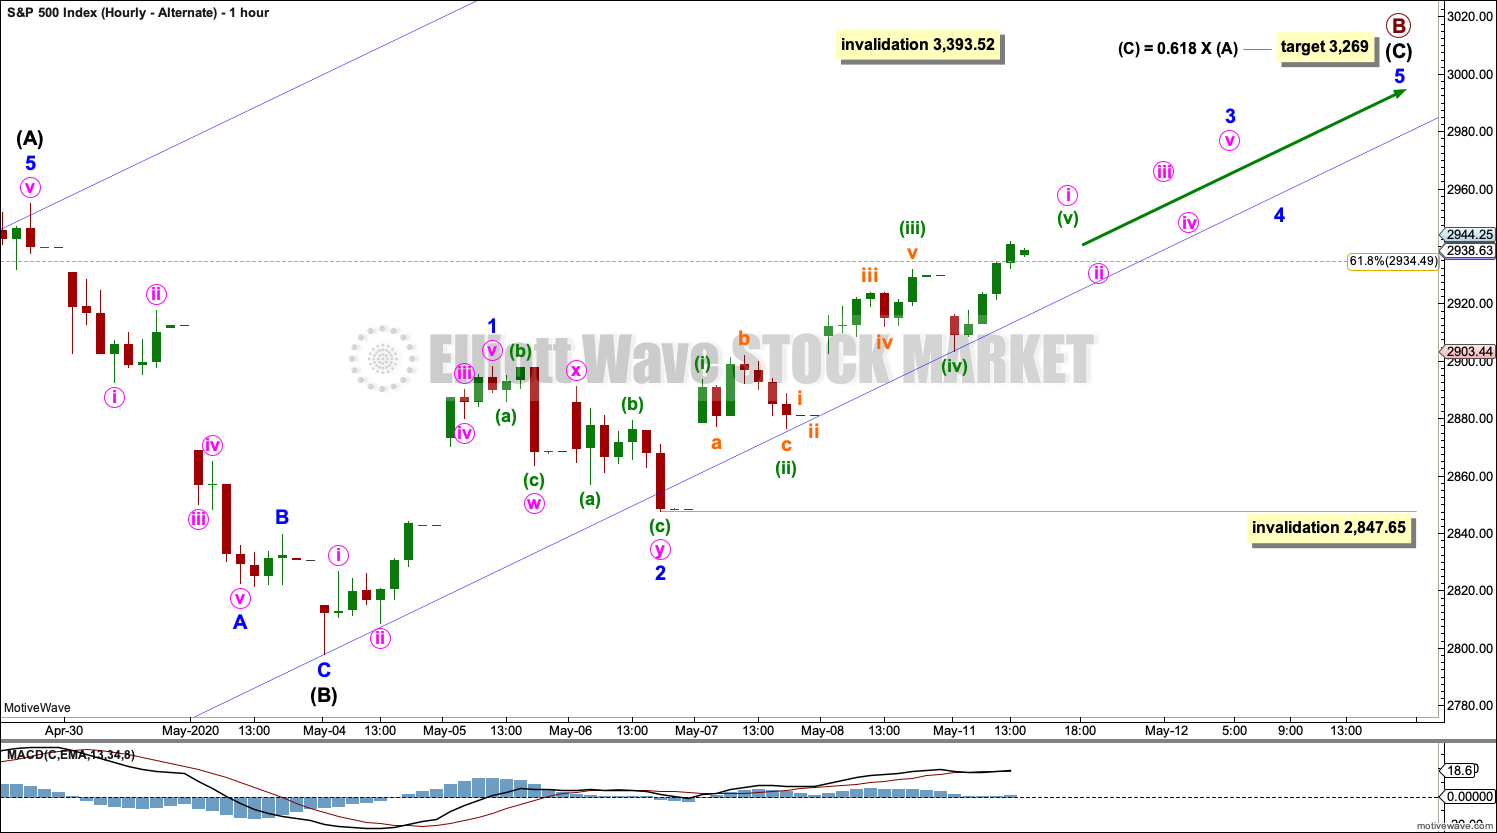
A bullish signal today from On Balance Volume suggests an upwards breakout from the consolidation zone may happen soon. Therefore, because of the bullish signal, this alternate idea is considered today. However, the AD line today gives a bearish signal that does not support this wave count.
If the degree of labelling within the last downwards wave is moved up one degree, then it is possible that intermediate wave (B) is a complete zigzag that was very brief and shallow. It is possible that intermediate wave (C) has just begun.
A target is calculated for intermediate wave (C) to end that expects primary wave B to be a very deep correction; this would follow normal behaviour for the first multi-week bounce within a bear market for the S&P500.
Intermediate wave (C) must subdivide as a five wave motive structure, most likely an impulse. Minor waves 1 and 2 within the impulse may be complete.
Minor wave 3 may only subdivide as an impulse. Minute wave i within minor wave 3 may be incomplete. Minute wave ii may not move beyond the start of minute wave i below 2,847.65.
Draw a channel about primary wave B using Elliott’s technique for a correction. Draw the first trend line from the start of intermediate wave (A) to the end of intermediate wave (B), then place a parallel copy on the end of intermediate wave (A). If this wave count is correct, then the lower edge of the channel should provide support. If this channel is breached by downwards movement, then the probability of this wave count would be reduced.
HOURLY CHART – COMBINATION OR FLAT
Click chart to enlarge.
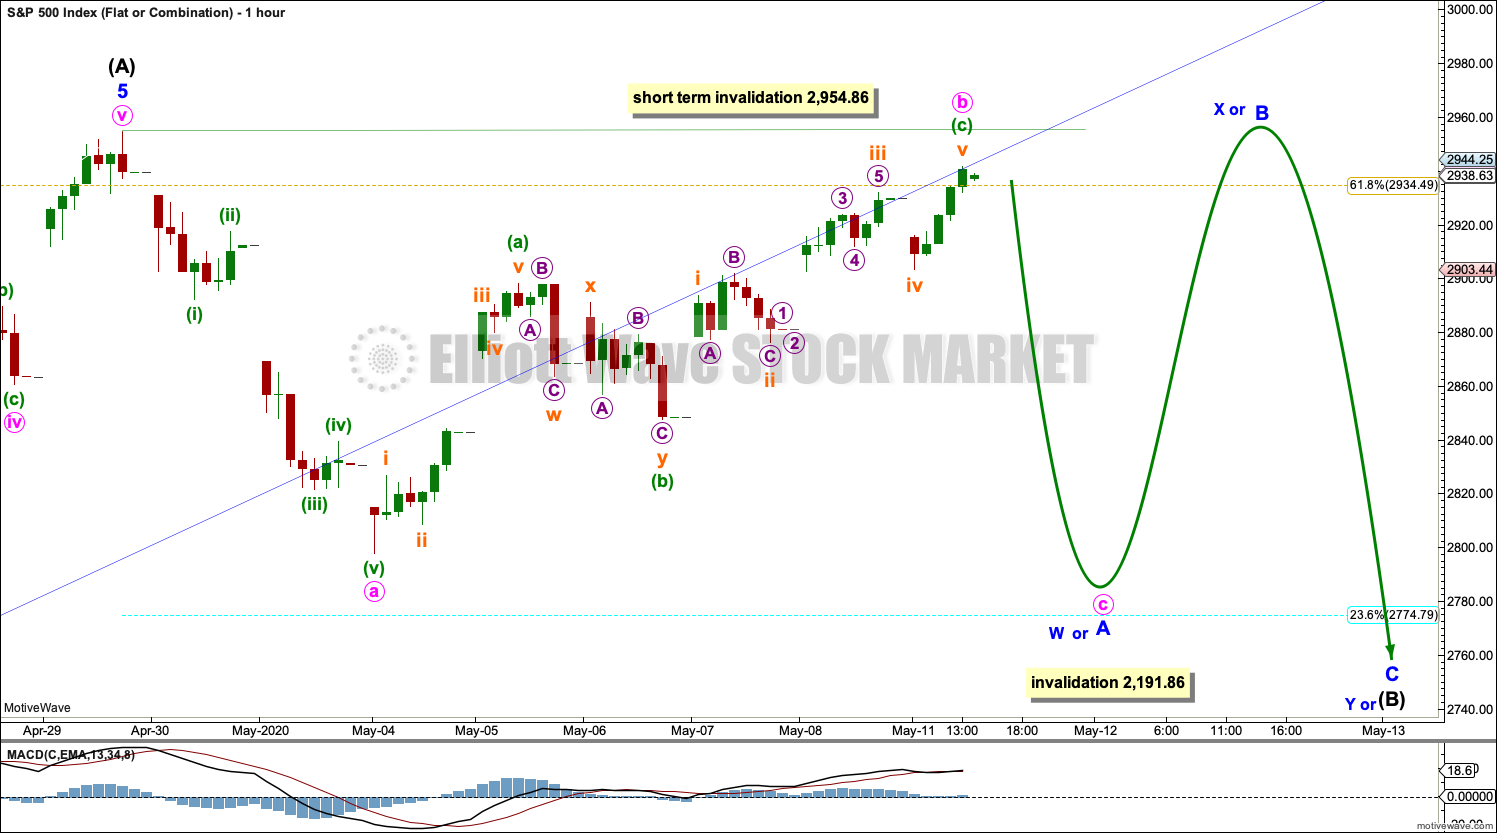
If analysis of intermediate wave (A) as a five wave structure is correct, then intermediate wave (B) may not move beyond the start of intermediate wave (A) below 2,191.86.
At this stage, analysis will now focus on identifying when intermediate wave (B) may be complete rather than trying to identify each swing within it, and the first alternate wave count above considers today the possibility that intermediate wave (B) may be complete.
B waves within B waves exhibit the greatest variety in Elliott wave structure and price behaviour. They are usually complicated time consuming sideways consolidations with choppy swings from resistance to support and back again. They may also be surprisingly quick sharp pullbacks or bounces. This Elliott wave count expects the breakout to be upwards when intermediate wave (B) is complete.
Intermediate wave (B) may be any one of more than 23 Elliott wave corrective structures. It would most likely be a combination, triangle or flat correction, but it may also be a relatively quick sharp zigzag.
This hourly chart considers the possibility of a combination or flat correction.
If intermediate wave (B) subdivides as a flat, then within it minor wave A must subdivide as a three, most likely a zigzag, which may be incomplete. Minute wave b, within a zigzag for minor wave A, may not move beyond the start of minute wave a above 2,954.86. When minor wave A may be complete, then minor wave B must subdivide as a three, must retrace a minimum 0.9 length of minor wave A, and may make a new high above the start of minor wave A as in an expanded flat correction.
If intermediate wave (B) subdivides as a combination, then within it minor wave W may be an incomplete zigzag. Minute wave b, within the zigzag of minor wave W, may not move beyond the start of minute wave a above 2,954.86. When minor wave W may be complete, then minor wave X must subdivide as a three in the opposite direction. Minor wave X has no minimum required length in relation to minor wave W and may make a new high above the start of minor wave W.
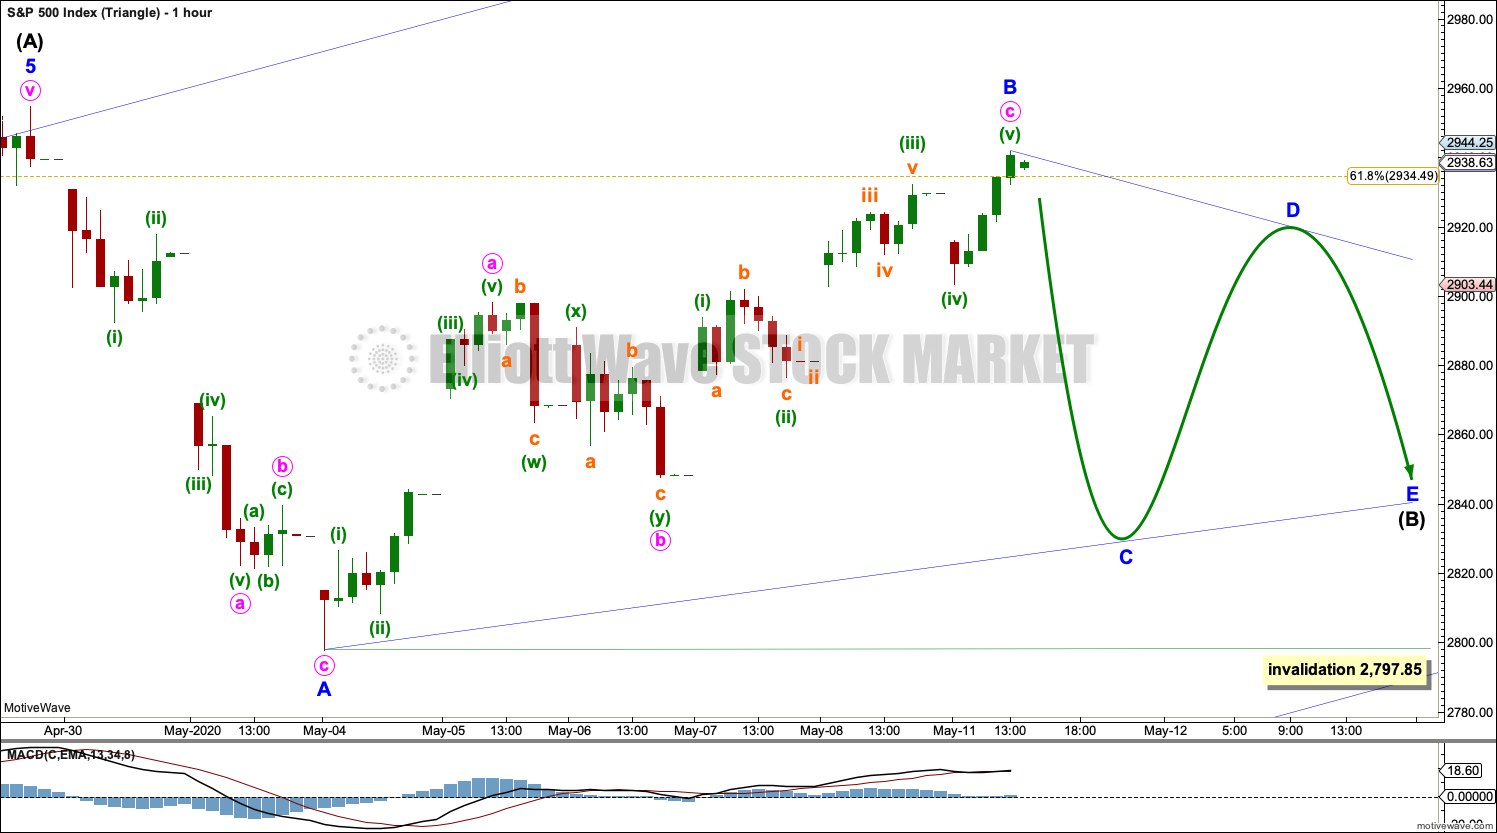
HOURLY CHART – TRIANGLE
Click chart to enlarge.
This wave count moves the degree of labelling within the last downwards wave up one degree, and looks at the possibility that it may have subdivided as a zigzag.
If a zigzag is compete at the last low, then this may be minor wave A of a triangle. Minor wave B may be now a complete single zigzag, or it may move higher. Minor wave B may make a new high above the start of minor wave A at 2,954.86 as in a running triangle.
Bullish divergence this week between price and both of inverted VIX and the AD line suggests minor wave B may move higher.
Minor wave C may not move beyond the end of minor wave A below 2,797.85.
Minor wave D may not move beyond the end of minor wave B.
Minor wave E may not move beyond the end of minor waev C.
A triangle may see price continue sideways in an ever decreasing range for another two or so weeks.
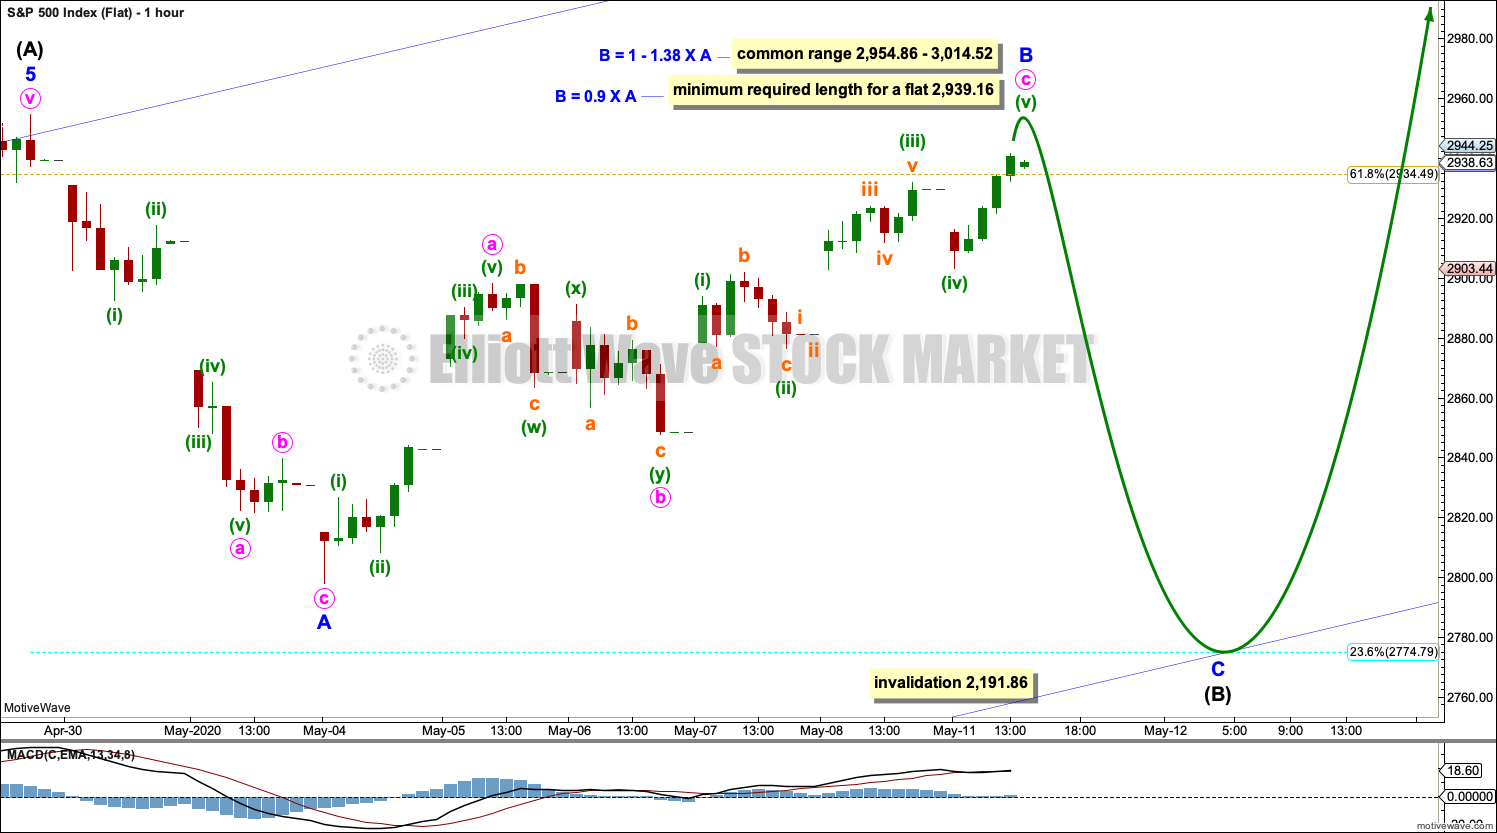
HOURLY CHART – FLAT
Click chart to enlarge.
This wave count moves the degree of labelling within the last downwards wave up one degree, and looks at the possibility that it may have subdivided as a zigzag.
If a zigzag downwards is complete, then this may be minor wave A within a flat correction for intermediate wave (B).
Minor wave B may be continuing higher as a single zigzag. The minimum required length for minor wave B would be 0.9 the length of minor wave A at 2,939.16; this price point has now been met.
Bullish divergence this week between price and both of inverted VIX and the AD line support this wave count.
When minor wave B may be complete, then the Fibonacci ratio between minor waves A and C may be used to calculate a target for minor wave C to end. That cannot be done yet. Minor wave C would be very likely to make at least a slight new low below the end of minor wave A at 2,797.85 to avoid a truncation.
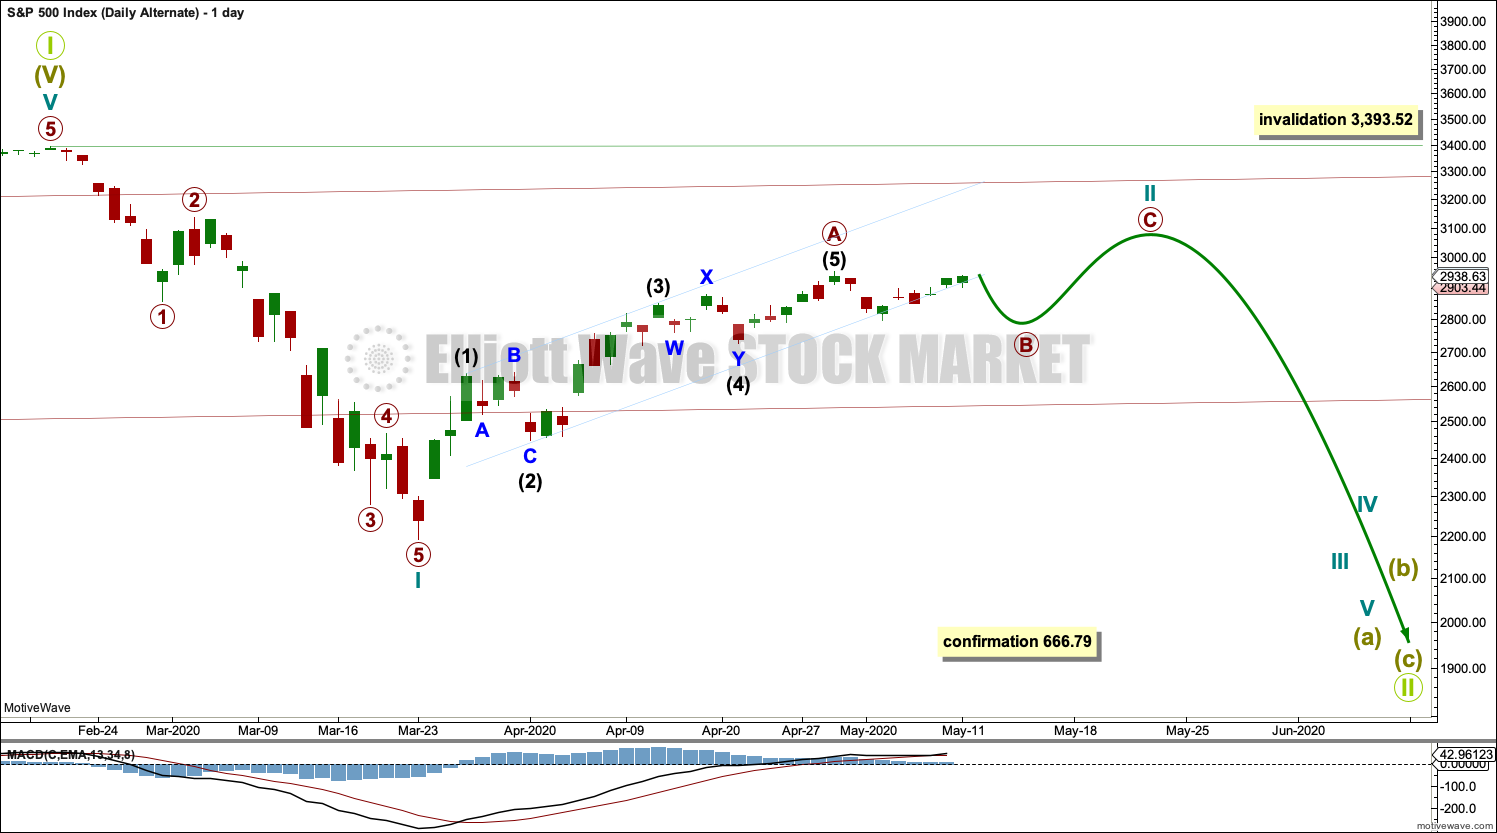
ALTERNATE DAILY CHART
Click chart to enlarge.
This alternate daily chart follows the Second Alternate Monthly chart published here. Video is here.
By simply moving the degree of labelling in the bull market beginning March 2009 up one degree, it is possible that a Grand Super Cycle trend change occurred on February 19, 2020.
A correction at Grand Super Cycle degree may be expected to last at least a decade, possibly longer. Corrections for this market tend to be much quicker than bullish moves, and so a fair amount of flexibility is required in expectations for duration of the different degrees.
Grand Super Cycle II would most likely subdivide as a zigzag, although it may be any corrective structure except a triangle. It should begin with a five down at the weekly chart time frame, which would be incomplete.
The first wave down on the daily chart is labelled cycle wave I. If this degree of labelling is wrong, it may be too high; it may need to be moved down one degree.
Following cycle wave I, cycle wave II may be continuing higher as a zigzag. Cycle wave II may not move beyond the start of cycle wave I above 3,393.52.
When cycle wave II may again be complete, then a target for cycle wave III may be calculated.
ALTERNATE HOURLY CHART
Click chart to enlarge.
Cycle wave II may be a continuing higher as a single zigzag. Primary wave B within the zigzag may be about halfway through, or it may be complete. All hourly wave counts for the main daily chart work in the same way for this alternate.
TECHNICAL ANALYSIS
WEEKLY CHART
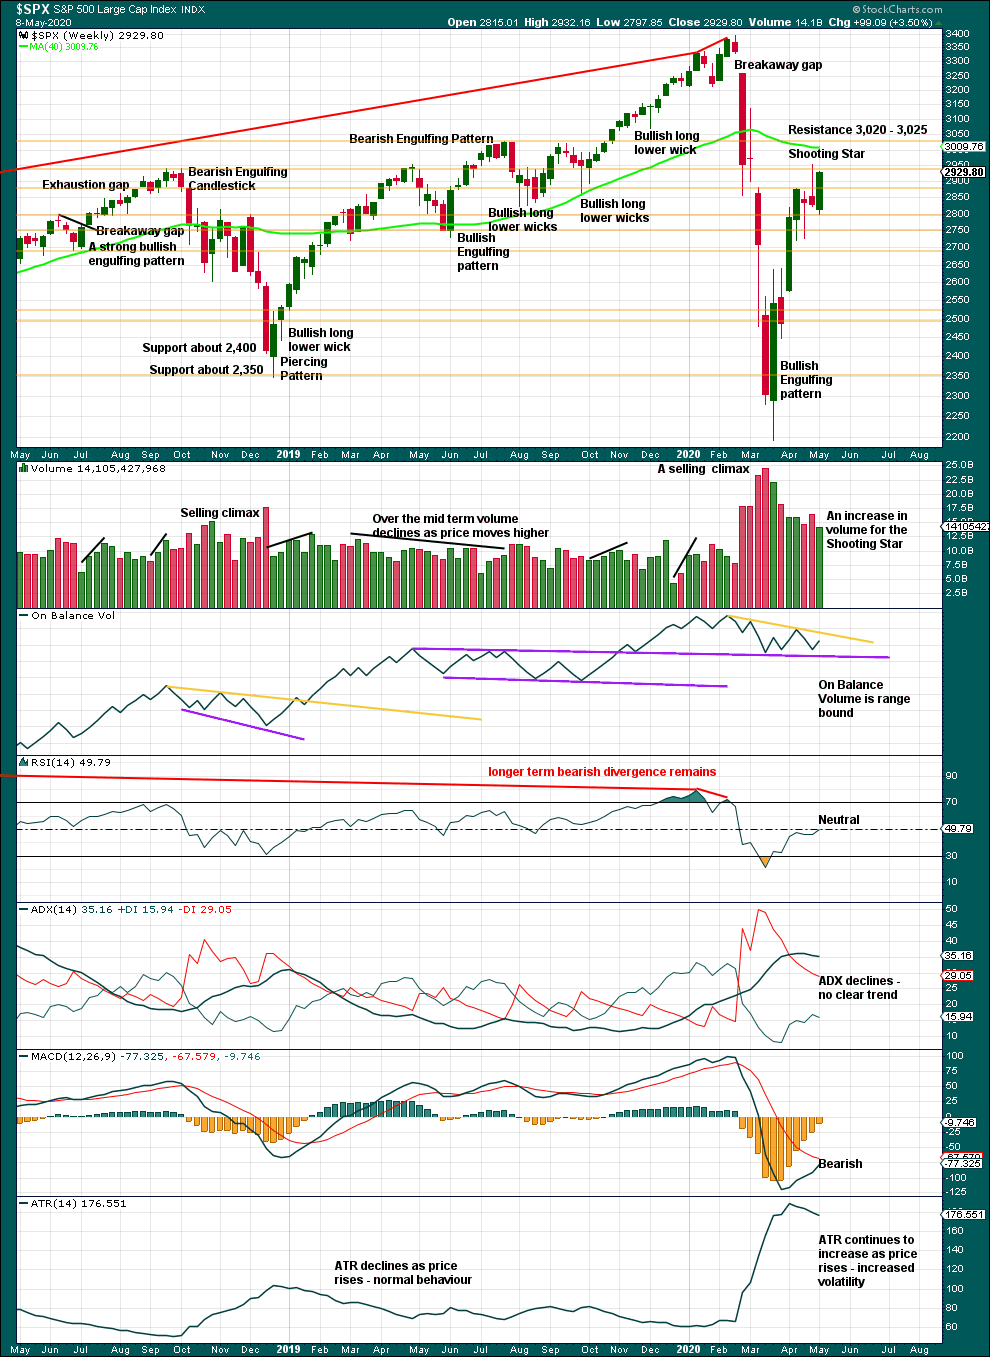
Click chart to enlarge. Chart courtesy of StockCharts.com.
The Shooting Star pattern warns of a trend change here to either down or sideways.
A downwards week closes green. Volume does not support upwards movement within the week. Overall, this week saw price move sideways.
DAILY CHART
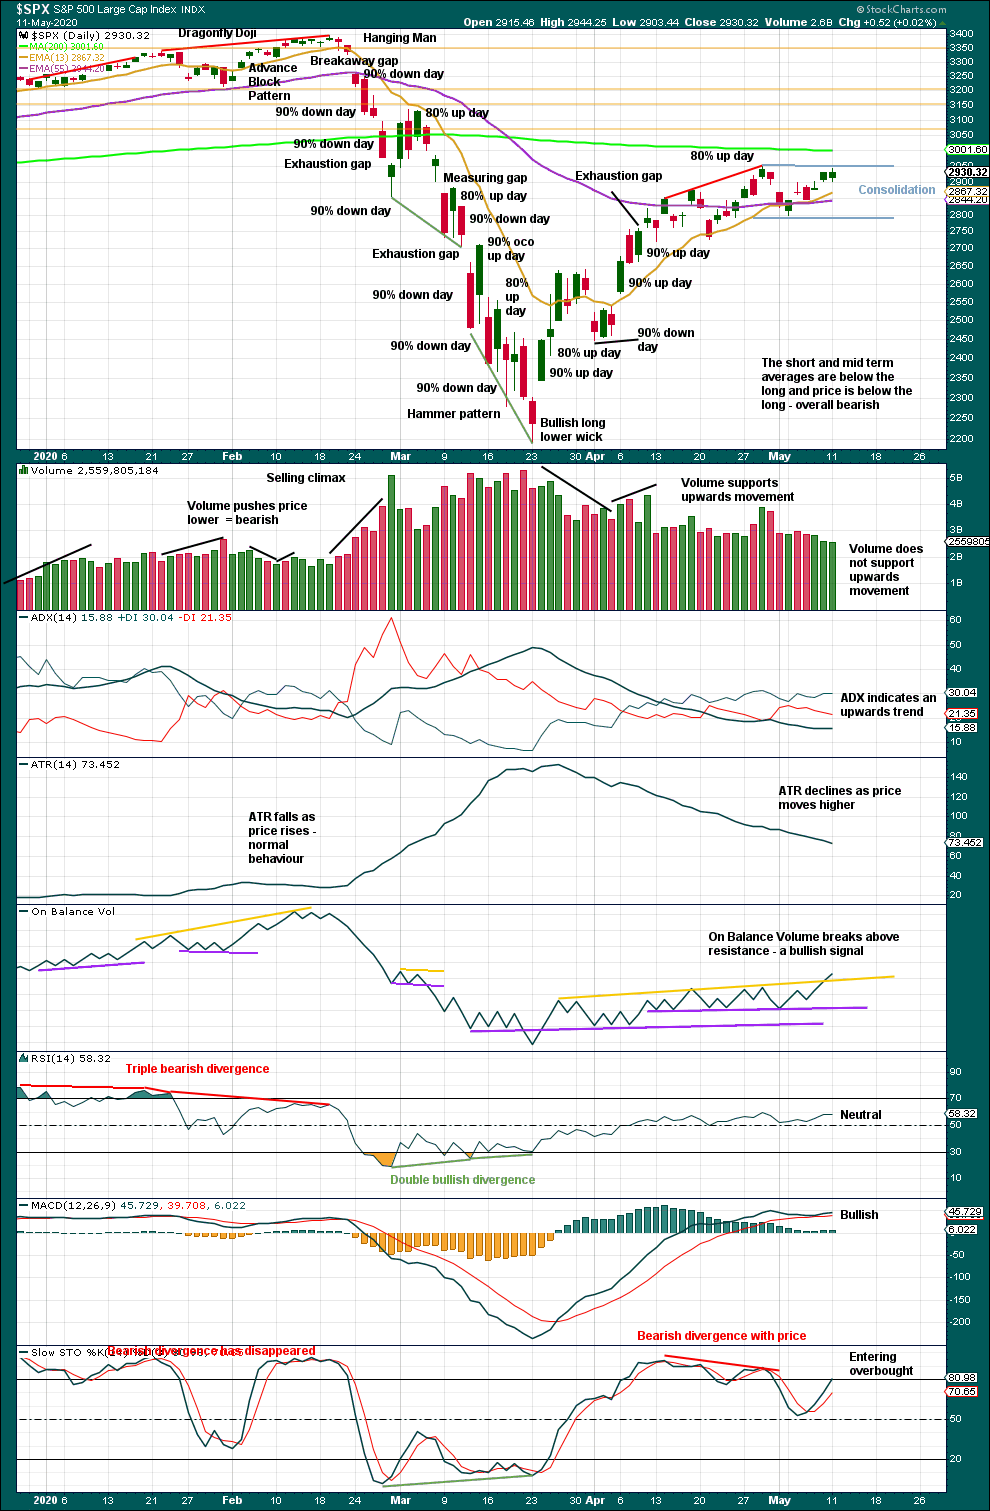
Click chart to enlarge. Chart courtesy of StockCharts.com.
In the bear market from October 2000 to March 2009, the first multi-day bounce retraced 0.73 of the first wave down. In the bear market from March 2000 to October 2002, the first multi-day bounce retraced 0.89 of the first wave down. So far this current bounce has retraced 0.63 of the first wave down, so it seems reasonable that it could continue higher.
To see what signals may be looked for to identify a high, the two previous large bear markets were analysed in end of week analysis. The DotCom crash was analysed here with video here. The Global Financial Crisis was also analysed here with video here.
There is now a bearish reversal pattern on the weekly chart but not the daily chart. It is now technically possible that the bounce is over, but the Elliott wave count sees the bounce as an incomplete structure.
Price remains range bound with resistance about 2,950 and support about 2,800. A breakout from this range is required for confidence in the next direction for price.
The bullish signal from On Balance Volume has strong technical significance; the breach is clear and the trend line has been tested 5 times.
BREADTH – AD LINE
WEEKLY CHART
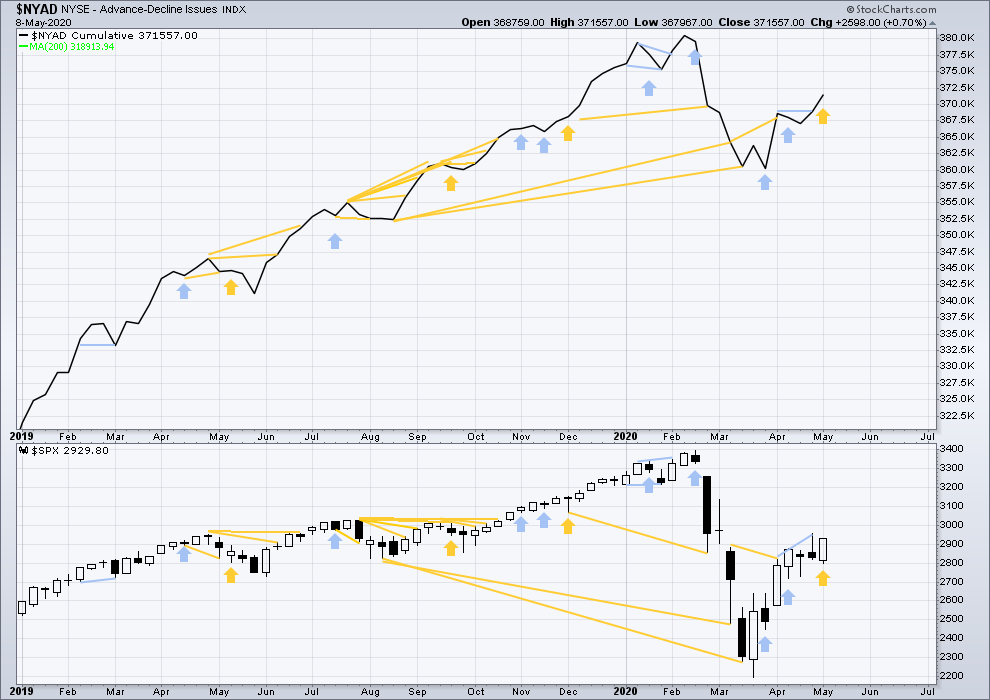
Click chart to enlarge. Chart courtesy of StockCharts.com. So that colour blind members are included, bearish signals will be noted with blue and bullish signals with yellow.
Breadth should be read as a leading indicator.
Last week price has moved lower with a lower low and a lower high, although the candlestick has closed green. The AD line has moved higher. This is a single week instance of bullish divergence.
Large caps all time high: 3,393.52 on 19th February 2020.
Mid caps all time high: 2,109.43 on 20th February 2020.
Small caps all time high: 1,100.58 on 27th August 2018.
DAILY CHART
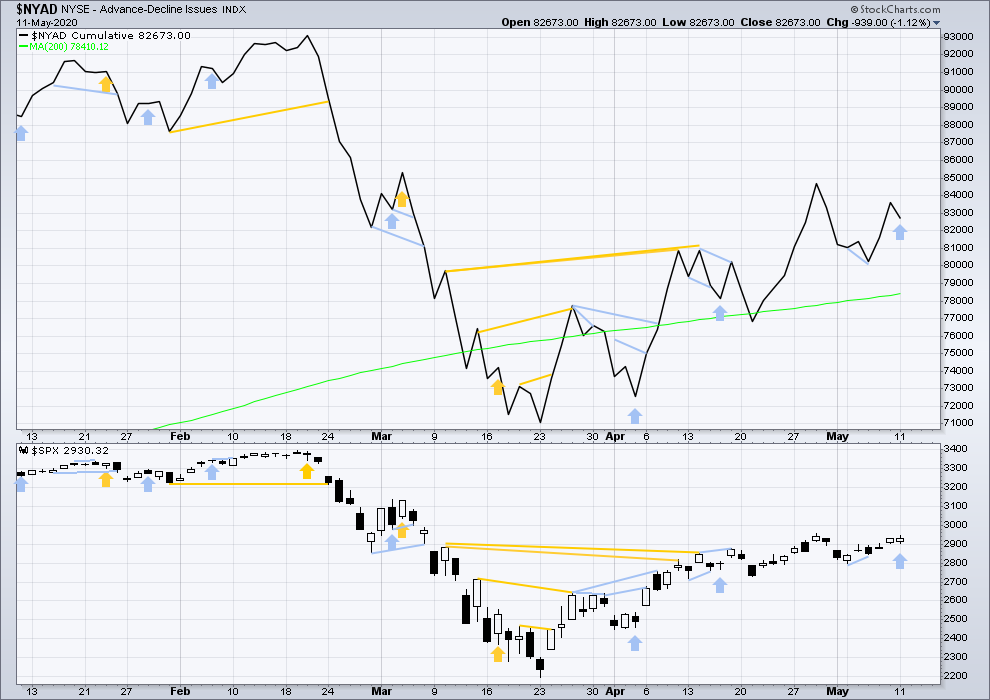
Click chart to enlarge. Chart courtesy of StockCharts.com. So that colour blind members are included, bearish signals will be noted with blue and bullish signals with yellow.
Today price has moved higher, but the AD line has moved lower. This divergence is bearish.
VOLATILITY – INVERTED VIX CHART
WEEKLY CHART
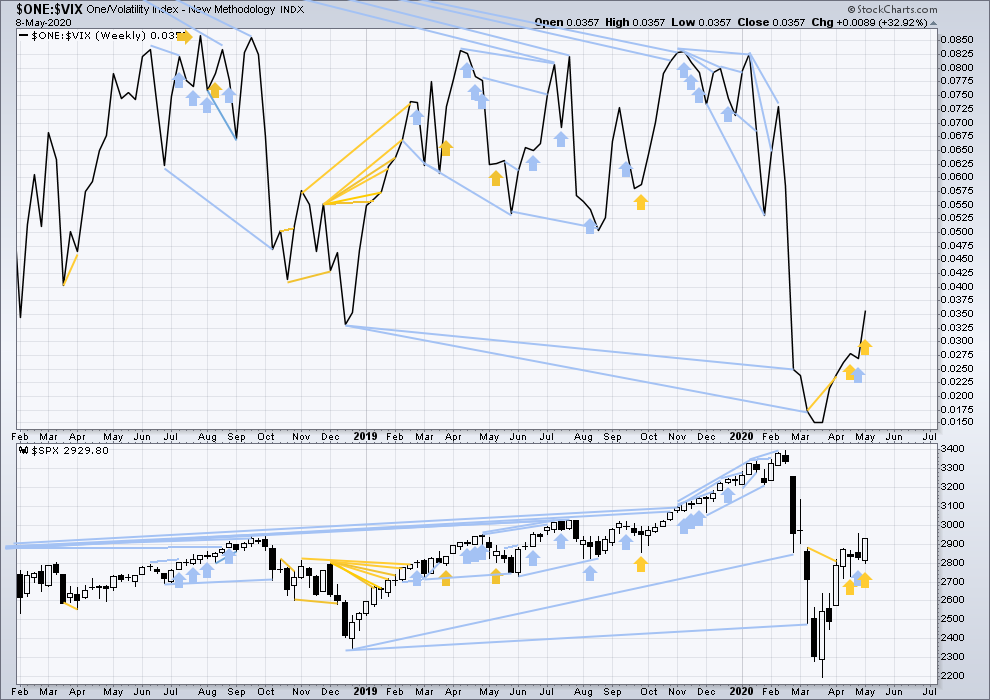
Click chart to enlarge. Chart courtesy of StockCharts.com. So that colour blind members are included, bearish signals will be noted with blue and bullish signals with yellow.
Last week price has moved lower with a lower low and a lower high although the candlestick has closed green. Inverted VIX has moved higher. This is a week of single instance bullish divergence.
DAILY CHART
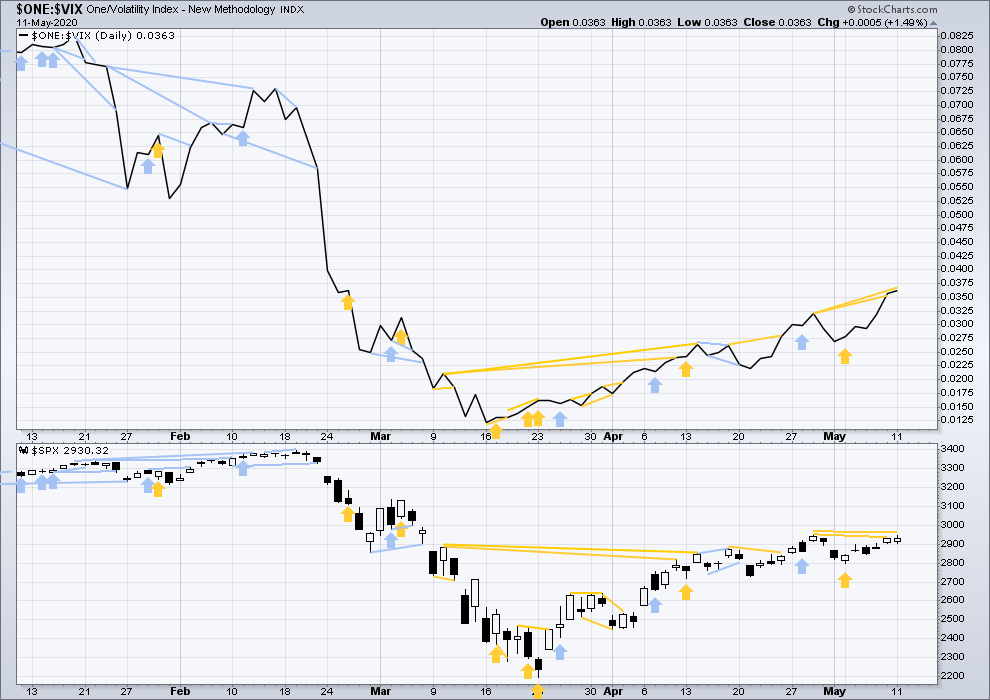
Click chart to enlarge. Chart courtesy of StockCharts.com. So that colour blind members are included, bearish signals will be noted with blue and bullish signals with yellow.
Both price and inverted VIX have moved higher. Inverted VIX has made another new short-term high, but price has not. This divergence is bullish.
DOW THEORY
Dow Theory has confirmed a bear market with the following lows made on a closing basis:
DJIA: 21,712.53 – a close below this point has been made on the March 12, 2020.
DJT: 8,636.79 – a close below this point has been made on March 9, 2020.
Adding in the S&P and Nasdaq for an extended Dow Theory, a bear market has now been confirmed:
S&P500: 2,346.58 – a close below this point has now been made on March 20, 2020.
Nasdaq: 7,292.22 – a close below this point was made on the March 12, 2020.
Published @ 08:00 p.m. EST.
—
Careful risk management protects your trading account(s).
Follow my two Golden Rules:
1. Always trade with stops.
2. Risk only 1-5% of equity on any one trade.
—
New updates to this analysis are in bold.