
S&P 500: Elliott Wave and Technical Analysis | Charts – April 13, 2020
A small range downwards day remains above the short-term invalidation point and within the best fit channel. The Elliott wave count remains the same.
Summary: The bounce may end about 2,934 this week. If this target is wrong, it may not be high enough; the first major bounce within a new bear market does tend to be fairly deep. A normal range would be from 3,069 to 3,261.
Thereafter, the downwards trend may resume with strength.
For the short term, if price breaks below the lower edge of the best fit channel on the hourly charts, then the bounce may be over and the downwards trend may have resumed.
The biggest picture, Grand Super Cycle analysis, is here.
Last monthly charts are here. Video is here. Members are encouraged to view all three monthly charts. The third is much more bearish than this main wave count and remains a valid possibility.
ELLIOTT WAVE COUNTS
WEEKLY CHART
Click chart to enlarge.
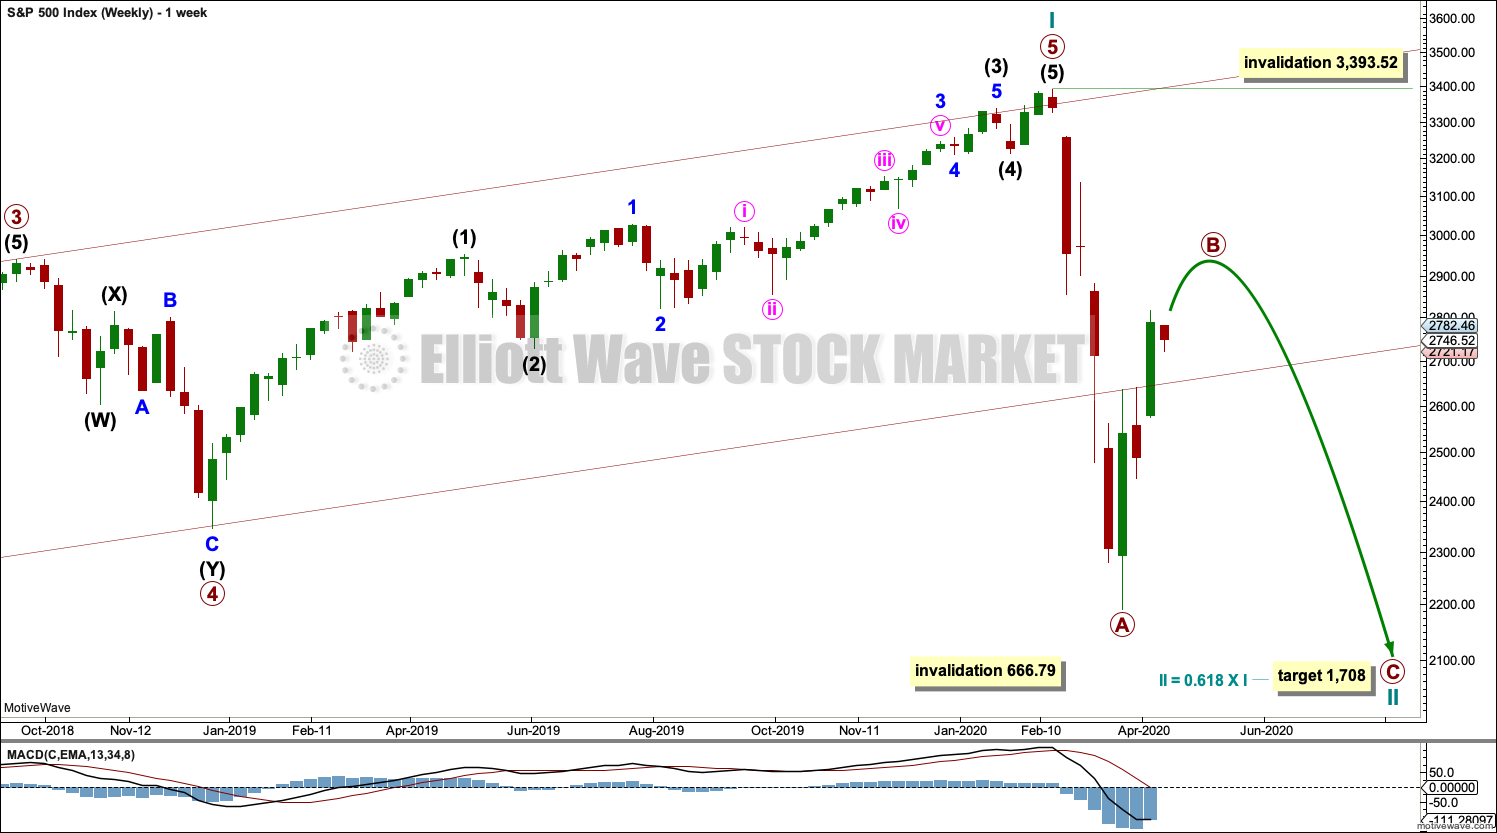
The channel is now breached by a full weekly candlestick below and not touching the lower edge. Further confidence in this wave count may be had. Price has closed below the lower edge of this channel.
Price has reached below the 0.382 Fibonacci ratio of cycle wave I at 2,352 on the last downwards movement. The structure of cycle wave II may need further to go to complete. The next Fibonacci ratio at 0.618 is now a preferred target for cycle wave II to end.
Cycle wave II would most likely subdivide as a zigzag; thus far that looks like what is unfolding. When primary waves A and B may both be complete, then the target may be calculated using a Fibonacci ratio between primary waves A and C. At that stage, the final target may change or widen to a zone.
Cycle wave II may not move beyond the start of cycle wave I below 666.79.
DAILY CHART
Click chart to enlarge.
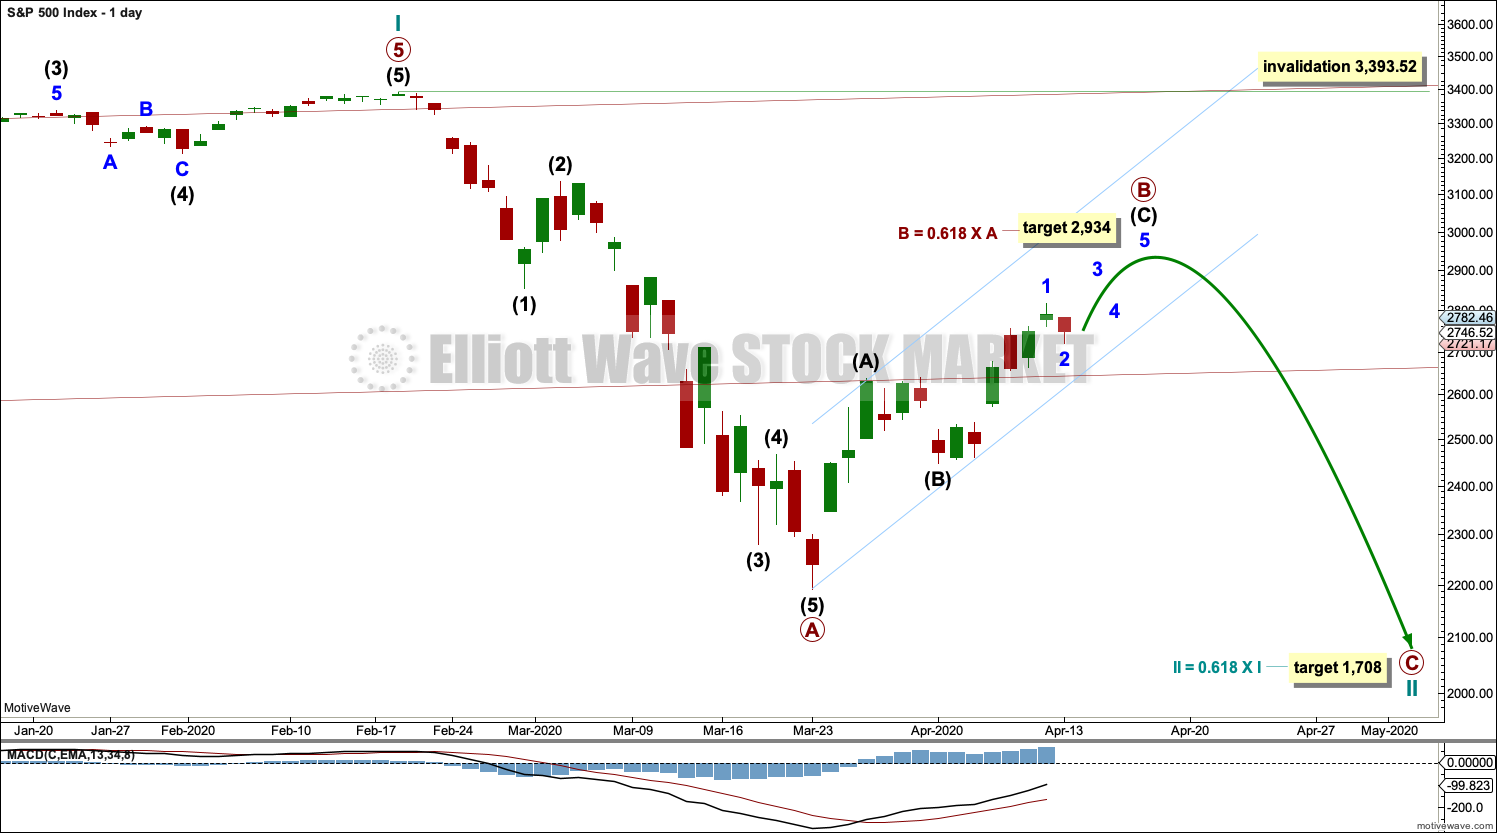
Draw the wide maroon trend channel carefully: draw the first trend line from the end of primary wave 1 at 2,093.55 (December 26, 2014), to the end of primary wave 3 at 2,940.91 (September 21, 2018), then place a parallel copy on the end of primary wave 2 at 1,810.10 (February 11, 2016). The channel is fully breached indicating a trend change from the multi-year bull trend to a new bear trend. Resistance at the lower edge has been overcome; price has closed above this trend line. Primary wave B may now end closer to the 0.618 Fibonacci ratio of primary wave A at 2,924.
Cycle wave II may subdivide as any Elliott wave corrective structure except a triangle. It would most likely be a zigzag. Primary wave A may be a complete five wave impulse. Primary wave B may not move beyond the start of primary wave A above 3,393.52.
HOURLY CHART – ZIGZAG
Click chart to enlarge.
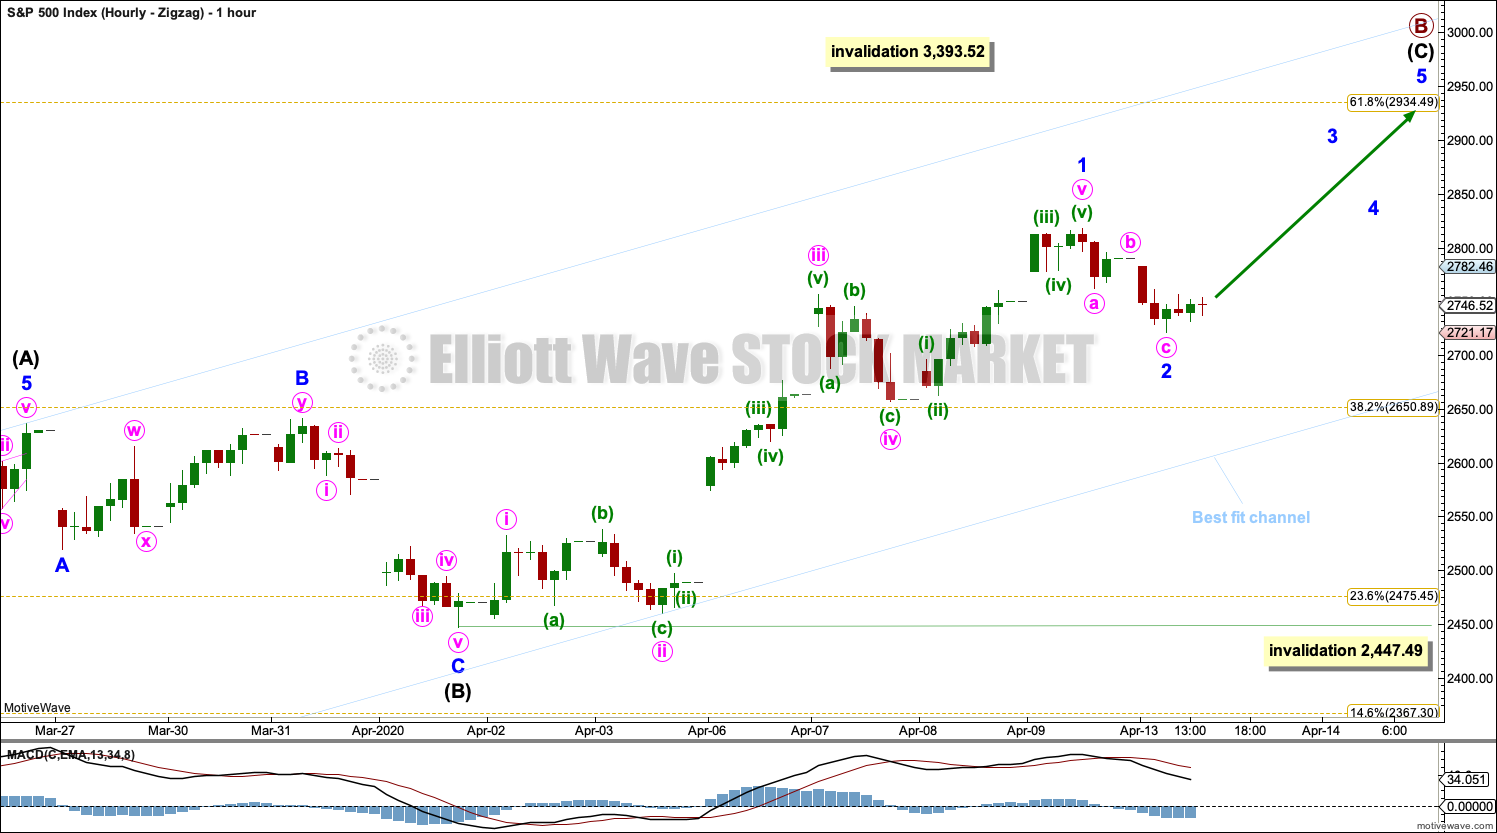
Primary wave B may be subdividing as a zigzag.
Within the zigzag: intermediate waves (A) and (B) may be complete.
Intermediate wave (C) may be unfolding as an impulse. Within the impulse: minor waves 1 and 2 may be complete and minor wave 3 may exhibit an increase in upwards momentum tomorrow.
HOURLY CHART – ZIGZAG II
Click chart to enlarge.
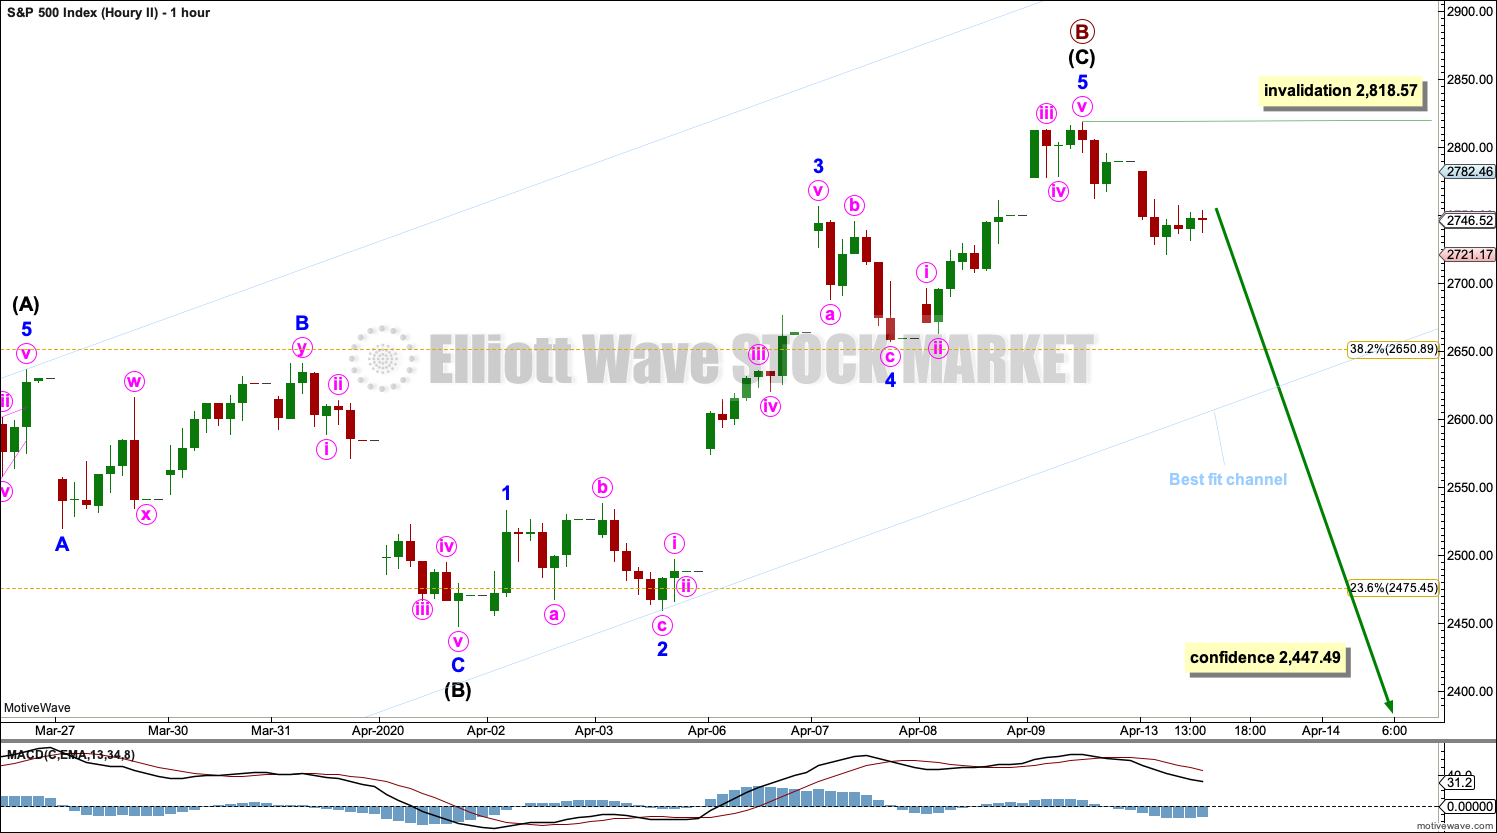
It is also possible to move the degree of labelling within intermediate wave (C) up one degree which would see the bounce complete. If price breaks below the lower edge of the channel, then this would become the main wave count prior to the confidence point being passed.
ALTERNATE DAILY CHART
Click chart to enlarge.
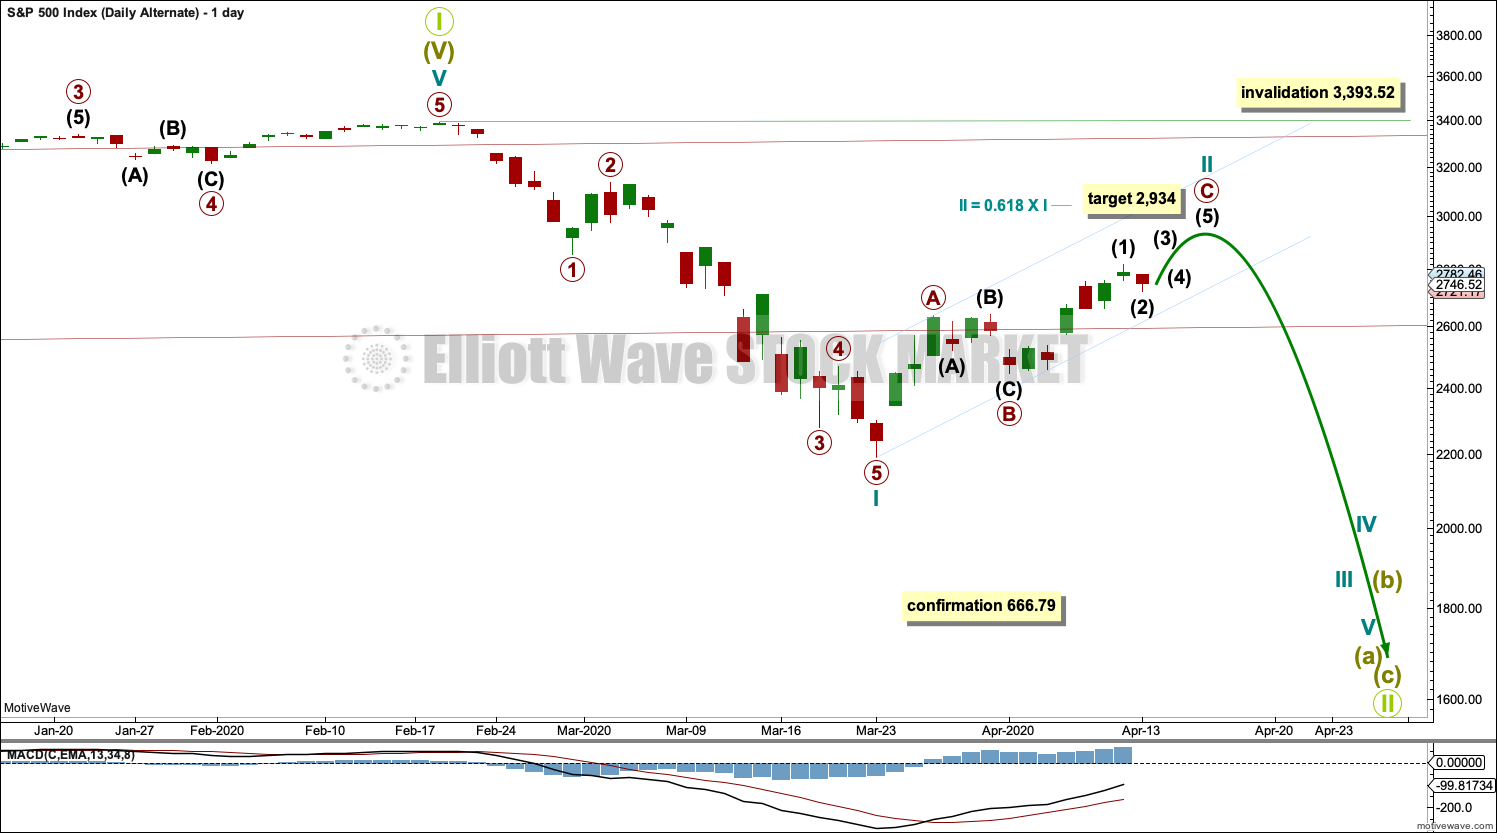
This alternate daily chart follows the Second Alternate Monthly chart published here. Video is here.
By simply moving the degree of labelling in the bull market beginning March 2009 up one degree, it is possible that a Grand Super Cycle trend change occurred on February 19, 2020.
A correction at Grand Super Cycle degree may be expected to last at least a decade, possibly longer. Corrections for this market tend to be much quicker than bullish moves, and so a fair amount of flexibility is required in expectations for duration of the different degrees.
Grand Super Cycle II would most likely subdivide as a zigzag, although it may be any corrective structure except a triangle. It should begin with a five down at the weekly chart time frame, which would be incomplete.
The first wave down on the daily chart is labelled cycle wave I. If this degree of labelling is wrong, it may be too high; it may need to be moved down one degree.
Following cycle wave I, cycle wave II may be continuing higher as a zigzag. Cycle wave II may not move beyond the start of cycle wave I above 3,393.52.
When cycle wave II may again be complete, then a target for cycle wave III may be calculated.
ALTERNATE HOURLY CHART
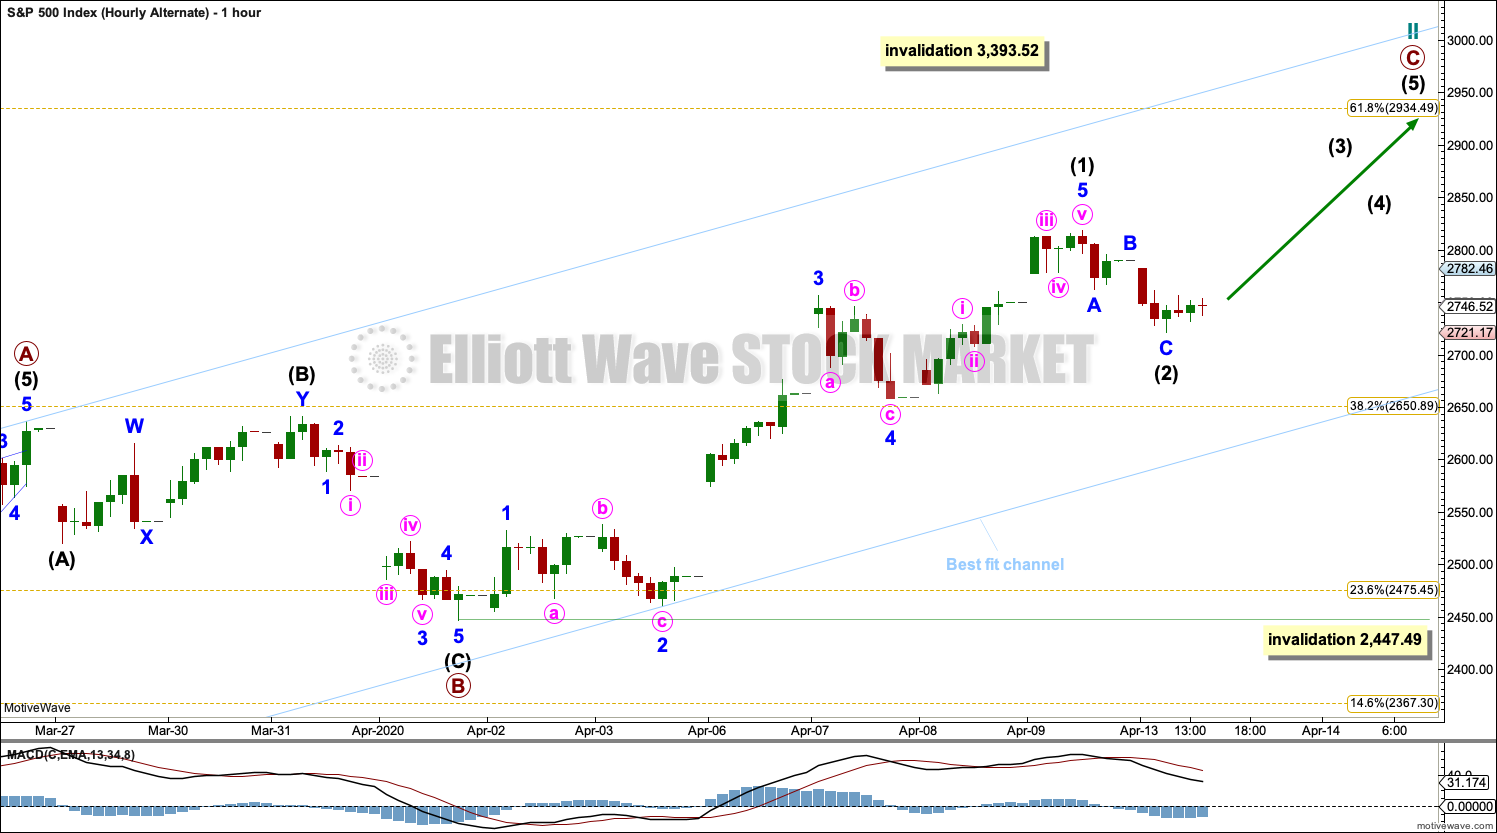
Click chart to enlarge.
Cycle wave II may be a continuing higher as a single zigzag. It may also be complete as per the second hourly chart above.
TECHNICAL ANALYSIS
WEEKLY CHART
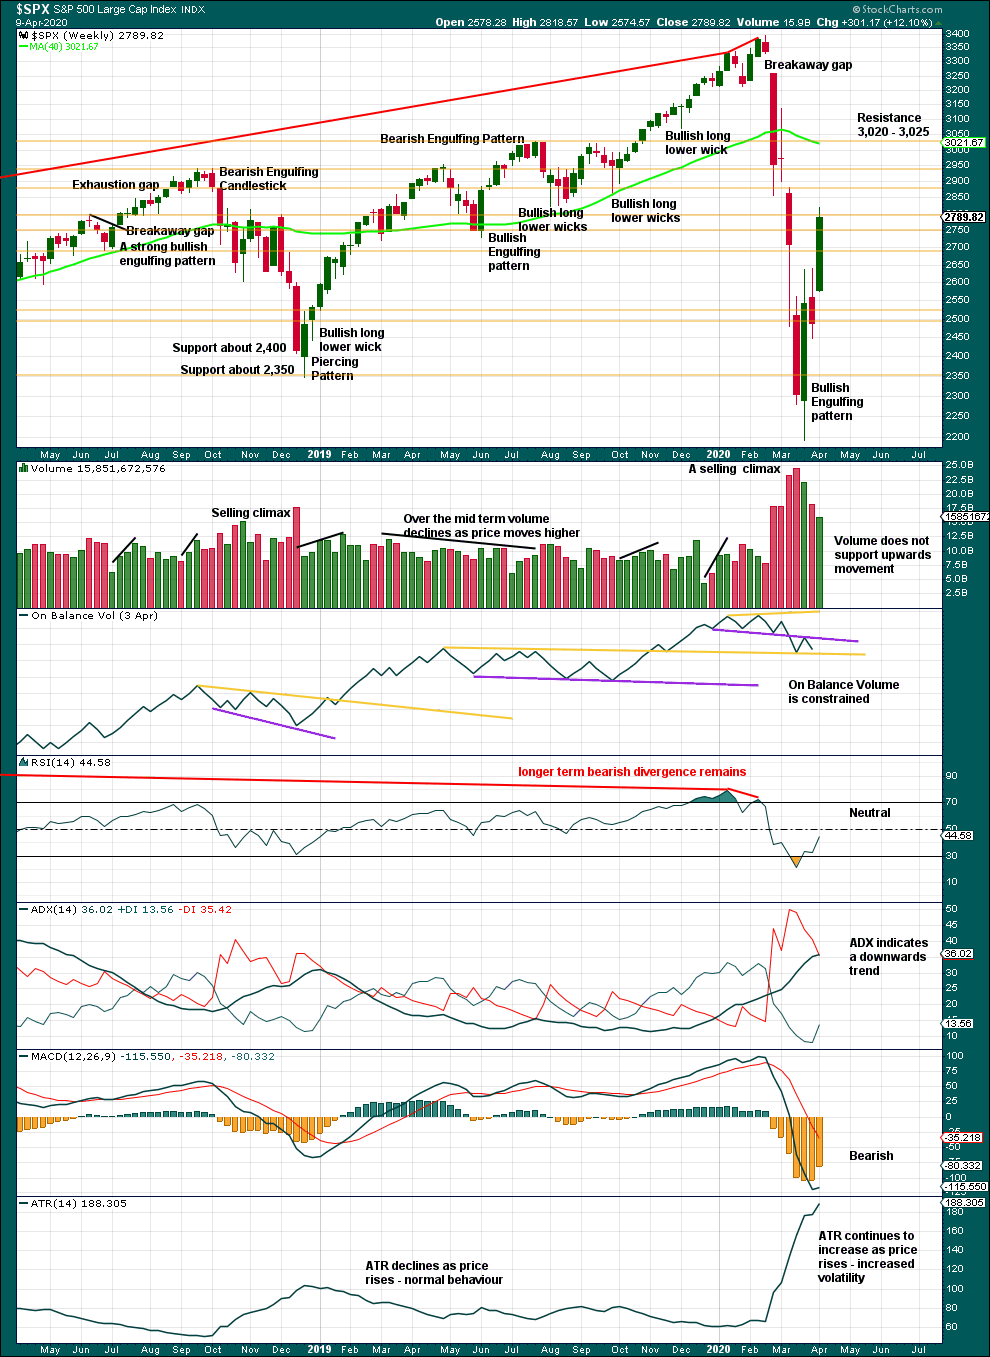
Click chart to enlarge. Chart courtesy of StockCharts.com.
The bounce has further relieved RSI. ADX is still not extreme; there is room for this trend to continue. Watch On Balance Volume carefully for a breakout, which may now happen next week.
DAILY CHART
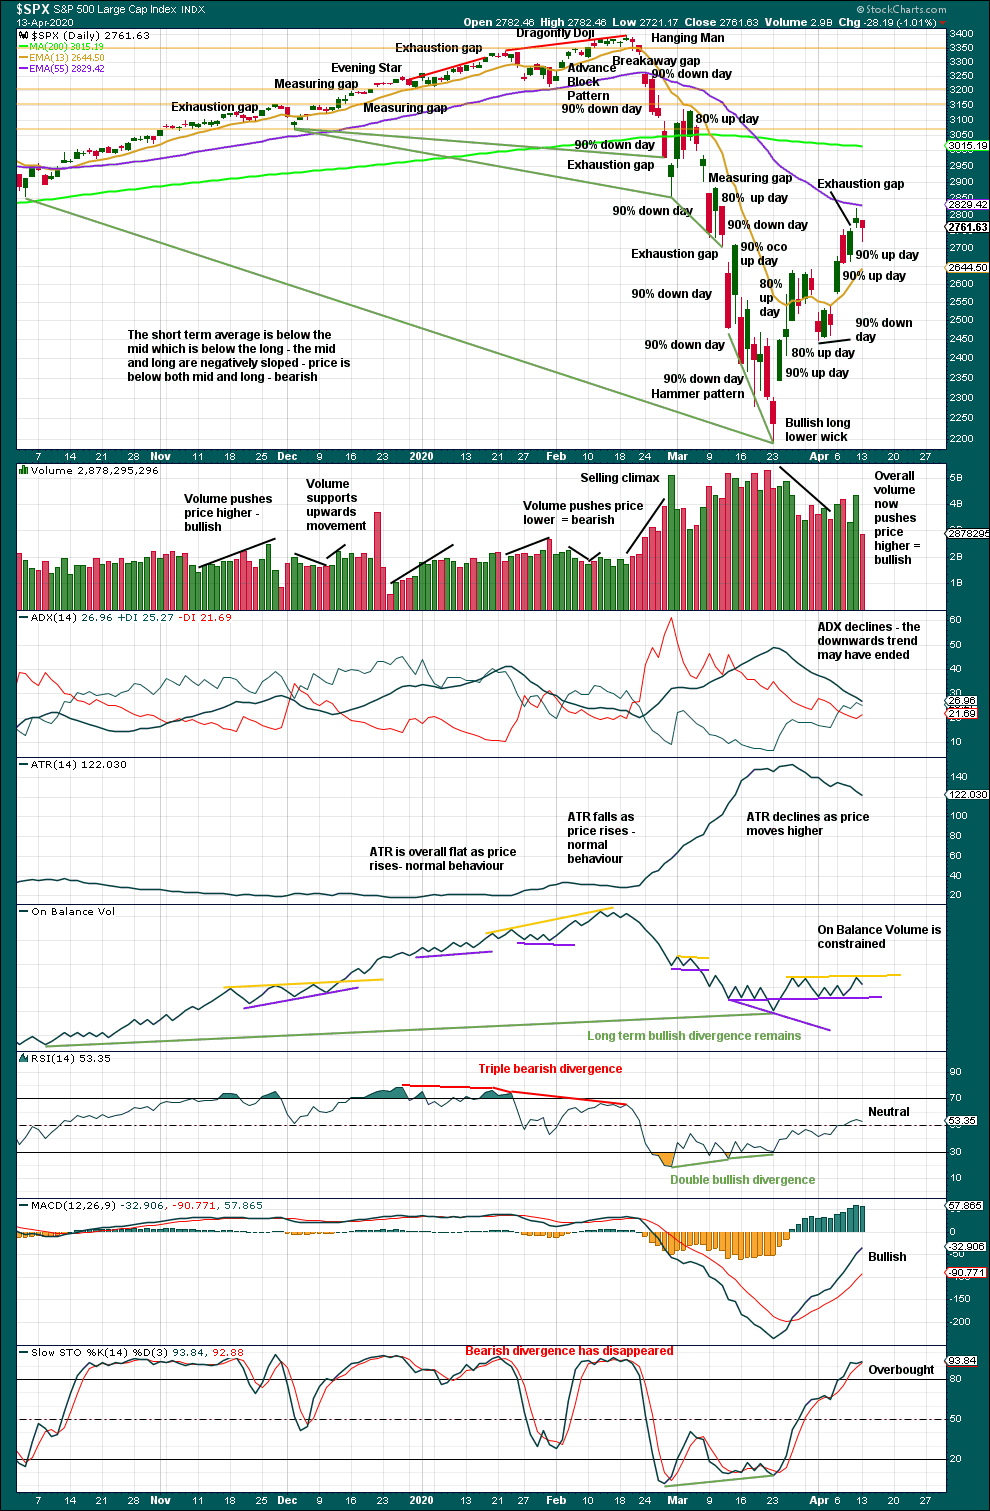
Click chart to enlarge. Chart courtesy of StockCharts.com.
The last gap is today closed, so it may be an exhaustion gap. However, there is no bearish candlestick reversal pattern to indicate the bounce is over. It would be reasonable to assume it may continue higher. The long lower wick on today’s candlestick is bullish.
Stochastics is now overbought; this bounce may end soon.
In the bear market from October 2000 to March 2009, the first multi-day bounce retraced 0.73 of the first wave down. In the bear market from March 2000 to October 2002, the first multi-day bounce retraced 0.89 of the first wave down. So far this current bounce has retraced 0.52 of the first wave down, so it seems reasonable that it could continue higher.
To see what signals may be looked for to identify a high, the two previous large bear markets were analysed in end of week analysis. The DotCom crash was analysed here with video here. The Global Financial Crisis was also analysed here with video here.
There is a great amount of strength off the low of 23rd of March. There are now three 90% up days and two back to back 80% up days. It looks technically possible that the 23rd of March may be a sustainable low and that price could be moving up to new all time highs in a sustainable bull market.
However, as compelling as that technical picture looks at this time, it would mean that the US stock market would be bullish while a pandemic unfolds in the country and the economy suffers greatly as a result. While this analysis is focussed on technical data, it would be rather obtuse to ignore the reality of a global pandemic that has shut borders and locked down economies world wide, and may still be in its early days.
If either price or the AD line make new all time highs, then a bull market would be seriously considered.
BREADTH – AD LINE
WEEKLY CHART
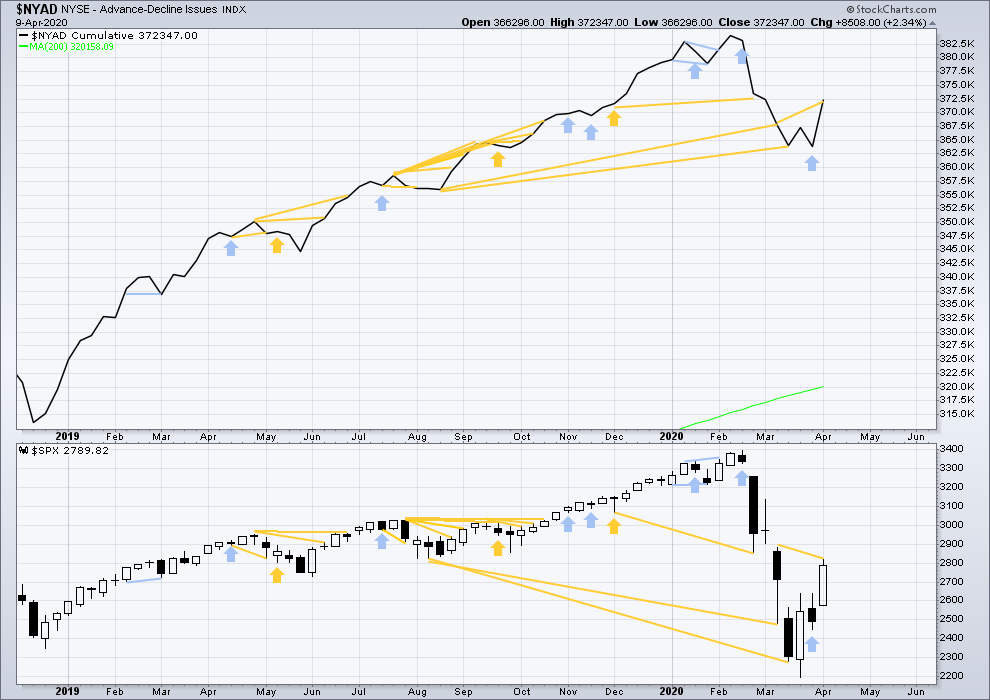
Click chart to enlarge. Chart courtesy of StockCharts.com. So that colour blind members are included, bearish signals will be noted with blue and bullish signals with yellow.
Bear markets from the Great Depression and onwards have been preceded by an average minimum of 4 months divergence between price and the AD line with only two exceptions in 1946 and 1976. With no divergence between the AD line and price at the last all time high, this current bear market now makes a third exception.
In all bear markets in the last 90 years there is some positive correlation (0.6022) between the length of bearish divergence and the depth of the following bear market. No to little divergence is correlated with more shallow bear markets. Longer divergence is correlated with deeper bear markets.
This bear market comes after no bearish divergence. It would more likely be shallow, but this is a statement of probability and not certainty. So far it is slightly more than the 0.382 Fibonacci ratio of the bull market it is correcting (beginning March 2009).
Last week both price and the AD line have moved higher. The AD line has made a new high above the prior week beginning 9th of March, but price has not. Breadth is now rising faster than price. This divergence is bullish.
Large caps all time high: 3,393.52 on 19th February 2020.
Mid caps all time high: 2,109.43 on 20th February 2020.
Small caps all time high: 1,100.58 on 27th August 2018.
DAILY CHART
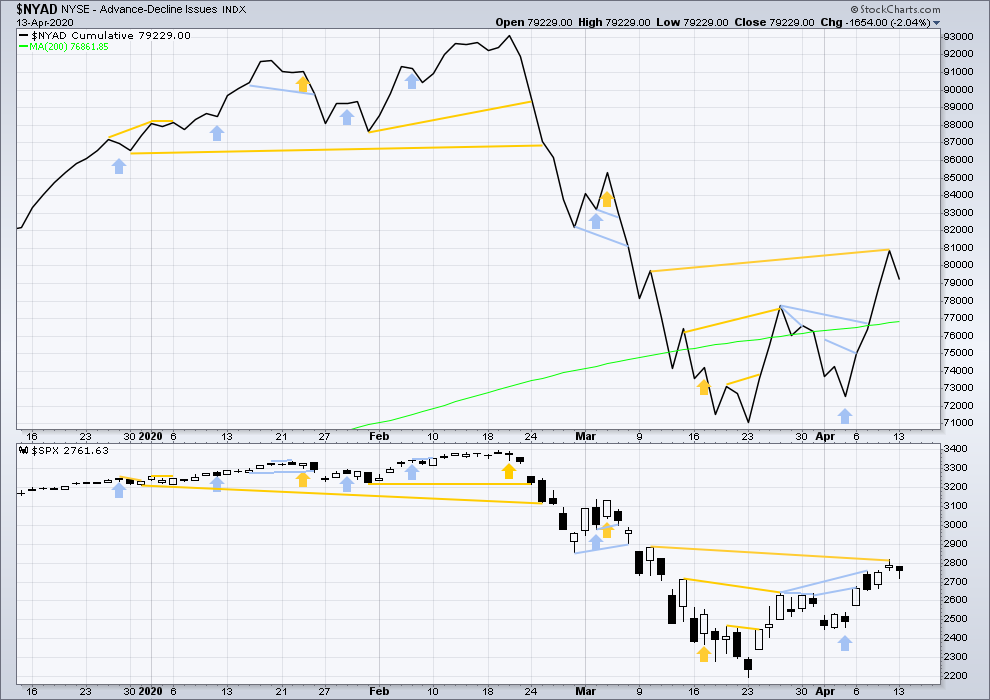
Click chart to enlarge. Chart courtesy of StockCharts.com. So that colour blind members are included, bearish signals will be noted with blue and bullish signals with yellow.
Breadth should be read as a leading indicator.
Today both price and the AD line have moved lower. Short-term bullish divergence at the last high one session ago remains.
VOLATILITY – INVERTED VIX CHART
WEEKLY CHART
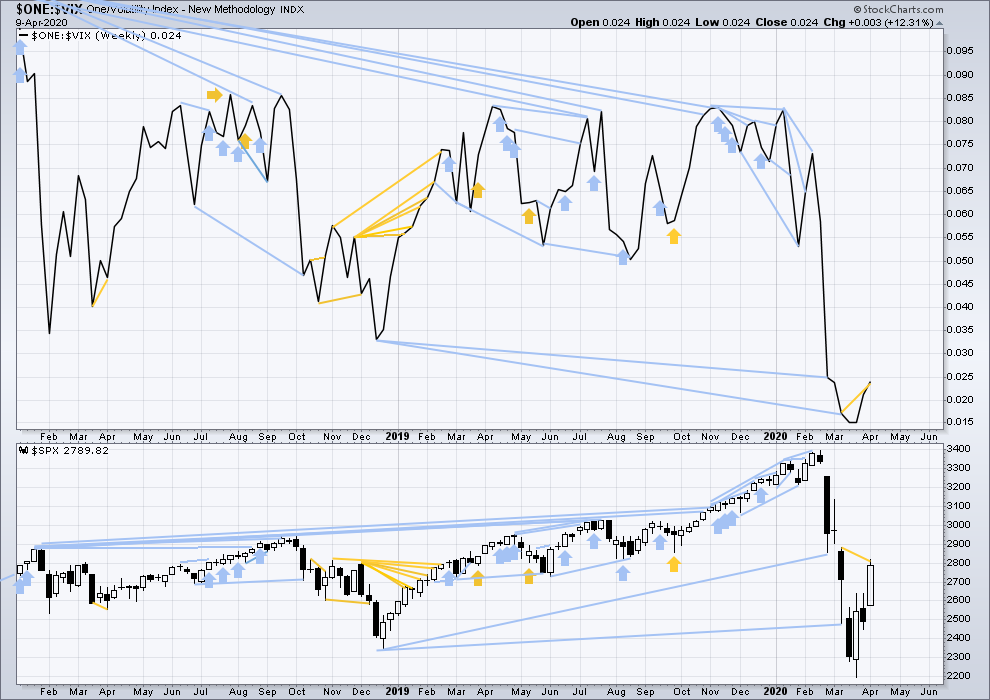
Click chart to enlarge. Chart courtesy of StockCharts.com. So that colour blind members are included, bearish signals will be noted with blue and bullish signals with yellow.
Last week both price and inverted VIX have moved higher. Inverted VIX has made a new high above the prior high of the 9th of March, but price has not. This divergence is bullish.
DAILY CHART
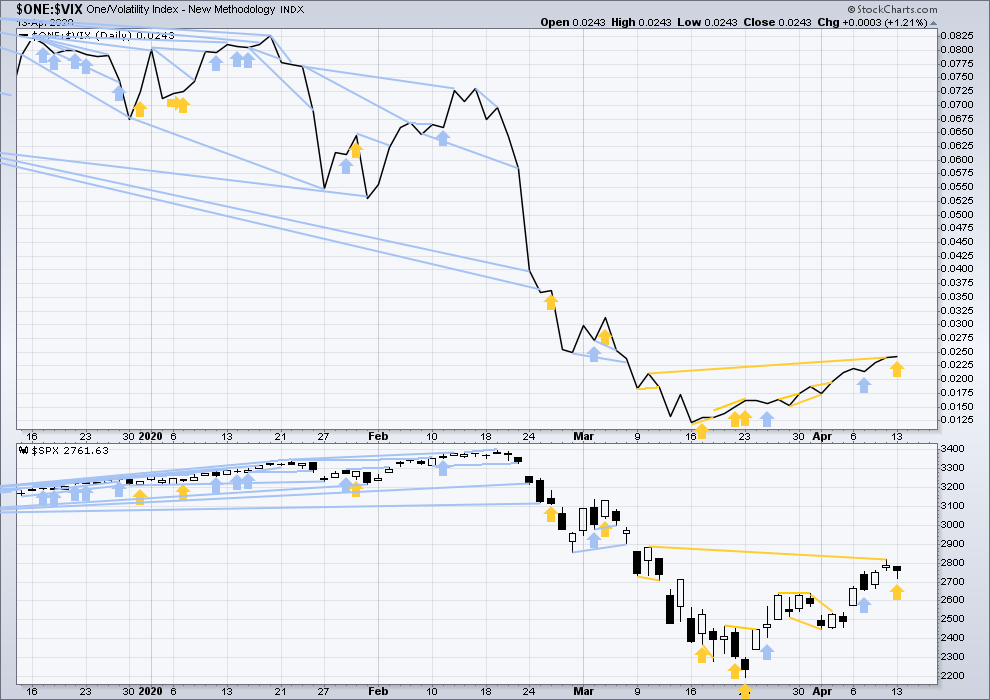
Click chart to enlarge. Chart courtesy of StockCharts.com. So that colour blind members are included, bearish signals will be noted with blue and bullish signals with yellow.
Today price has moved lower, but inverted VIX has moved very slightly higher. This divergence is bullish for the short term and adds to bullish divergence noted in last analysis.
DOW THEORY
Dow Theory has confirmed a bear market with the following lows made on a closing basis:
DJIA: 21,712.53 – a close below this point has been made on the March 12, 2020.
DJT: 8,636.79 – a close below this point has been made on March 9, 2020.
Adding in the S&P and Nasdaq for an extended Dow Theory, a bear market has now been confirmed:
S&P500: 2,346.58 – a close below this point has now been made on March 20, 2020.
Nasdaq: 7,292.22 – a close below this point was made on the March 12, 2020.
Published @ 08:50 p.m. EST.
—
Careful risk management protects your trading account(s).
Follow my two Golden Rules:
1. Always trade with stops.
2. Risk only 1-5% of equity on any one trade.
—
New updates to this analysis are in bold.