
Price continues to fall towards the short-term target.
Two short-term Elliott wave counts are used today to indicate when a bounce may have arrived. Invalidation of the first count indicates the alternate may be correct.
Summary: It may be safest to assume the downwards trend remains intact while price remains below 2,553.93. The short-term target remains at 2,173.
However, today completes a Hammer reversal pattern that comes while RSI exhibits triple bullish divergence, On Balance Volume has not confirmed new lows, and ADX is almost very extreme. Conditions are now set for a strong bounce. Be aware this market is vulnerable to large whipsaws.
A new high above 2,553.93 would provide some confidence that a multi-day to multi-week bounce may have arrived for primary wave B.
The final target is now at 1,708.
The biggest picture, Grand Super Cycle analysis, is here.
Last monthly charts are here with video here.
ELLIOTT WAVE COUNTS
MAIN WAVE COUNT
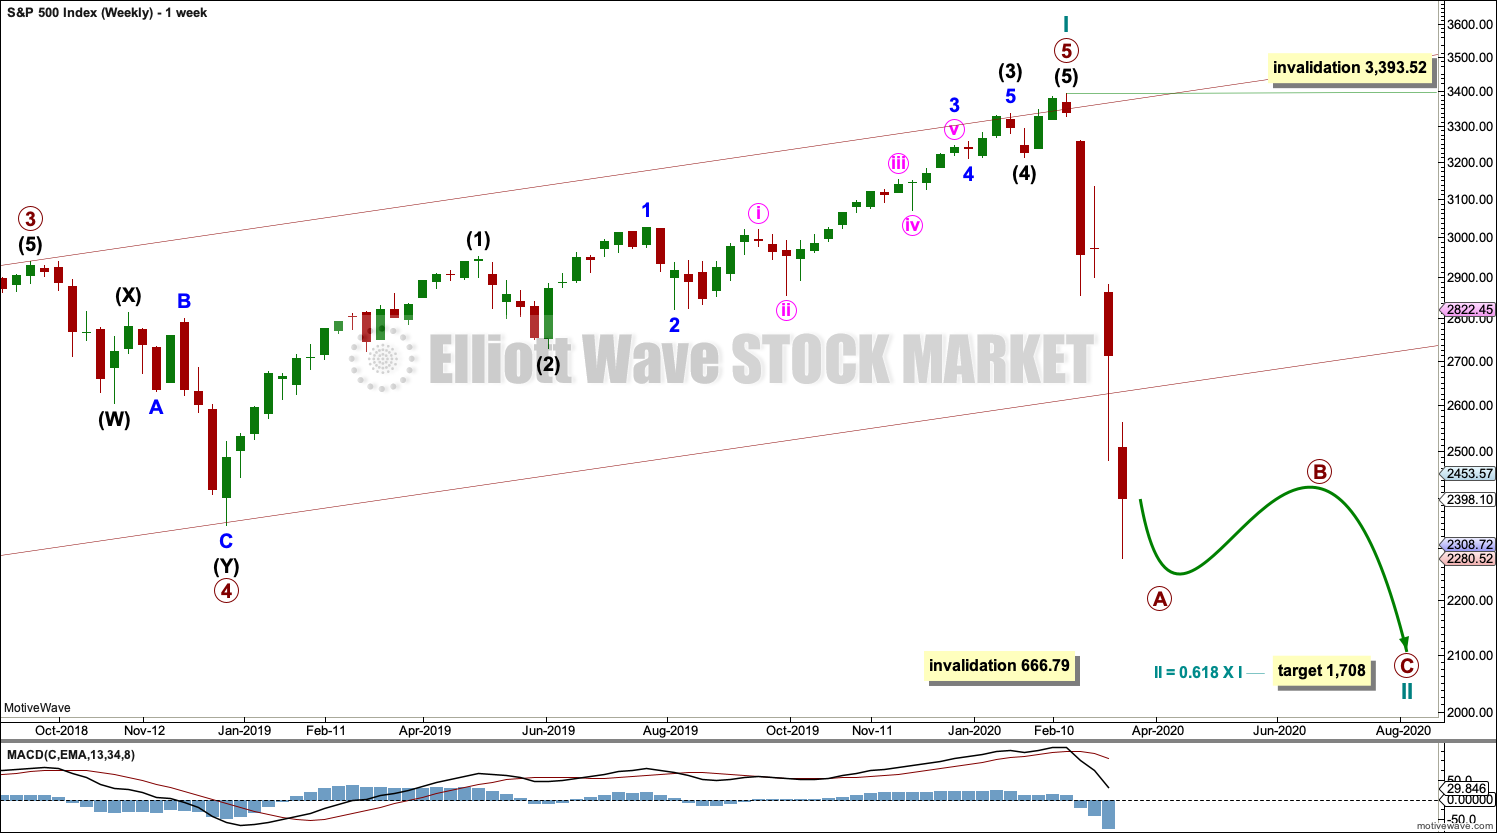
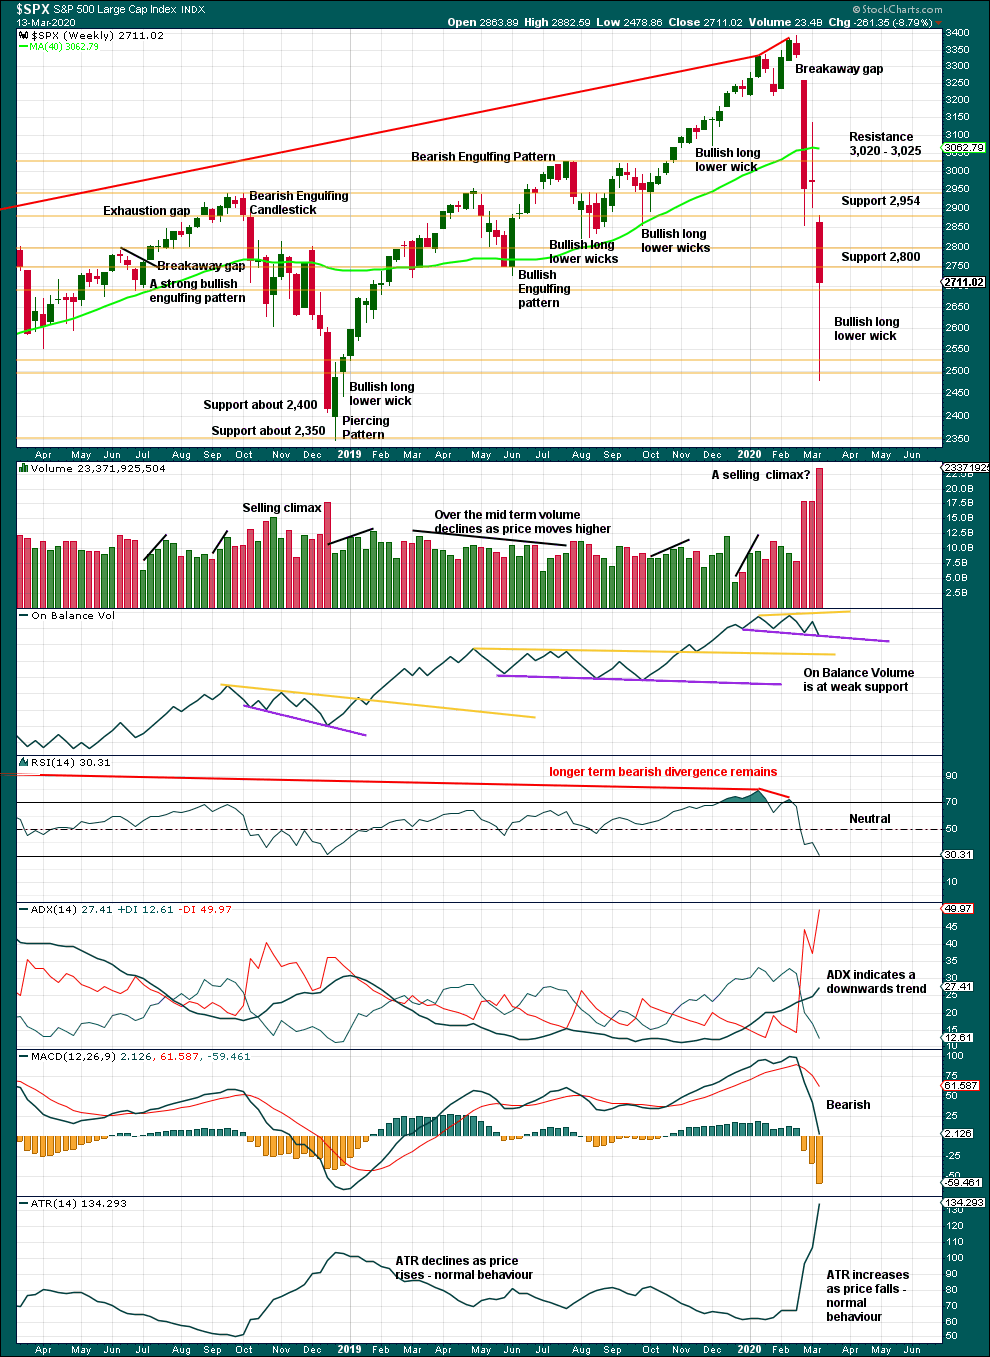
WEEKLY CHART
Click chart to enlarge.
Now that the channel is breached by a full daily candlestick below and not touching the lower edge, further confidence in this wave count may be had.
Price is now below the 0.382 Fibonacci ratio of cycle wave I at 2,352. The structure of cycle wave II may need further to go to complete. The next Fibonacci ratio at 0.618 is now a preferred target for cycle wave II to end.
It is possible today that cycle wave II could be complete. This is outlined in a second alternate hourly chart below; the technical analysis section outlines what needs to be seen for confidence in the alternate wave count.
Cycle wave II may not move beyond the start of cycle wave I below 666.79.
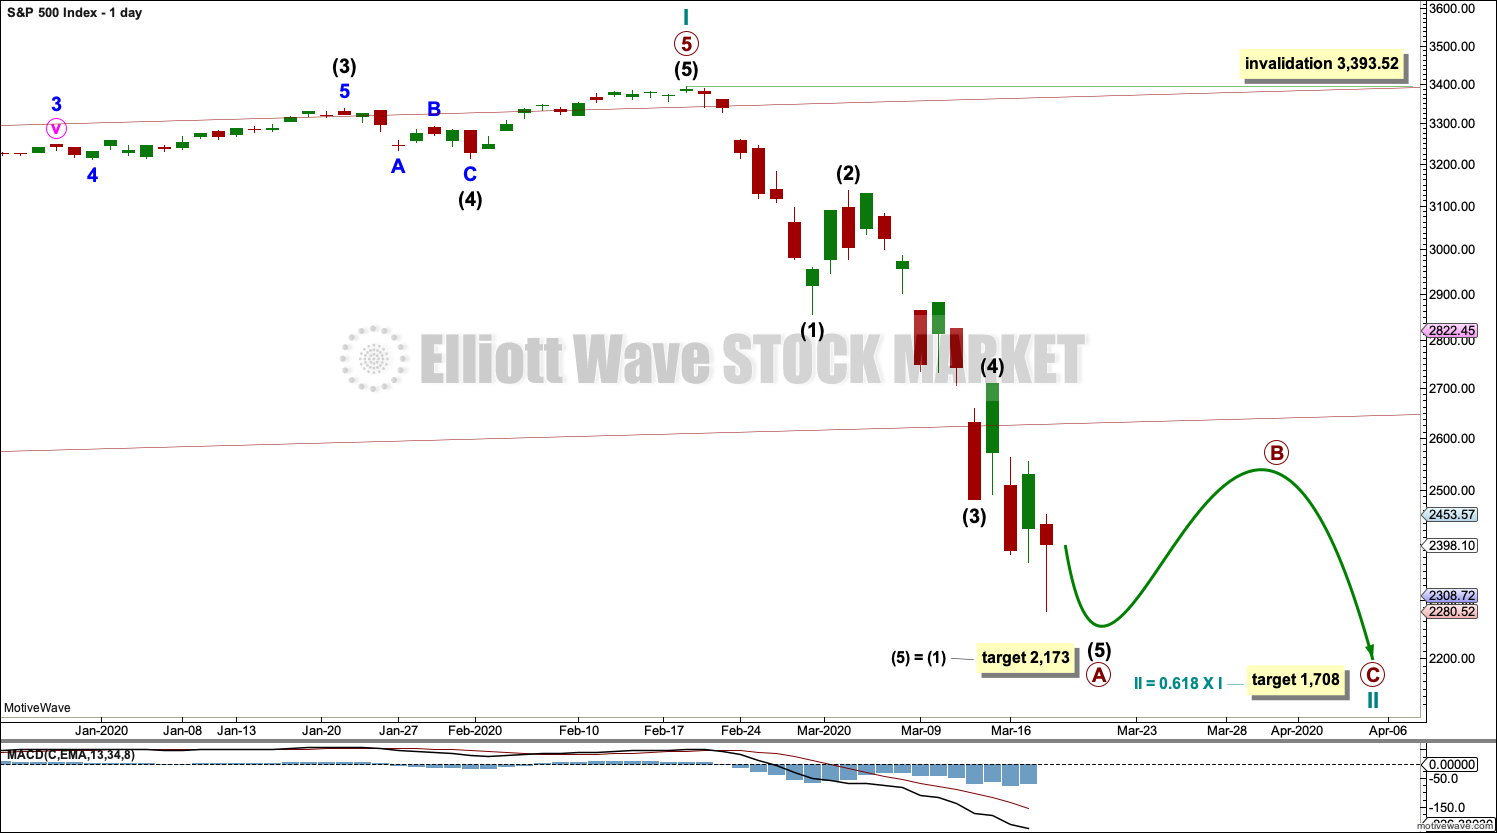
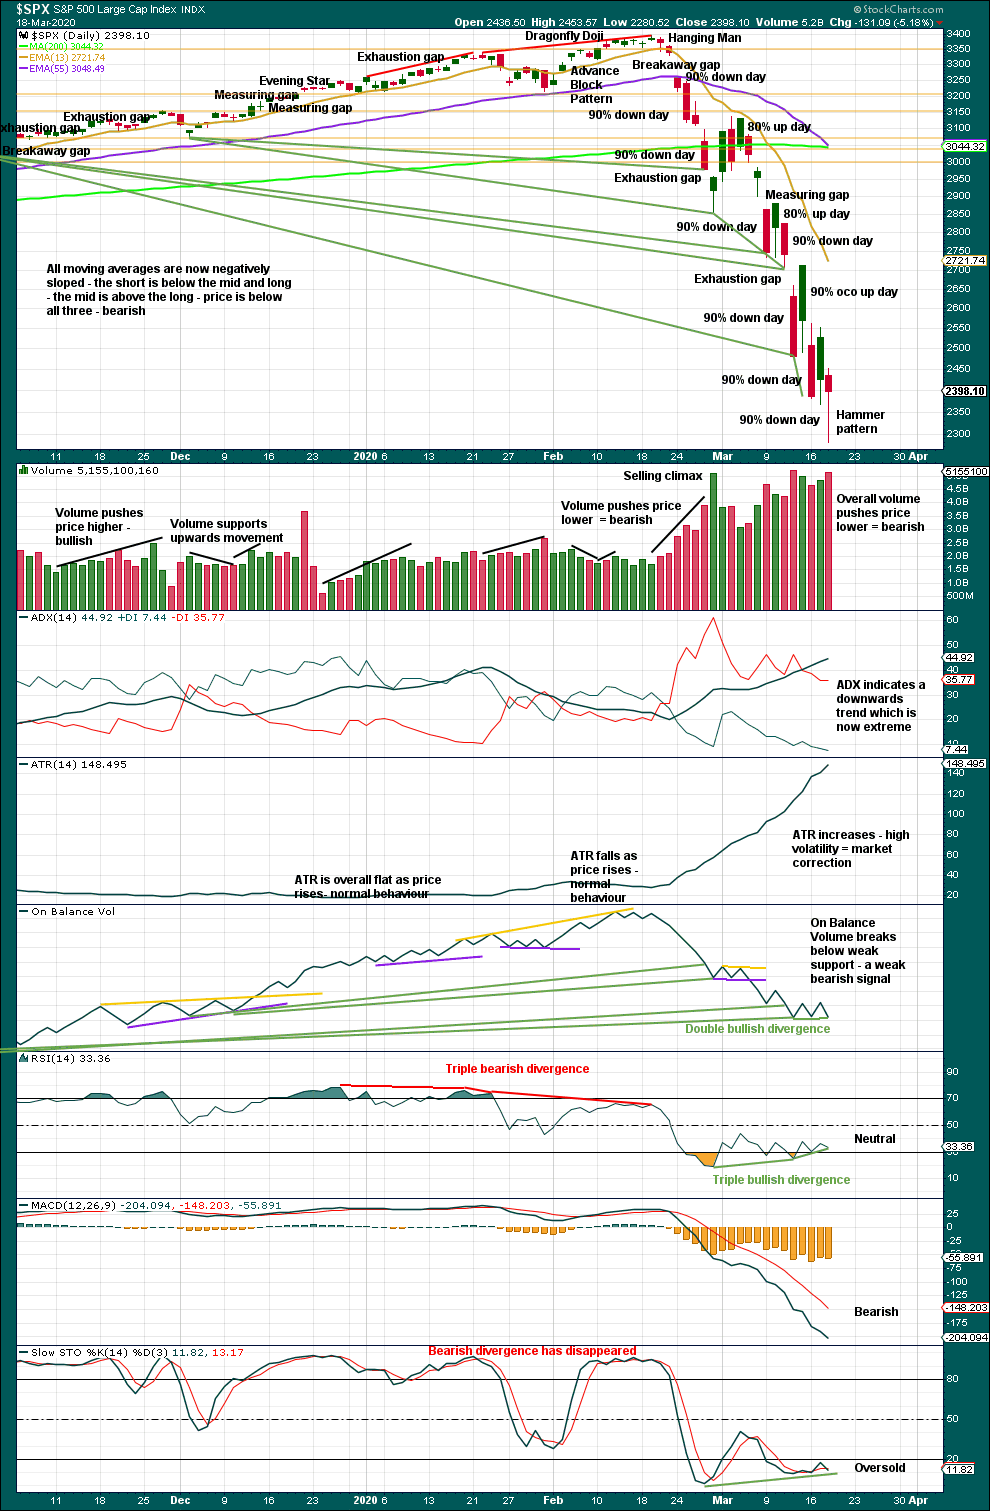
DAILY CHART
Click chart to enlarge.
Redraw the wide maroon trend channel carefully: draw the first trend line from the end of primary wave 1 at 2,093.55 (December 26, 2014), to the end of primary wave 3 at 2,940.91 (September 21, 2018), then place a parallel copy on the end of primary wave 2 at 1,810.10 (February 11, 2016). The channel is fully breached indicating a trend change from the multi-year bull trend to a new bear trend.
Cycle wave II may subdivide as any Elliott wave corrective structure except a triangle. It would most likely be a zigzag. Primary wave A may be an incomplete five wave impulse. Primary wave B may not move beyond the start of primary wave A above 3,393.52.
Within primary wave A, there is no Fibonacci ratio between intermediate waves (1) and (3). This makes it more likely that intermediate wave (5) may exhibit a Fibonacci ratio to either of intermediate waves (1) or (3). The most common Fibonacci ratio for a fifth wave is equality in length with its counterpart first wave.
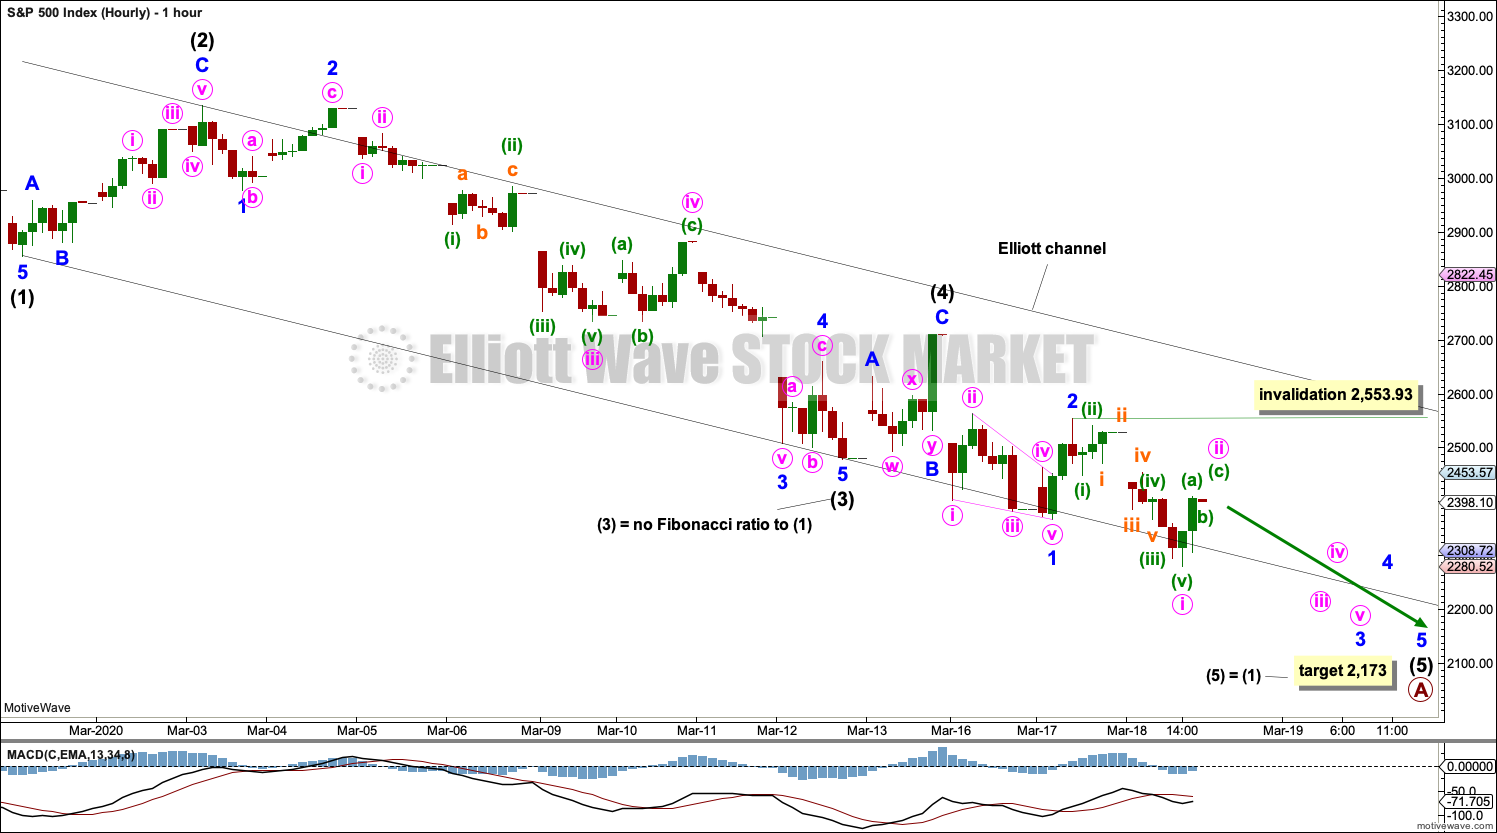
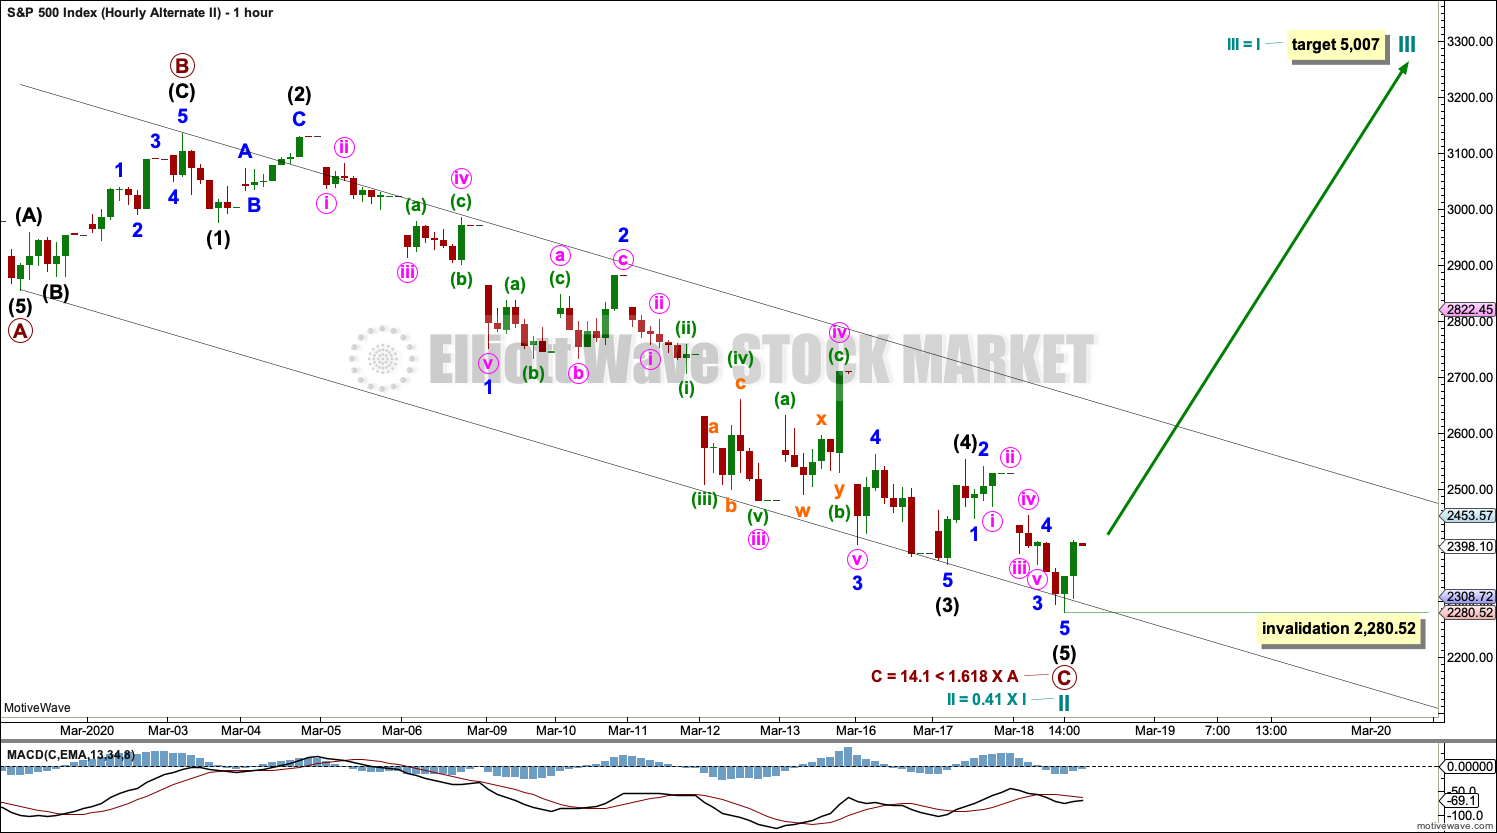
HOURLY CHART
Click chart to enlarge.
This is the main wave count today only because it is always safest to assume the trend remains the same until proven otherwise. The trend now is down, so assume it may continue down until this wave count is invalidated.
Primary wave A may be an incomplete five wave impulse.
Draw a channel about primary wave A using Elliott’s first technique: draw the first trend line from the ends of intermediate waves (1) to (3), then place a parallel copy on the end of intermediate wave (2).
During bear moves, this market sometimes behaves like commodities. It may exhibit swift strong fifth waves. Look for the possibility for intermediate wave (5) to end with further strength.
Intermediate wave (5) must subdivide as a five wave motive structure, either an impulse or an ending diagonal. Because a diagonal requires all sub-waves to subdivide as zigzags, and because it is not possible to see both minor waves 1 and 2 as zigzags, a diagonal may be eliminated for this wave count.
Within intermediate wave (5), minor waves 1 and 2 may be complete. Minor wave 3 may have begun and may only subdivide as an impulse. Within minor wave 2, minute wave ii may not move beyond the start of minute wave i above 2,553.93.
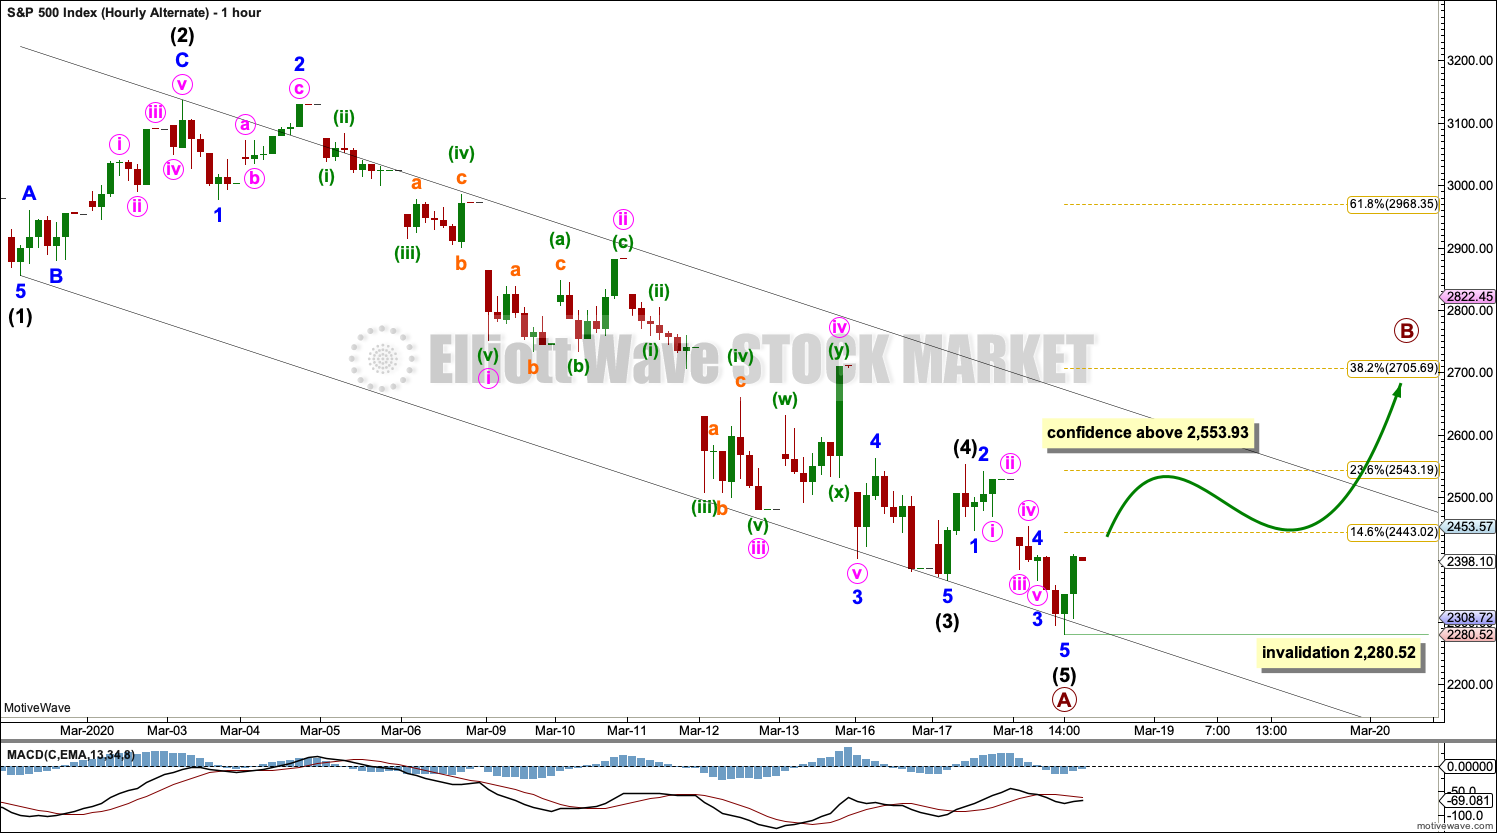
ALTERNATE HOURLY CHART
Click chart to enlarge.
It is possible today that primary wave A may be over. There is some support today for this first alternate wave count from classic technical analysis.
Primary wave B may subdivide as any Elliott wave corrective structure. It may be a quick sharp bounce as a zigzag, or it may be a more time consuming sideways consolidation as a flat, combination or triangle.
A new wave at primary degree should begin with a five wave structure upwards on the hourly chart. Within that first five up, no second wave correction may move beyond its start below 2,280.52.
SECOND ALTERNATE HOURLY CHART
Click chart to enlarge.
It is possible that cycle wave II may be a complete quick relatively shallow zigzag at 0.41 of cycle wave I. Coming after zero divergence between price and market breadth at the all time high, statistically a shallow bear market would be most likely.
This wave count absolutely requires some confidence from classic technical analysis before it may be considered seriously. It is published today to consider all possibilities.
This wave count may require one or more of the following conditions to be met for confidence in it:
– A 90% up day or two back to back 80% up days within three sessions from today.
– A 6 point rise in Lowry’s short-term index.
– A new high by the AD line.
– A new high above 3,393.52.
– A bullish candlestick reversal pattern with support from volume at the daily, weekly or monthly chart level.
TECHNICAL ANALYSIS
WEEKLY CHART
Click chart to enlarge. Chart courtesy of StockCharts.com.
A 32.8% drop in price (high to low) no longer has precedent within the larger bull market.
At the weekly chart level, conditions are not yet oversold; there is room for downwards movement to continue.
DAILY CHART
Click chart to enlarge. Chart courtesy of StockCharts.com.
There are now eight 90% downwards days in this strong downwards movement.
The following indicators still suggest a low may be in place soon:
– RSI reached deeply oversold and now exhibits short-term triple bullish divergence with price.
– Stochastics reached oversold and now exhibits short-term bullish divergence with price.
– On Balance Volume continues to exhibit double bullish divergence with price. On Balance Volume has failed to confirm the last three days’ lows.
If price bounces here, then it would most likely be a correction within an ongoing bear market and not necessarily the end of the bear market.
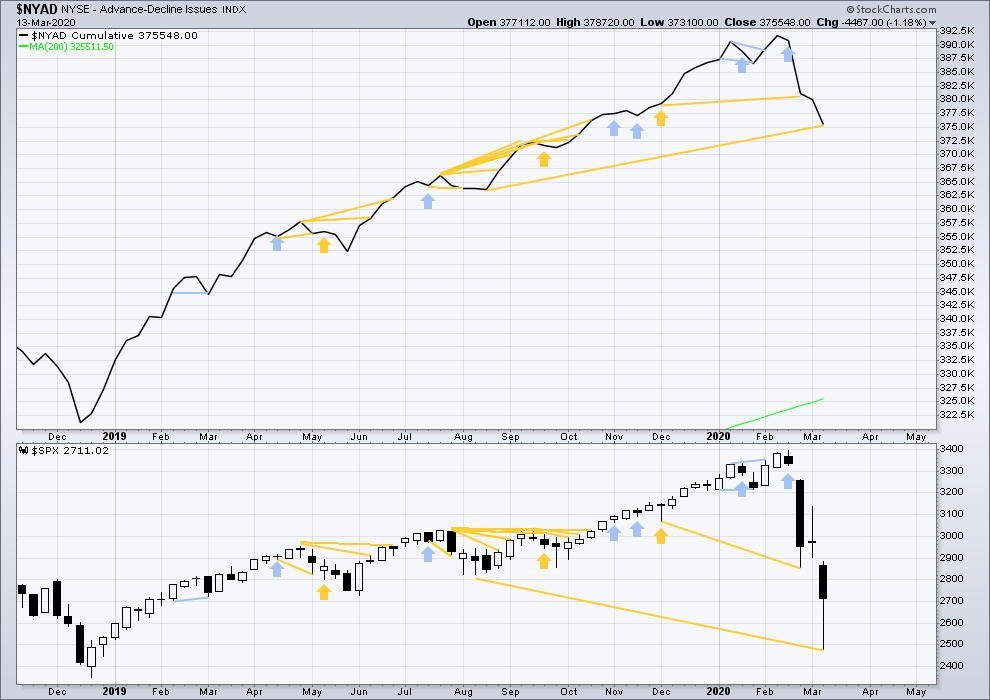
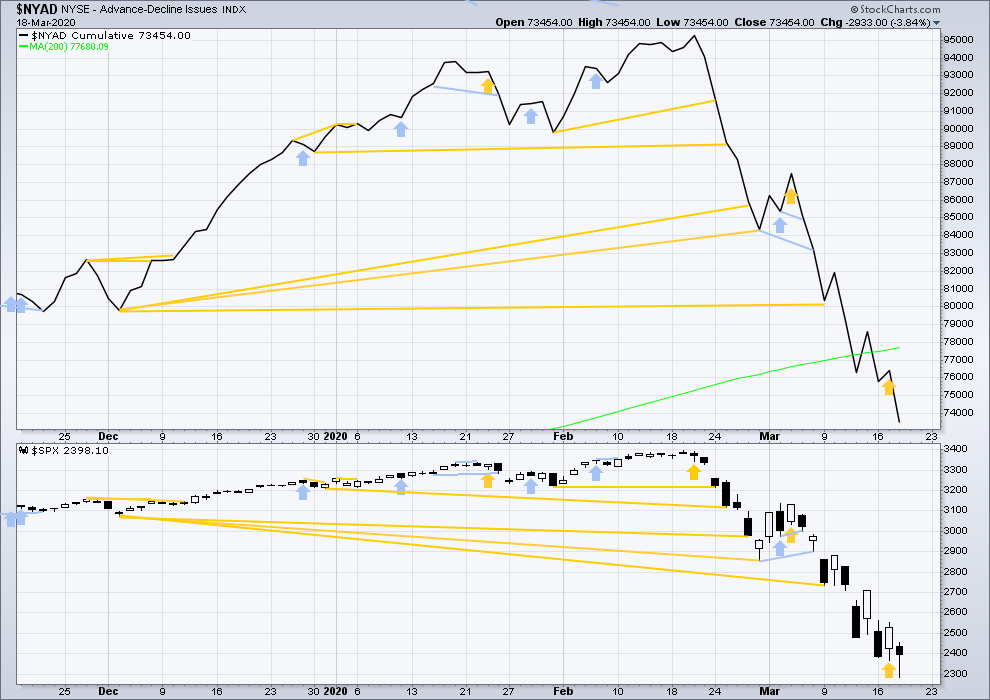
BREADTH – AD LINE
WEEKLY CHART
Click chart to enlarge. Chart courtesy of StockCharts.com. So that colour blind members are included, bearish signals
will be noted with blue and bullish signals with yellow.
Bear markets from the Great Depression and onwards have been preceded by an average minimum of 4 months divergence between price and the AD line with only two exceptions in 1946 and 1976. With no divergence between the AD line and price at the last all time high, this current bear market now makes a third exception.
In all bear markets in the last 90 years there is some positive correlation (0.6022) between the length of bearish divergence and the depth of the following bear market. No to little divergence is correlated with more shallow bear markets. Longer divergence is correlated with deeper bear markets.
This bear market comes after no bearish divergence. It would more likely be shallow, but this is a statement of probability and not certainty. So far it is slightly more than the 0.382 Fibonacci ratio of the bull market it is correcting (beginning March 2009).
Last week price made new lows below prior lows of August 2019, but the AD line has not. This fall in price does not have support from a corresponding decline in market breadth. This divergence is bullish and supports the view that this bear market may more likely be shallow.
Large caps all time high: 3,393.52 on 19th February 2020.
Mid caps all time high: 2,109.43 on 20th February 2020.
Small caps all time high: 1,100.58 on 27th August 2018.
DAILY CHART
Click chart to enlarge. Chart courtesy of StockCharts.com. So that colour blind members are included, bearish signals
will be noted with blue and bullish signals with yellow.
Breadth should be read as a leading indicator.
Today both price and breadth have moved lower. There is no new short-term divergence, but mid-term bullish divergence remains (seen at the weekly chart level).
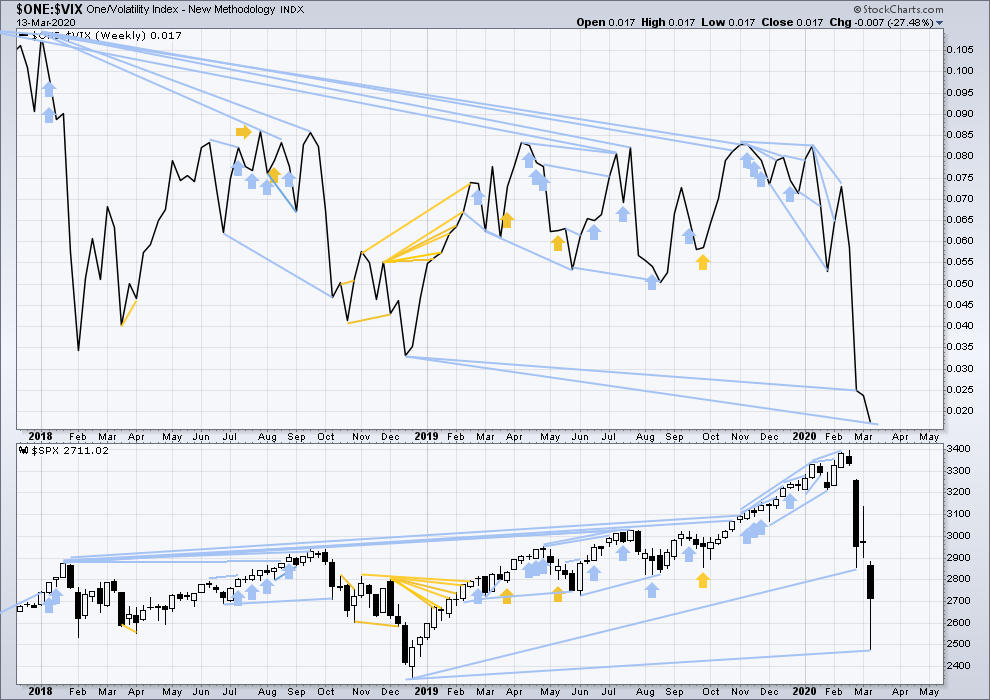
VOLATILITY – INVERTED VIX CHART
WEEKLY CHART
Click chart to enlarge. Chart courtesy of StockCharts.com. So that colour blind members are included, bearish signals
will be noted with blue and bullish signals with yellow.
The all time high for inverted VIX was on 30th October 2017. There is now over two years of bearish divergence between price and inverted VIX.
The rise in price is not coming with a normal corresponding decline in VIX; VIX remains elevated. This long-term divergence is bearish. It may now be resolved by this last fall in price, which meets the technical definition of a bear market.
Last week inverted VIX has made new lows below the prior major swing low of December 2018, but price has not. This divergence is bearish and suggests this bear market may not be complete.
DAILY CHART
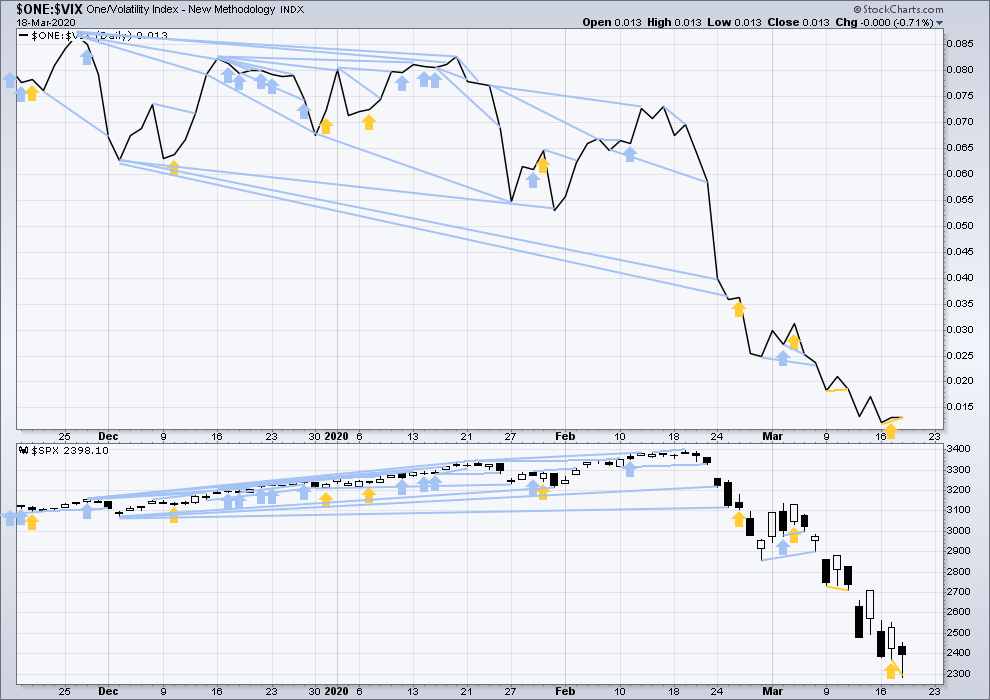
Click chart to enlarge. Chart courtesy of StockCharts.com. So that colour blind members are included, bearish signals
will be noted with blue and bullish signals with yellow.
Today price has moved lower to make a new low, but inverted VIX has not made a new low. This divergence is bullish for the short term.
DOW THEORY
Dow Theory has confirmed a bear market with the following lows made on a closing basis:
DJIA: 21,712.53 – a close below this point has been made on the March 12, 2020.
DJT: 8,636.79 – a close below this point has been made on March 9, 2020.
Adding in the S&P and Nasdaq for an extended Dow Theory, a bear market has not been confirmed:
S&P500: 2,346.58 – while this point has been breached intra day, price has not yet closed below it.
Nasdaq: 7,292.22 – a close below this point was made on the March 12, 2020.
Published @ 06:56 p.m. EST.
—
Careful risk management protects your trading account(s).
Follow my two Golden Rules:
1. Always trade with stops.
2. Risk only 1-5% of equity on any one trade.
—
New updates to this analysis are in bold.
And I’m really sorry that I didn’t upload a chart prior to close today. Am dealing with some family emergency and high levels of stress so… Will begin end of day analysis now.
boy I’m sure lacking clarity here. ie…what counts people are commenting on, including Laras chart this morning. was that an official chart or just charting a members idea.
should we expect mid day updates in the last hour? or can that update come at any time now?
I think it would be helpful if regulars here had a pattern of referencing a particular count. I feel like we often blurb out ideas without a map for other readers to use In understanding our conclusions or ideas.
more often than not, lately, only a main count is given. when the market goes the other way, there is no guide until the last hour, sometimes the last minutes.
that really makes it hard for less experienced readers of EW like myself. I really appreciate the chat room here as some of the members are really great at filling in during the day.
just feel like structure here has gone to the wind in a time where its needed most. thanks again guys for all the commentary and ideas and thoughts.
I’ll be baking hot cakes tonight, expecting a long line tomorrow ….
Aka sticking with the main count, bought some puts today near close to sell
tomorrow …..
Hi Peter S,
Just beginning to learn about options – find Kevin’s too confusing at the moment but understand what you’ve done. What strike price and expiry did you go for?
Thanks.
got ya. hot cakes are bearish! cold fritters are bullish? lol!
Agreed. I have three hourly counts just to be clear.
Main hourly – assumes the trend remains the same, down.
First alternate – primary B has arrived.
Second alternate – least likely, bear market is over.
new alternate posted in comments – intermediate (5) as a diagonal has been invalidated so please don’t refer to this idea as valid, it’s not anymore
Please could members refer to which one you’re discussing.
Hi Hokipa555,
I think you should read this forum as “for entertainment only”. Note that this is an anonymous place, where you can use any username you want, and you have no idea who is actually posting.
I believe only Kevin has posted many links to his website, and you can find his LinkedIn profile fairly easily (mine is arnauddesombre). If you cannot determine who is posting, of course you should be worried about what they are posting. Use a pinch of salt while reading the forum! You did not pay for what you read, unless it’s posted by Lara. And you know what they say: if it’s free…
You should also be completely suspicious about all the gloating going around. In my career, I’ve never met a trader who lost money, so it’s not surprising you only have winners here! Me, I’ve made money initially on the downleg, but I certainly lost a lot of it trying to play the upside (I’ve purchased the close today which may add to my losses).
Never bindly follow the advice of an analyst, ever a great one like Lara. It’s not their job to give trading advice: they publish roadmaps. I find Lara’s roadmap interesting and insightful, but at the end of the day, it’s only a roadmap (Lara: I’m not trying to discredit your work here, just stating that it’s an analysis, not a prediction).
Other services offer trading advice (buy/sell at this level, and this is your stop). You are not going to find this here. For what it’s worth, I do not find trading advices particularly useful. Use other people contribution, but at the end of the day, you are alone.
I completely agree with Arnaud. Even today when I was right about that the price would hit 2450, I didn’t invest in this idea myself as for me risk/reward wasn’t positive- have to be upfront about it. It’s all about your personal risk/reward – no one else’s. If anyone tells you what the market will do 100%, run away. No one in this world does know anything for certain. Otherwise, there wouldn’t be a market after all – all arbitrage, if there is any, is traded away very quickly. If you are willing to risk X amount and follow’s some advise and have a system without any emotions, go for it. Just make sure you stick to it no matter what. The moment you deviate from it, that’s when you lose a lot of money. Just my 2 cents.
I think that’s partially a function of an extremely storm tossed market.
Most (not all) of my intra-day comments aren’t around counts per se, but around structural action (Fibonacci levels and prior pivots, i.e. tactical support and resistance). But I’ll try to be clear when I talking about any particular EW model.
Note that bullish symmetry (largest up move through the course of the swing down from the ATH) has NOT been broken here. That’s up around 2512.
Basically all we’ve done here is test the upper channel line and turn back down.
I completely agree with you, Kevin. It actually didn’t even properly touch the upper channel line.
Break of DJIA 20K next trigger…
There you have it mateys…break from wedge… 🙂
Seven small waves down off the top. Not quite sure what to make of that…
Nested waves…
They may “Shake the Trees” ahead of last wave down… 🙂
Verne, I like your “shake the tree” analogy. It worked more times than none. Keep posting those ideas:)
Next wave down should be sharp, with equally sharp reversal for a “B” or 2 up…wagons ready…! 😉
Hi Verne, youre referring to the main hourly finishing with a 5 to finish a and reversing up for the b?
Yep!
That (steeply descending) upper channel line is much closer now, 2465 is where I have it.
Though if it falls, I’ll still be watching closely for a pivot high to form at the 2490 area.
Kevin/ Verne.
I’m thinking we close around the 2500. Thoughts
Lara’s count has 2467.41 as upper limit for a possible wave 4. What are you basing your 2500 target on?
There’s an alternate that has primary A complete.
I note that right now, it appears we are having two back to back daily candles with long lower wicks, today’s having a higher low and potentially a higher high. That all looks “bottomish” to me and supportive of the alternate.
We might see a sharp buying spree similar to last Friday if price breaks through the channel and the 78% level and then the 2500 roundie. Up to the pivot high at 2556 isn’t impossible (but a stretch).
But it’s all rather uncertain right now.
Pattern is a rising wedge…
DIA gap at 207.16 likely magnet as well…
and now a turn off the upper channel line…
I’ve been keeping an eye on the ending diagonal count for intermediate (5) and its now invalidated
I may be missing something, has 2467.41 been breached?
Hi Doc, so far I have the high for this session at 2,456.76
why is your count referred to invalidated ?
Not her count, proposed ED…
thanks,, I see that now
We can still laugh about it!
https://www.eetimes.com/england-raises-security-level-from-miffed-to-peeved/#
(I’m French… I loved it)
I’d say the Kiwi levels would be “sweet as bro” as normal, to “she’ll be right mate” and then when slightly irritated a Kiwi may say “well blow me down”. When highly annoyed we tend to use a rather rude word that may offend so I’ll not post it here 🙂
Awww…! Go on!! 🙂 🙂
“Blow me down!” was a Popeye favourite!
Looking at the positive side: According to the current wave counts, we will complete a Cycle Wave II in the near term future. After that, we will enter a Cycle Wave III. That is a very bullish outcome to this correction / bear market. We may even see volume on the upside days return with some power. The end of Cycle II will give us a long term bullish buying opportunity that comes along only once in a generation. I am quite optimistic, long term of course.
What makes you think in the “near term future” Rodney? My outlook is much more bearish than that at the moment, but always open to new data.
Let me define ‘near term future’ as I have used it. Lara comments that Primary Wave B may last a few days to a few weeks. I am guessing Primary Wave C will then complete in a similar time frame. So, 6 weeks to 12 weeks would be ‘near term future’ especially when I am looking out at the start of Cycle III which will take several years to complete.
GS say May and then a sharp reversal to 3200 .. that would be nice
I can see a completed leading contracting diagonal possibly complete up from the last low.
It could also be labelled as a double zigzag though, which would fit the main hourly chart.
And the NDX has retraced more than what an immediate bearish outlook would expect.
The RUT is up 4.3%!!! Yet SPX only up 0.9%. NDX in the middle at 3.0%. Mixed up day.
Today is the first day in recent memory where Dow Transports and RUT are up more than SPX.
Maybe signs to come?
They’ve been leading the way down this whole time
Lara – very unusual circumstances – while you have definitively called a bear market in the S&P, it still appears as if the Nasdaq and XNDX are still in a secular bull market despite recent draw downs. Do you follow these markets, and if so, do you do weekly work on them as I would be very interested in seeing this. Thx. Peter
One of the biggest problems I find with Dow Theory is deciding where exactly a major high or low is which must be breached.
This is rather difficult for Nasdaq IMO. I’ve decided it’s 7,292.22 but as you can see from this chart it could also reasonably be decided to be 6,190.17.
Either way, Nasdaq is very clearly in a downwards trend.
Looks like we are going to 2450 today, at least.
test now at 61.8% and 21.6, 2949-2958 zone. If it breaks, next is 2490 area with 78% and the upper channel line. If THAT breaks, the pivot high at 2554. If THAT breaks…the B is almost certainly on.
you mean 2499-2598 correct?
Kevin looks far ahead in the future – at some point we will hit 2949-2958, I’m certain of that, but not today-:)
Lol!!! Yes…the FAR FAR FAR future!!!
2449-2458 (dyslexia!), and yup, it turned. For the moment anyway.
You had me switching back and forth on Lara’s daily analysis and wondering..how come these higher levels are in play so fast.
What I mean, NOT what I say…lol!!! Sorry about that. I’ll try to recheck my #’s before sending going forward.
Lack of momentum here is suggesting to me no B wave launch today, and now a little double top on the 5 minute.
So Cesar and I are here to stay for a long time in a little apartment in Panama City. Not what we planned, and there’s no surf, and my surfboard is back in Texas anyway.
We have been self isolating for 7 days and so far we are still healthy.
Exercise, or the lack of it, is an issue. I should be doing yoga, but instead we went for an early morning walk in the empty streets. There’s few people on the sidewalks, and as long as we maintain good distance and don’t touch anything I think we’ll be okay.
I’m trying to find out if once you have had the virus it gives natural immunity. I have discovered there are two strains; a very mild version, and a more aggressive version. My important question now is if you get the aggressive version can you get that one again.
If I get sick I may not be able to provide you with your analysis for a few days. I am doing everything I can to avoid that.
How is everyone else coping?
I pretty certain there are reports of “re-infection”. But whether with identical strain or different, I don’t know.
My pool hall is shut down, serious bummer (I play almost every day)…I’m going to get a lot of guitar playing in!!! Maybe dive back into my next book, “Pragmatic Trading: Use of Weapons” again (1/2 written).
What’s up with your Elliott wave book Lara?
Cheers Kevin. I finished the book and passed it over to Cesar to proof read and publish.
Looks like we shall be stuck here for weeks, so there is a chance he can get to that project.
Kevin in italy according to my wife who is a health professional from italy. The virus has mutated. Hence anyone is at risk
Likely to keep mutating I would guess? Going to be a long term problem, unless they find some “wide spectrum” vaccine.
Good day to you Lara. I have not heard of reinfection cases. But I heard Dr. Fauci speak on the matter. He said there is not enough study yet to determine if reinfection is possible or likely. There is no evidence to suggest COVID-19 will behave differently that other viruses regarding gaining immunity once infected. So we have some hope in this area. I am guessing we will look to China and South Korea for the earliest reports on reinfection rates.
In my area, just outside of Washington State and 200 miles or so from Seattle, we are facing the first possible cases where contact with others is an issue. We had one or two cases in my County a week or so ago. But the quarantine, contact investigation, and sanitizing of public places was amazingly rapid. But, 45 miles north of me they now have the 1st case at the major hospital. The older person died shortly after admission. In our local hospital, they have admitted the 1st patient with a presumptive positive test. Our town is following CDC protocols etc so the chance of spread is reduced.
In my position, I am charged with the responsibility to communicate with a whole variety of people trying to bring calmness and encouragement into their daily lives. We are quickly developing and using on-line resources as well as currently using US Mail and email. So I come into the office each day. But I have been able to significantly reduce my exposure to others and certainly maintain the 6′ or 2 meters social distancing protocol.
If you miss some updates and publications, so be it. I understand and would expect you to get very well before you resume normal a publishing schedule.
Safety and health to you and Cesar as well as all your subscribers.
Hi Lara,
We have been home isolated for 8 days today, 3 kids 2 adults.. but it is working out fine. I work from home, kids are doing their homework and play in the garden and nearby forest – but no visitors or play-dates. I exercise in the morning, and if I meet anybody then I pass with more than 2 meters space.
Supermarkets are open but with strict rules of how close you can get to other people, they have taped lines on the floor by the cashier. I do the shopping in the evening when there a hardly any other people.
My recommendation is to do everything you can to avoid getting covid-19. Don’t expect to get immunity to all strains and you don’t know how you will react to it.
A friend of mine from work was sick with covid for 4-5 days with fever etc. And afterwards she has been fine. She is a lady in her 50’s and had been skiing in Austria. But all people are not fine. The majority who are hospitalized with COVID in Denmark (where I live) are men, aged 40-60 years. They also caught the virus while skiing in Italy or Austria – They were all in good shape and healthy. Few had prior medical history of lung capacity issues or similar – but the majority had a clean record. It is expected that the age-group 40-60 will survive .. but they need 3-4 weeks in a respirator.
COVID-19 will pass – Some areas in China are already back at 75% – it will be the same in Europe and the US. But I expect at hard ride for the countries with no or limited lock-downs in place. We will know in a few weeks.
Nothing more important than your health.
I will personally come to Panama and seize your Motivewave if you try to work while ill, ya hear? 🙂 🙂 🙂
LOL
I’ll keep you all informed and I promise to rest if I get sick. For now lots of healthy food, supplements and some yoga should keep me in good health to fight anything off more easily.
🙂
Hey Lara.
I hope alm is well in Panama. As I have mentioned I’m in dubai. Working for a airline. Can’t tell you which one but the one that has – lot of aeroplanes. I can’t leave country without going into self quarantine and when I get back in country I have to go into self quarantine.
I’m also just about to burn my vacation days.
I’m pretty sure in the USA puts border controls on I will be on unpaid leave
Thank you all for your responses.
We have a curfew here and no foreigners may enter the city. So I’m stuck.
But we have good food, enough space in our little apartment for two of us, and if we get sick at least the hotel staff can call a doctor for us.
We’re both very healthy from a healthy lifestyle in NZ surfing and eating well, so we are in best possible shape to shake anything off.
I’ll keep you all updated if I get sick. Let’s hope it’s avoidable!
A beautiful thing, I was able on the initial selling to get out of my sold call spreads for close to break even. Defense is even more important than offense!
78% retrace level and the upper channel line just under 2500. If it breaks that…the B wave is most likely ON. But first, a cluster of a 61.8% and 23% at 2456 area.
We need at least one more wave down to a new low, It would be nice to see a well-defined hammer candlestick today. Let’s NOT have a fifth wave truncation…Thank You!
I posted a count yesterday after the close showing an ending diagonal for this wave (5). The count is working well, and hints at one new low.
Diagonals have to have three wave sub-waves. Pattern could still be some kind of falling wedge that does not meet EW diagonal rules though…
Here is your idea charted, a slight adjustment in where I’m seeing minor 2 complete to avoid a small truncation.
I checked, the trend lines do converge. Just.
The diagonal would be contracting so 4 must be shorter than 2, and 5 must be shorter than 3.
Yes. I think this is a decent risk/reward trade (short soon, clear stop). Thanks
The good thing with that count is there are very clear price points beyond which it’s invalidated.
If price moves above 2,467.41 it’s invalidated, and so we may have a little more confidence in the first alternate published in this analysis above.
Positive divergence at recent lows hinting at relief rally ahead. A lower VIX high with lower index low would be characteristic of a fifth wave down. If VIX goes to a new high, we may not be done but continuing down in a third. Lock & Load!
Agreed, high potential rally here. Big coil on key fib resistance (even more so in futures), high potential to blow to upside today.
still thinking rally to the shades zone on your chart or has overnight action changed your mind?
Not sure what you mean by shaded areas? futures tagged/turned up at 78%. Pretty strong indicator of up coming but nothing is certain. If we get strong upward price action then I’ll watch Fibo levels and the down channel for possible completion pivots.
The 2019 low and the the fact the fibo structure of this A wave is so excellent at this low strongly supports a significant pivot back to up here (B wave maybe).
the shaded area on your chart from 819pm last night
Kevin – Are you able to share the possible mother of all trade parameters?
Not until it sets up. Top of the B wave, which may or may not start upward today.
Options premium too high for tomorrow’s expiration.
Why I sold a little speculative put spread at yesterday’s low for expiry tomorrow! I’ll take that excessive premium thank you very much!!
Also, I have bear put back ration in SPY. I’m intending to use a variation on the Verne play for option spreads on B waves, if the B wave develops here…close the short side of the back ratio (buy back the sold puts) for a profit at the top of B, hold the long puts and maybe even add for the C down.
Thanks Kevin!
SELL that juicy premium! 😀
NYSE going all electronic trading on Monday 23 as 2 employees tested positive for covid19.
This chart is looking like world wide cases are about to EXPLODE. Rapid exponential growth now.
This is a graph from Nordea Bank and shows Covid-19 related deaths per million.
Spain is on a worse trajectory compared to Italy.
Massive kick back rally driven by the US $ spend plan. But in context…just backing and filling in the even MORE massive “strongest in history” down channel. The combination of a 61.8% retrace level and the upper channel line is likely to turn it back down (marked).
Also due to ECB’s new QE of 750 billions to purchase assets…
I think Fed will also have to start QE later or sooner.
Turned on top of the 50% (highs on this chart). For now anyway.
And straight back down to 2300 area!!! oh…my…goodness. CRAZY overnight action.
Yes. But I like it . Xx
Retrace to 2460. Thankyou kevin
Twice?
Missed again:(
Sorry – I think I have an unfair advantage with my location and Lara’s new location.
Now off to bed dreaming markets fall tomorrow in line with Lara’s main count.
Oops…hate to disturb your sleep.
Massive move up in futures. US gov’t throwing HUGE $’s at the markets apparently. Hey, gotta protect the “investment class” first and foremost…but all the $$$ in the world in th market’s won’t help corporate earnings, and at the end of the day, those the the fundamental #’s that drive stock prices.
🙂
Expected the attempt since they breached 2,348… night is still young. This will fail as well cause rallies will get sold.
Oh, they sold