
At the end of the week, monthly charts are reviewed in text and video. A bounce is expected for next week.
Summary: Expect a bounce to begin next week, which may end about either 2,828 or 3,044. Thereafter, the bear market may resume to make a final low at 2,352. This final target may change when the bounce is complete.
The biggest picture, Grand Super Cycle analysis, is here.
ELLIOTT WAVE COUNTS
MAIN WAVE COUNT
MONTHLY CHART
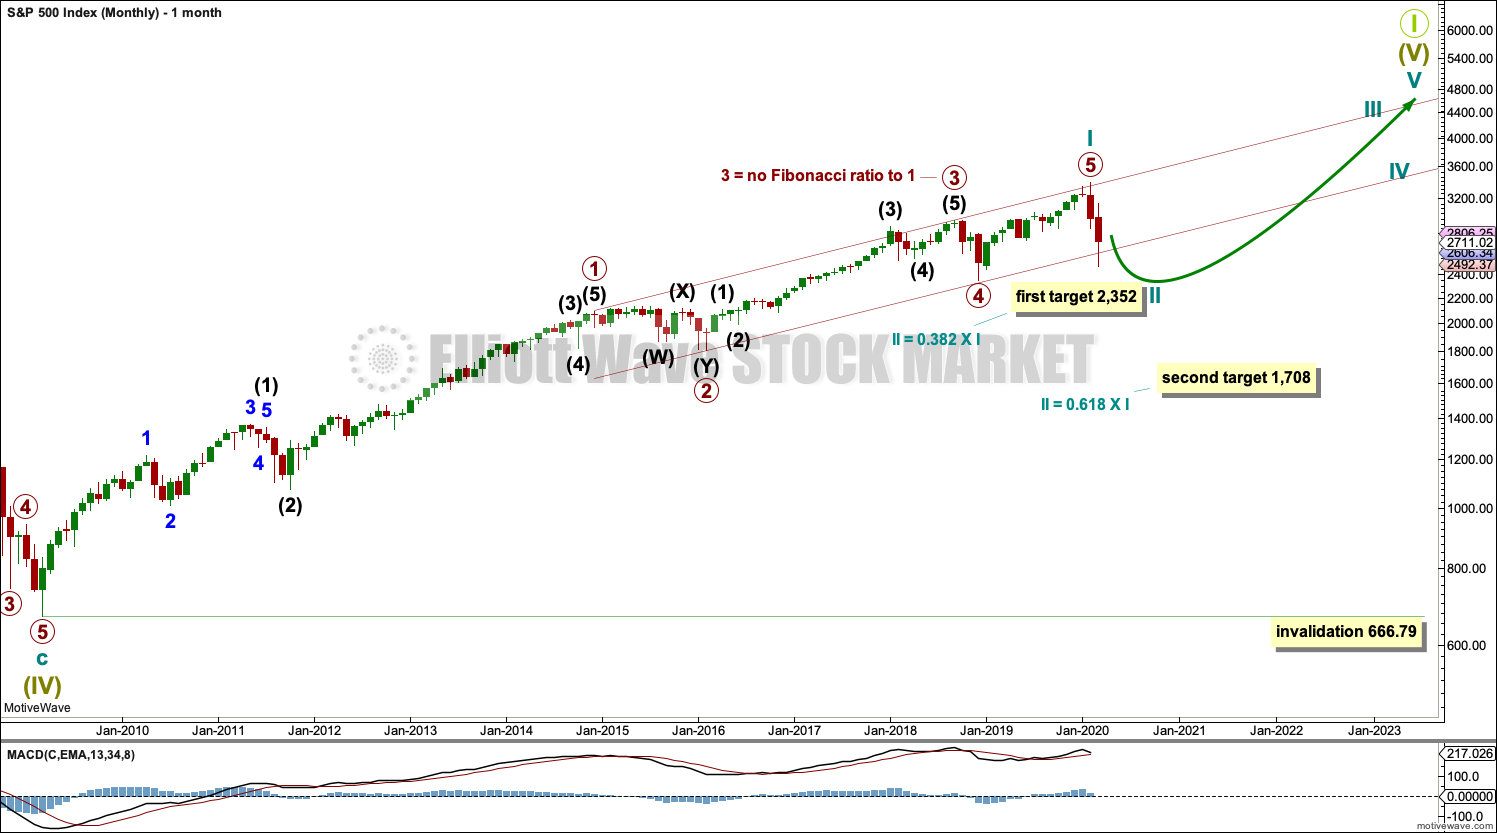
Click chart to enlarge.
If the bull market is over and a bear market has begun, it has come after no divergence at the last all time high between price and the AD line as a measure of market breadth. Statistically this indicates the bear market to follow would most likely be relatively shallow. The 0.382 Fibonacci ratio would be a preferred target. The 0.236 Fibonacci ratio at 2,750.01 has already been passed.
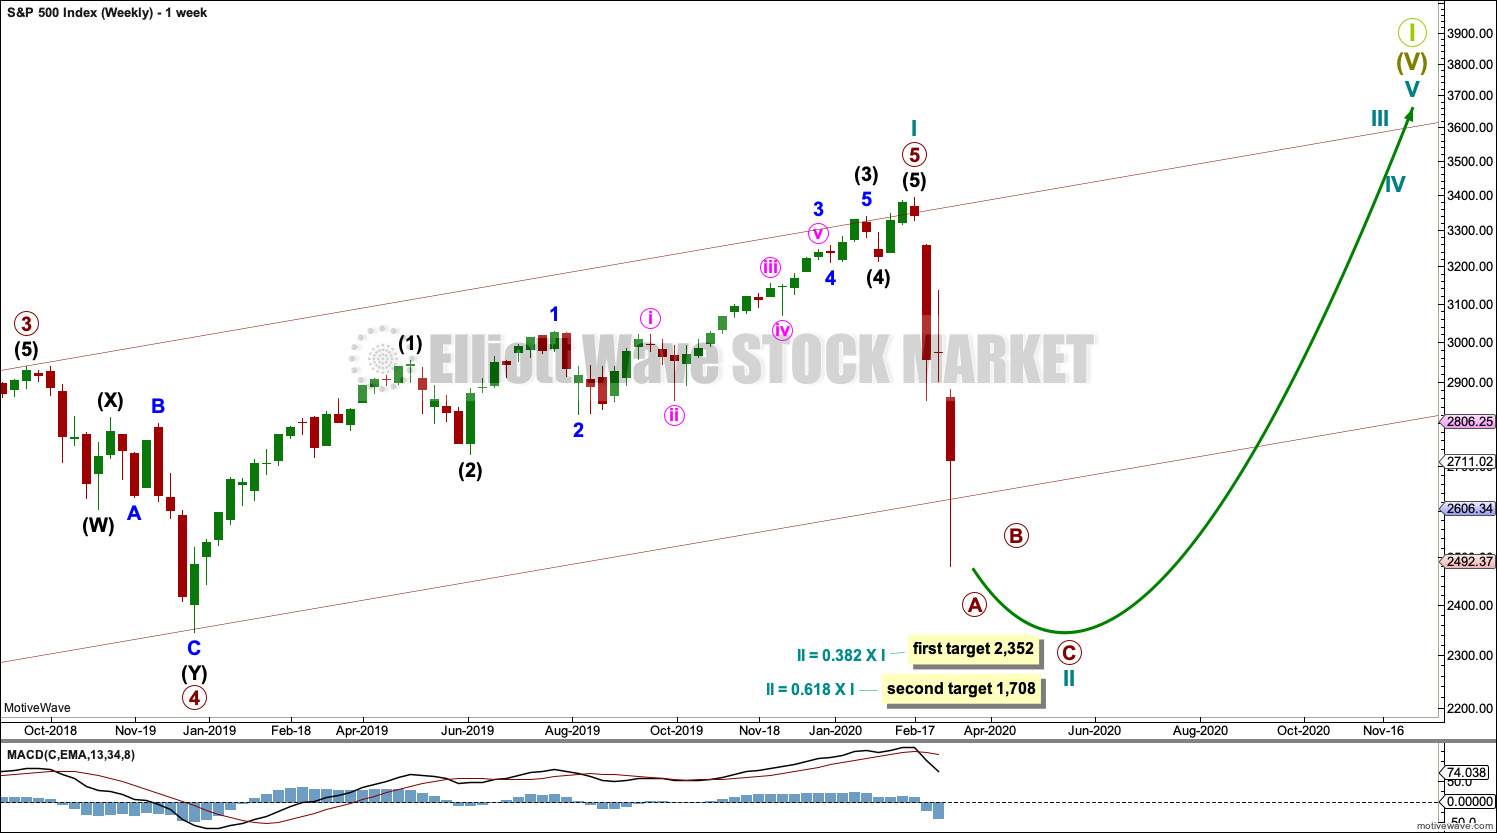
WEEKLY CHART
Click chart to enlarge.
If the channel is breached by a full daily candlestick below and not touching the lower edge, further confidence in this wave count may be had. A close below the lower trend line is very strong, so this now is the main wave count.
The second target at the 0.618 Fibonacci ratio would have a lower probability.
Cycle wave II may not move beyond the start of cycle wave I below 666.79.
DAILY CHART
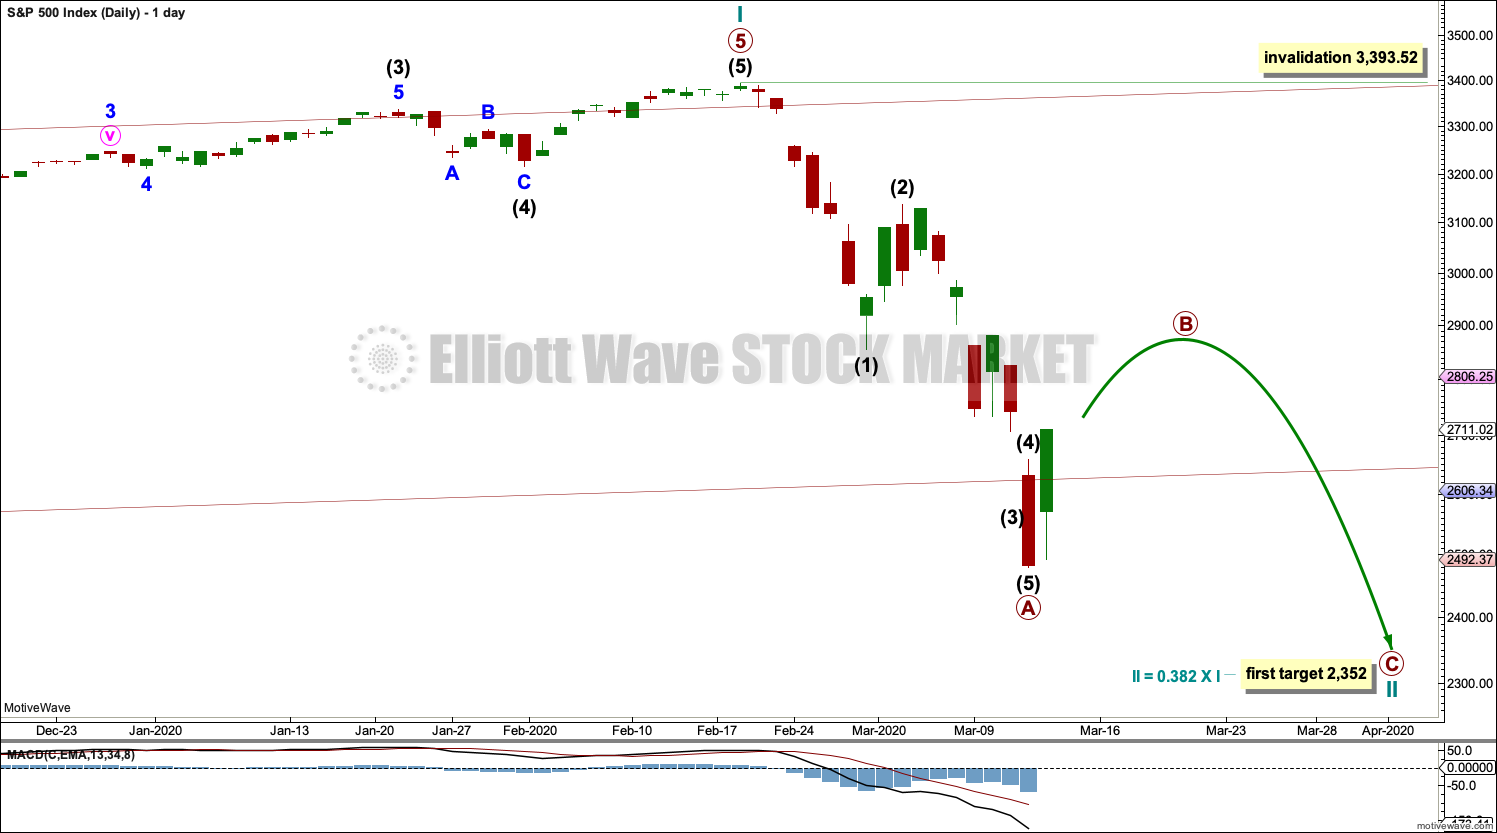
Click chart to enlarge.
Redraw the wide maroon trend channel carefully: draw the first trend line from the end of primary wave 1 at 2,093.55 (December 26, 2014), to the end of primary wave 3 at 2,940.91 (September 21, 2018), then place a parallel copy on the end of primary wave 2 at 1,810.10 (February 11, 2016). Today’s candlestick is almost all below the channel, and the close below is strong.
Cycle wave II may subdivide as any Elliott wave corrective structure except a triangle. It would most likely be a zigzag. Primary wave A may be a complete five wave impulse. Primary wave B may not move beyond the start of primary wave A above 3,393.52.
Primary wave B may subdivide as any Elliott wave corrective structure. B waves exhibit the greatest variety in structure and price behaviour. Primary wave B may be a quick sharp bounce, or it may be a sideways time consuming consolidation. Considering the strength and intensity of primary wave A, alternation suggests a more time consuming sideways consolidation for primary wave B.
HOURLY CHART
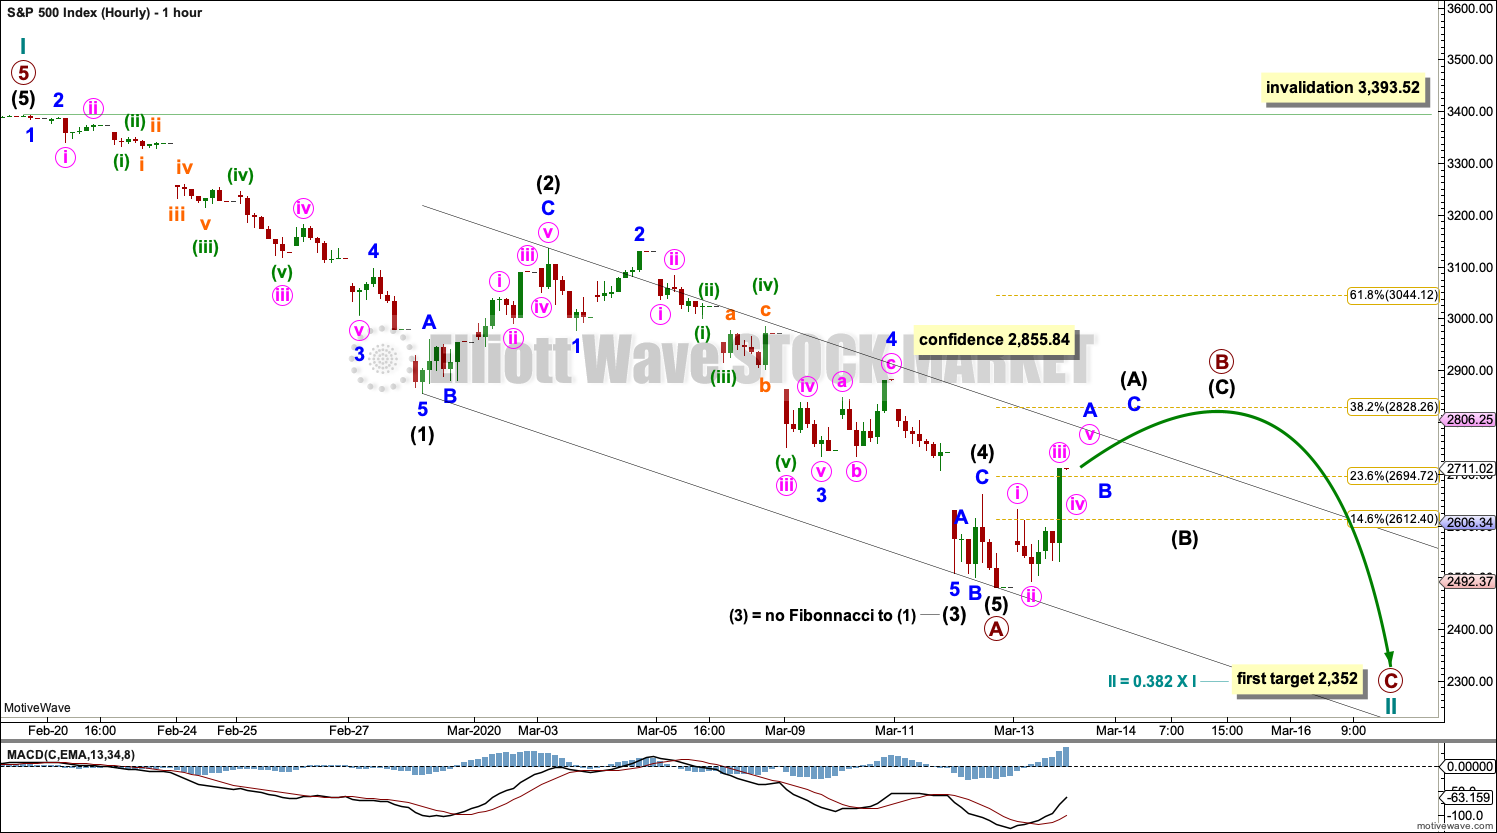
Click chart to enlarge.
Primary wave A may be a complete five wave impulse.
Primary wave B may have begun. Primary wave B may end about either the 0.382 or 0.618 Fibonacci ratios of primary wave A; neither can be favoured at this time.
If primary wave B unfolds as one of either a flat, combination or triangle, then the first upwards wave within it may unfold as a zigzag. This may be labelled intermediate wave (A) so far.
A breach of the black Elliott channel would provide confidence in this wave count.
Focus for the next week or so now shifts to identifying when primary wave B may be over.
ALTERNATE WAVE COUNT
MONTHLY CHART
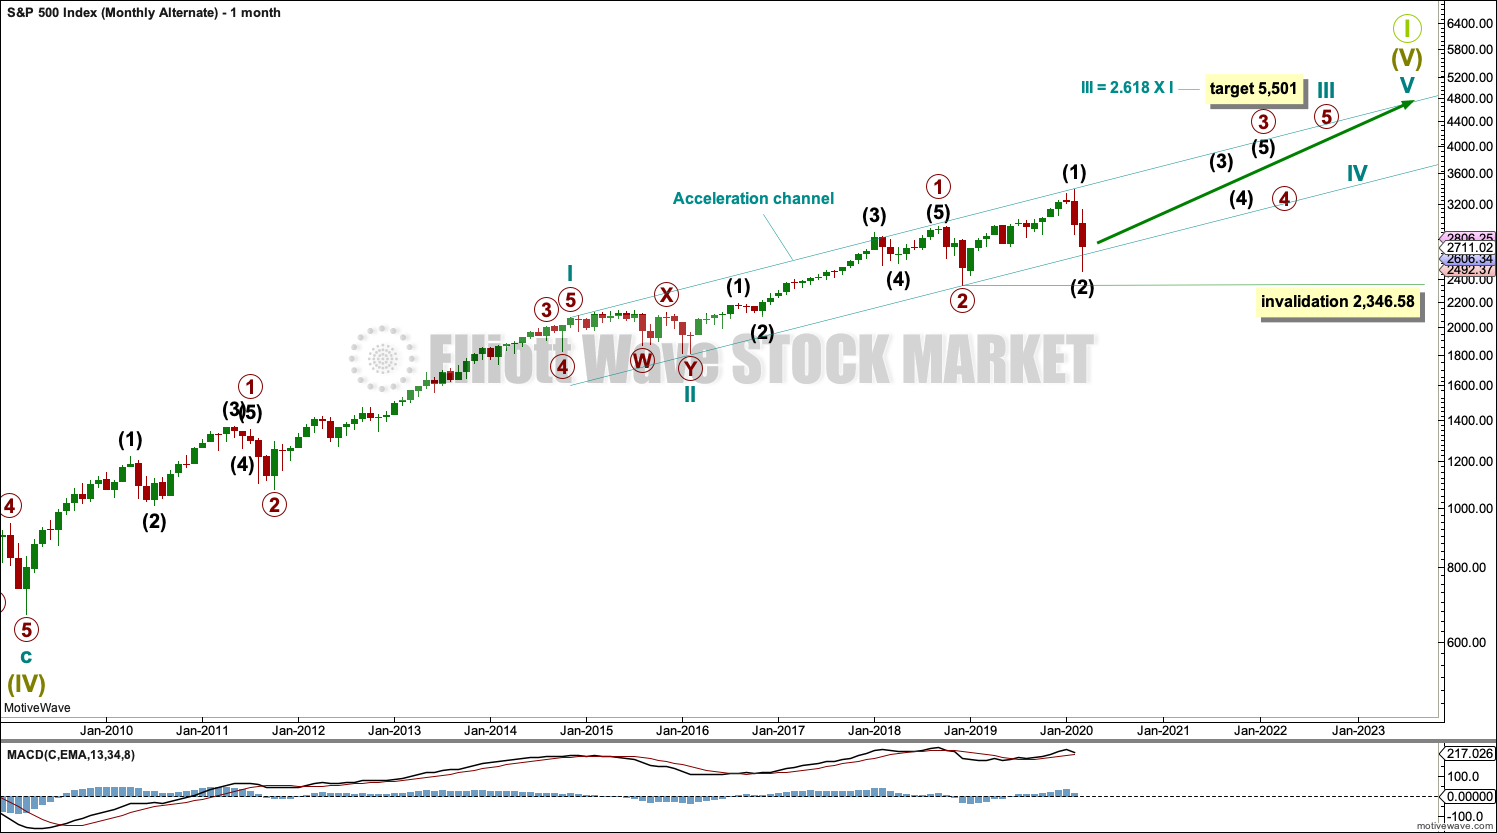
Click chart to enlarge.
It is also possible that there may be a series of three overlapping first and second waves for this bull market. This wave count would be very bullish once intermediate wave (2) is over.
Intermediate wave (2) may not move beyond the start of intermediate wave (1) below 2,346.58.
TECHNICAL ANALYSIS
WEEKLY CHART
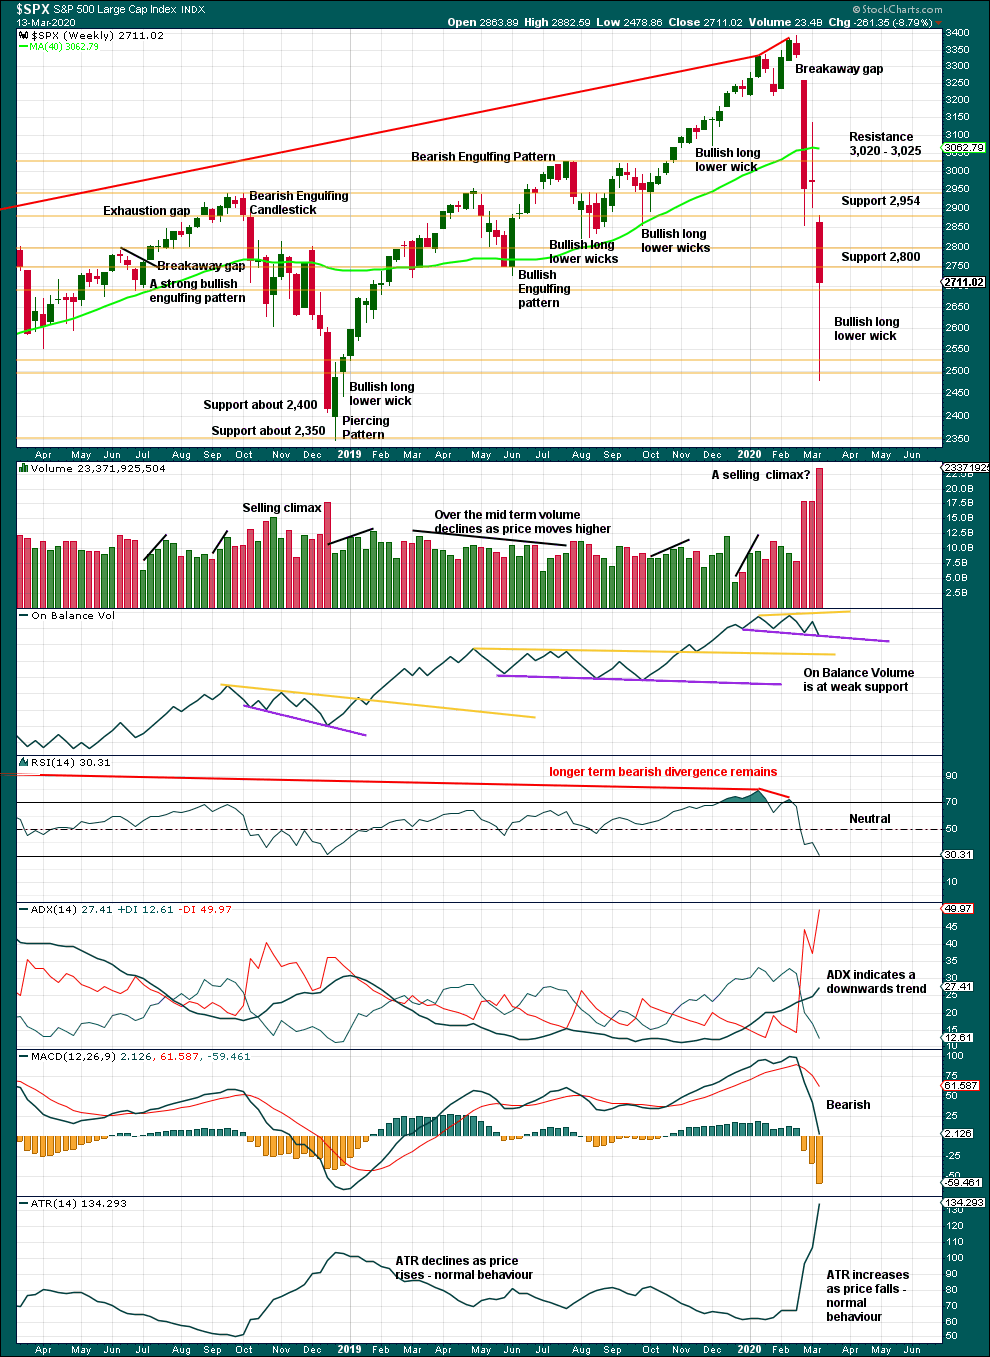
Click chart to enlarge. Chart courtesy of StockCharts.com.
A 27% drop in price (high to close) no longer has precedent within the larger bull market.
At the weekly chart level, conditions are not yet oversold; there is room for downwards movement to continue.
However, the long lower candlestick wick this week is very bullish. It suggests a bounce may begin here within the downwards trend.
DAILY CHART
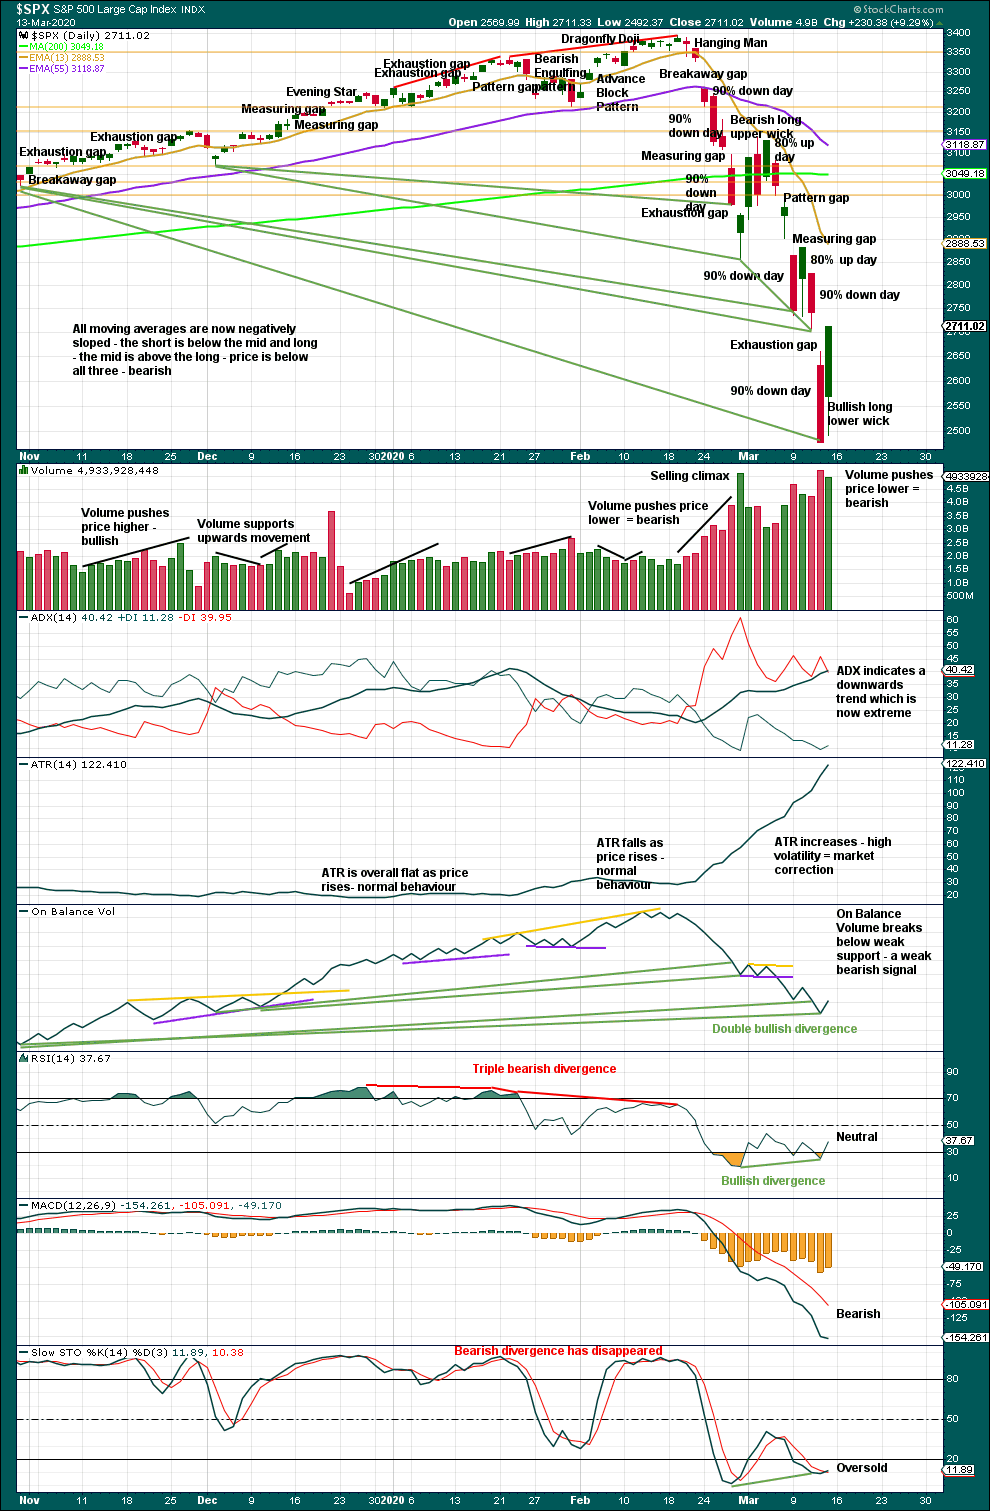
Click chart to enlarge. Chart courtesy of StockCharts.com.
There are now six 90% downwards days in this strong downwards movement.
The following indicators still suggest a low may be in place soon:
– RSI reached deeply oversold and now exhibits short-term bullish divergence with price.
– Stochastics reached oversold and now exhibits short-term bullish divergence with price.
– On Balance Volume continues to exhibit bullish divergence with price.
The following indications will be looked for to provide confidence that a low is in place:
– A 90% upwards day.
– Two back to back 80% upwards days.
– A bullish candlestick reversal pattern.
At the close of Friday, the last gap is closed and has now been renamed an exhaustion gap. The strong close near highs for the session and a bullish long lower wick suggest a longer lasting bounce may have begun here.
Data for Friday is not yet available. If it shows a 90% up day, then a sustainable low may be in place.
BREADTH – AD LINE
WEEKLY CHART
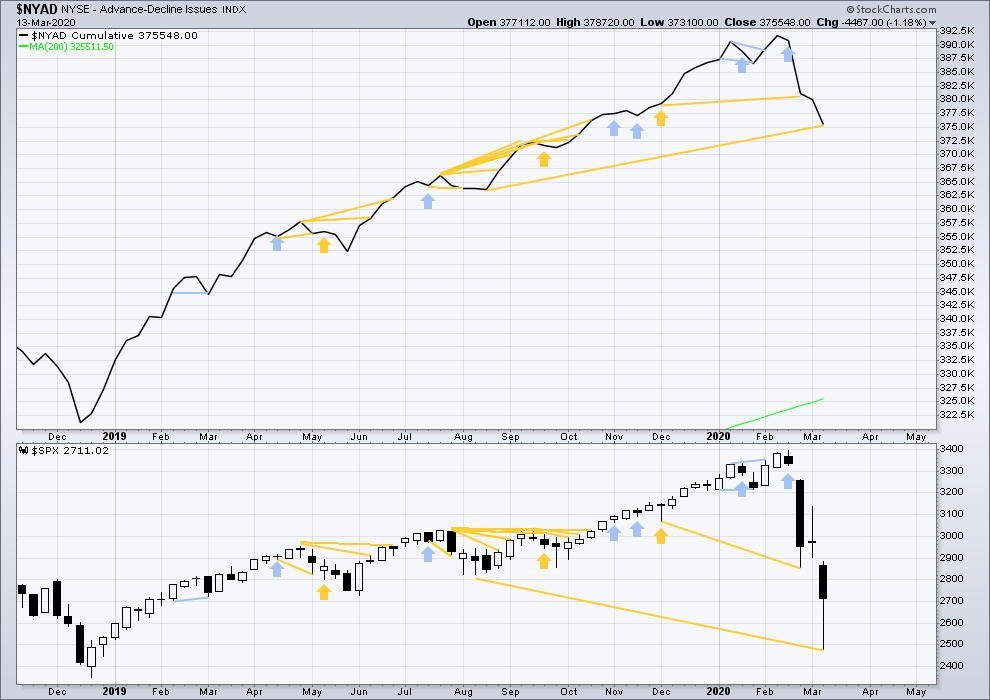
Click chart to enlarge. Chart courtesy of StockCharts.com. So that colour blind members are included, bearish signals
will be noted with blue and bullish signals with yellow.
Bear markets from the Great Depression and onwards have been preceded by an average minimum of 4 months divergence between price and the AD line with only two exceptions in 1946 and 1976. With no divergence between the AD line and price at the last all time high, this current bear market now makes a third exception.
In all bear markets in the last 90 years there is some positive correlation (0.6022) between the length of bearish divergence and the depth of the following bear market. No to little divergence is correlated with more shallow bear markets. Longer divergence is correlated with deeper bear markets.
This bear market comes after no bearish divergence. It would therefore more likely be shallow.
This week price makes new lows below prior lows of August 2019, but the AD line has not. This fall in price does not have support from a corresponding decline in market breadth. This divergence is bullish and supports the view that this bear market may more likely be shallow.
Large caps all time high: 3,393.52 on 19th February 2020.
Mid caps all time high: 2,109.43 on 20th February 2020.
Small caps all time high: 1,100.58 on 27th August 2018.
DAILY CHART
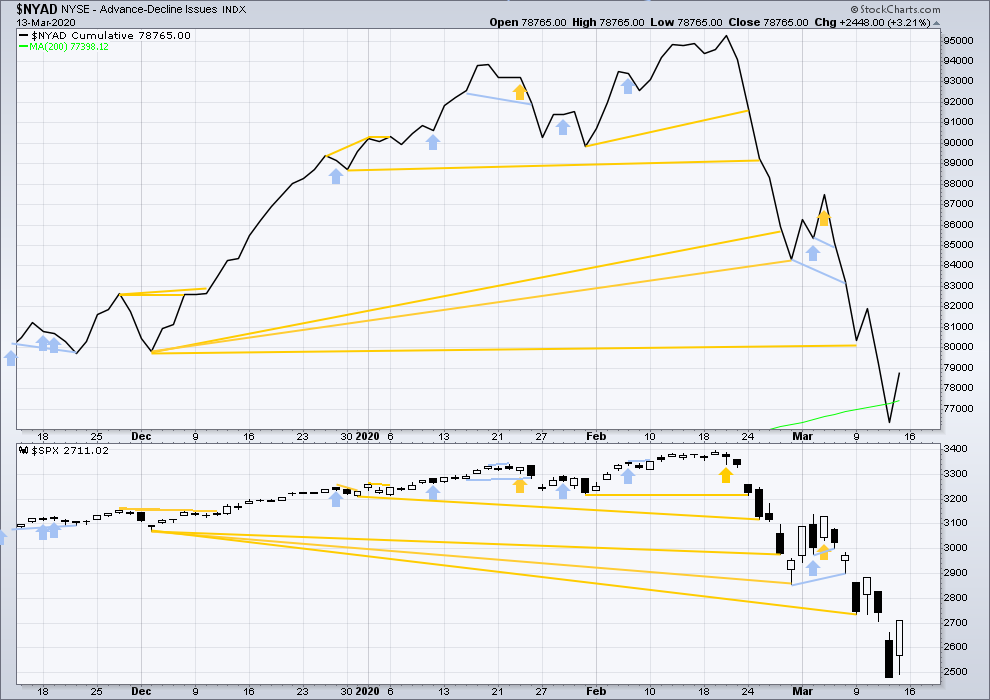
Click chart to enlarge. Chart courtesy of StockCharts.com. So that colour blind members are included, bearish signals
will be noted with blue and bullish signals with yellow.
Breadth should be read as a leading indicator.
Both price and the AD line have moved higher on Friday. There is no new short-term divergence.
VOLATILITY – INVERTED VIX CHART
WEEKLY CHART
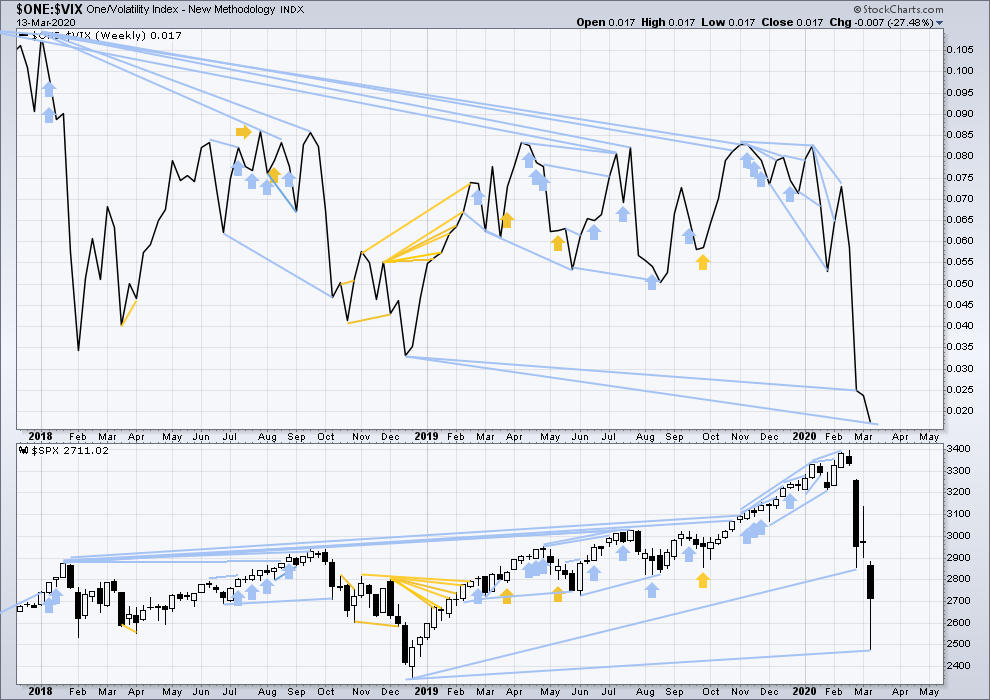
Click chart to enlarge. Chart courtesy of StockCharts.com. So that colour blind members are included, bearish signals
will be noted with blue and bullish signals with yellow.
The all time high for inverted VIX was on 30th October 2017. There is now over two years of bearish divergence between price and inverted VIX.
The rise in price is not coming with a normal corresponding decline in VIX; VIX remains elevated. This long-term divergence is bearish. It may now be resolved by this last fall in price, which meets the technical definition of a bear market.
This week inverted VIX has made new lows below the prior major swing low of December 2018, but price has not. This divergence is bearish and suggests this bear market may not be complete.
DAILY CHART
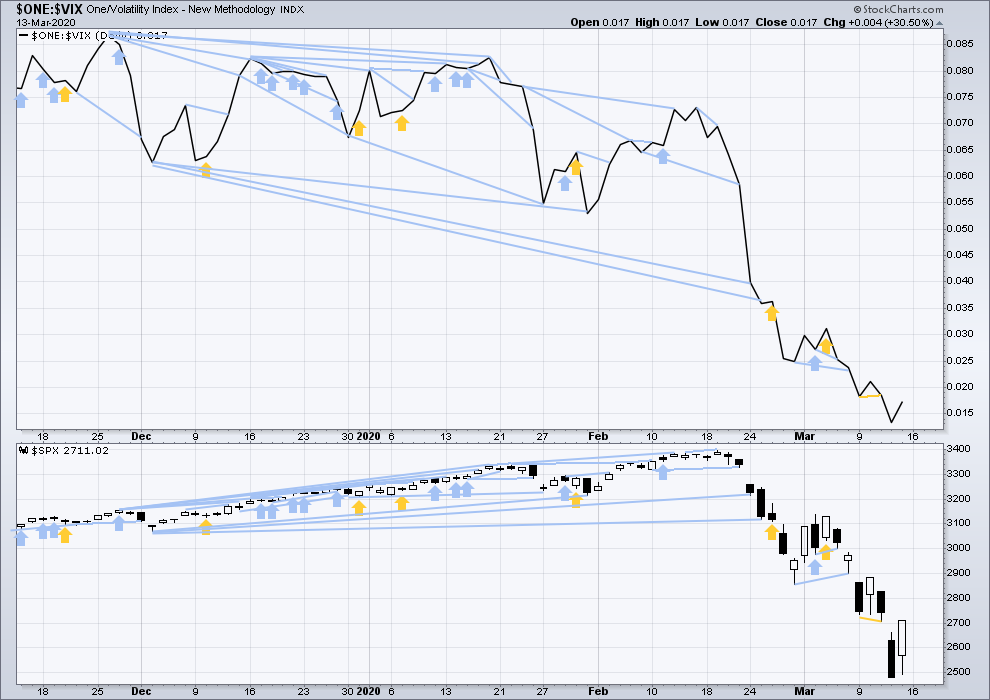
Click chart to enlarge. Chart courtesy of StockCharts.com. So that colour blind members are included, bearish signals
will be noted with blue and bullish signals with yellow.
Both price and inverted VIX have moved higher on Friday. There is no new short-term divergence.
DOW THEORY
Dow Theory would confirm a bull market if the following highs are made:
DJIA: 26,951.81 – a close above this point has been made on the 3rd of July 2019.
DJT: 11,623.58 – to date DJT has failed to confirm an ongoing bull market.
S&P500: 2,940.91 – a close above this point was made on the 29th of April 2019.
Nasdaq: 8,133.30 – a close above this point was made on the 26th of April 2019.
Dow Theory would confirm a bear market if the following lows are made on a closing basis:
DJIA: 21,712.53
DJT: 8,636.79 – a close below this point has been made on March 9, 2020.
S&P500: 2,346.58
Nasdaq: 7,292.22
Published @ 08:50 a.m. EST on March 14, 2020.
—
Careful risk management protects your trading account(s).
Follow my two Golden Rules:
1. Always trade with stops.
2. Risk only 1-5% of equity on any one trade.
—
New updates to this analysis are in bold.
Hi Lara,
did you have a chance to look at my multi-decade chart I posted yesterday?
Thanks again. I really want to hear your opinion.
I did have a look.
I think that you can’t start a Super Cycle count for this market in 1982. I think you need more data than that, and ideally any data needs to go back to 1929 to include the crash that precipitated the Great Depression.
Looking at a chart of annual data which goes further back, you can see that the correction of 1982 which you begin at is small in comparison to other corrections prior and after. It’s an odd place to start.
I know that S&P doesn’t go that far back, but you need to use an amalgamation of US stock market data right back to that. Because what we’re trying to chart in terms of Elliott wave is the bigger picture of the US market as it is illustrated by the S&P today.
However, the idea that the huge correction from 2000 to 2009 is wave 2, and the current correction is its equivalent wave 4, certainly has merit. It’s entirely valid.
RUT down 14% IN ONE EFFING DAY.
Utter utter insanity.
Glad I sold a fresh call spread earlier!!! As well as in SPX…
Just a few minutes left. I don’t think the 2401 early morning will hold.
Just in time to edit my post: BINGO 2399 and sinking.
Seabridge Gold (SA) sits on the world’s largest deposits of proven Gold reserves….
Verne have a look at Bellevue gold on the asx. Speculative but I think top quality bet
I am going to nibble on some nuggets…going long NUGT via June 10.00 strike calls.
I think we have a rocket-ship getting ready to launch….GID-YAP! 🙂
They are giving away shares of GORO.
It pays a dividend in the metal and is a great set-it-and-forget-it buy…..stash away a few thousand shares!
I bought some nugt earlier and took it later…just grabbing bites to enjoy!
Yummy!
Take a look at Sandstorm Gold… https://www.marketwatch.com/investing/stock/sand
Kevin, tracking LQD price action all morning. Heading up all day versus market.
Not sure what’s going on but I’d expect more stimulus attempts Tuesday and Wed (Fed meeting). Covering shorts here and guessing there will be some better entry points this week.
That little number is going much lower. The coming implosion of corporate bonds is the great unreported story of financial markets.
I thought the Fed canceled their meeting.
https://www.forexlive.com/centralbank/!/feds-powell-says-there-will-be-no-fomc-meeting-this-week-action-today-instead-20200315
GUSH is trading at 0.66
Can anyone say: “REVERSE SPLIT”??!! 🙂
How long ya think?
There is some funny business going on with bids today. I don’t know if anyone noticed but the bid ask on SPY puts expiring today and well over ten handles in the money were seeing a bid ask at the open of 1.97/2.10.
Anyone with an open order to sell at the market got HIJACKED!!
Wassup wid dat?
Make sure you use LIMIT STC orders people…!
Another case in point:
Why is GUSH and DRIP BOTH down today?
Very strange indeed!
When we gonna buy silver ?
margin calls from longs trapped last Friday?
The Mint has run out of Silver Eagles.
Does anyone really believe LBMA has actually delivered several times the tonnage of yearly Gold production as they claim?
How do they get away with this kind of balderdash, I ask you….HOW????!!! 🙂
BLK short one on my best of the year!!!
Man O’ Manischewitz!!!
wow…nice. Epic, in fact.
shorting the movie theaters was a no brainer- $CNK
yahooooo
Keep your accounts safe people…sell that premium! 🙂
New VIX high hinting the first impulse down not done. We still COULD be in some kind of third down. Note also absence of any kind of capitulation wick.
Rumour on the street is that the insane rsk-praity trade nowhere near done being unwound! Were these people INSANE??!!!
The SNB was loaded to the gills with tech treats! Yikes!
I saw that with the VIX. Very ominous.
Verne – SNB?
Swiss National Bank.
They have been taken to the WOOd-SHED…and administered a SEVERE spanking…remember these turkeyes are permitted to leverage 30:1
LOL! Compamies are now announcing that they are halting share buy-backs…!!!
Ya think??!!
A turn at the 50% retrace of Friday’s to today’s low, classic. Looks like the move down from Friday’s high was minor 1 of Lara’s new model below, the move up is minor 2…and minor 3 down is starting. Could be. Or this is just minute a of minor 2 up, minute b down is in play now, and a minute c up to the 61.8 (2594) or 76-78% (2644) area will come next.
A turn at the 50% retrace of Friday’s to today’s low, classic. Looks a lot the move down was minor 1 of Lara’s new model below, the move up was minor 2…and minor 3 down is starting. Could be.
Hi Rodney. I’m still inept at posting. I posed the question to you, “what are you looking to see before recommitting to the long side”…It ended up way down the line as a reply to Kevin…not sure if you would see it..so, I reposted. Thanks for your comments.
I happened to see it and respond. But here is what I wrote:
———————————————————–
Lara lists many of the things like a 90% up day or two back to back 80% up days with a bottoming candlestick etc. Plus I watch for all sorts of bullish divergences. Finally, I always check out Ciovacco end of week analysis.
———————————————————–
Also trend lines are very important. In other words, we need to break out upwards. In addition, I don’t like trading B waves because they can morhp into over 20 different patterns.
Finally, I am not sure I am looking to buy everything at the bottom. At this point, when I do go long, I will use a “scaling in” process which can be based both on price and time. For instance, 25% a month for 4 weeks or 4 months.
Right now, I do not think we are near a bottom despite the extreme oversold and divergent indicators. We are sort of in uncharted territory with a ‘real’ Black Swan event.
Thank you Rodney. I appreciate the double duty.
My updated R2k view, fairly consistent with Lara’s revised proposed SPX count below. Fibo fitted targets in blue.
Anybody buying now?
Brave indeed to swim in these shark infested waters.
Quite the opposite: waiting for the “high” for more selling…
Smart move Kevin. I am sitting on sidelines as too risky for me for now.
Was Friday a 90% up day? In the video it was said that you would know on Monday. Thank you.
80 per cavacccio
I try to keep an even keel and not get too excited about either winning or loosing trades… but pardon me….
BOO-YAH!!!!
Massively shorting the shake-the- trees Friday ramp was one of the toughest trades I have ever made.
When the FED attempted to pull another rabbit this week-end I was prepared for some serious PAIN this morning…NOT!!!
One HAPPY trader…not so much about the cash, nice of course, but more about calling the bankster bluff, and living to tell the tale… 🙂
Yaaaaaaaaahooooooo
I know what YOU did…he!he! 🙂
Panama City will be locked down within a couple of days. Looks like we may be here for about 8 weeks in this little apartment.
Internet Chess perhaps..? 🙂
Verne…try me at chess.com!!! “zinc1024”. I play all the time. I’m not very strong…
🙂
Sent you a chess friend request
I don’t like chess. You’d think I would, but I don’t.
Good morning everybody. Two ideas on the hourly chart today. The alternate is invalidated with continuing falling price.
A zigzag is still seen as unfolding lower. This first chart follows the main wave count, but I may label these 1 and 2 rather than main and alternate. They’re about of even probability.
The lower target at 1,708 is looking more possible.
Second idea. Arnaud has posted this below, and I agree, it has a pretty good look.
An impulse unfolding lower, only primary A may be nearing completion. This idea fits with the lower target at 1,708.
Lara, at what depth of overall “correction” (bear market) do we need to start considering this potentially GSC wave II?
I’ve been wondering about this too.
It needs to breach 666.79 for that.
Using vanilla Fibo extensions of A to project the bottom of C down gives me:
127%: 2225
162%: 1904
Equality of C with A: 1788
Chart shown, with Fibo levels, projection of A from top of B, and my Fibo fitted target levels in blue.
Might we see a -20% lock limit down day here today?
My oh my…
Yes!
The good news is we may see the best buying opportunity in a generation coming ahead.
Just now reading in NZ media info about China:
“China has closed all emergency hospitals set up in Wuhan, new infections have almost reached zero, and citizens are starting to reappear in public spaces again as factories increasingly get up and running. These developments tell us that there is light at the end of the tunnel – though China still remains far from operating normally.”
If this bear market follows the Covid-19 life cycle / epidemic timing, then it may last about another 8 weeks.
I don’t think China is “the norm”. China used extreme measures to get control. Most western countries, and most 3rd world countries, won’t or can’t do that. And some (like the US and England) have just bungled their response. I’m not so hopeful. I think many countries will be much more like Iran and Italy. But maybe the broad “social distancing” action now happening in the US (which will crush the earnings of companies over the next several quarters; will that really be all priced if CV rates start falling in say 4 weeks?) will have a dramatic impact.
Very important distinction Kevin. You are EXACTLY right on that score…
squaw valley was like a bay area spring break party this weekend- until they shut everything down.
did you come across the Dean Koontz conspiracy theory? A fiction novel writer predicting this with uncanny coincidence in 1981- Its been proven mostly coincidental but the similarities, are of course, striking and one key note in the book was that the virus then ‘disappeared’ as quickly as it came – circling back again in another ten years.
Except the price pattern here leading to and since the ATH is a striking mirror of 1929. Which took a few years to reach bottom, with a total price fall of -89%.
Also, Jeff Cooper’s historical analogue and Gann cycle work points to a massive price collapse THIS WEEK, centered on Wednesday.
BTW here’s a chart with the channel down. Note Friday’s action came right up and tagged the upper channel line.
Gann Theory is really interesting. about 3 years ago I was aiming that direction but got swept up with Elliot Wave and Laras site… you’ve reminded me to dust those books off!
Morning Rodney. What are you looking to see before recommitting to the long side?
Lara lists many of the things like a 90% up day or two back to back 80% up days with a bottoming candlestick etc. Plus I watch for all sorts of bullish divergences. Finally, I always check out Ciovacco end of week analysis.
A lower VIX high may be signaling end of a fifth down to complete an impulse.
For the past decade traders have watched in amazement as the banksters violently arrested every attempt at impulsive declines in this market, resulting in three wave structures, and resumption of the up-trend. Apparently the decision to kill the current potential larger degree impulse down was made early and they were convinced the 50 basis point rate cut ahead of the regularly scheduled meeting would force a reversal. You saw what happened.
Last Friday, they pulled out ALL THE STOPS. What they did was historic, resulting in not only the greatest intra-day market gains in history, almost 10%, but also the greatest intra-day trading range ever. Those of you watching the sideways coil knew that move was extra-ordinary, and it certainly was. It was inspired by desperation and a determination to artificially put in a market bottom.
It would seem the desperation turned to outright panic, if not terror, over the week-end. They could not wait three days to act at the next meeting before announceing a 100 basis point rate cut and Q.E. infinity.
Mr. Narket’s response? Trigger the circuit breakers with a futures limit down move.
I knew this day would come. It is stil stunning to see it unfold.
Just wanted to give a bit of context to Kevin’s reference to a possible market closure. So far the bankstets are facing an epic fail. It may be their strategem of last resort. Trade Safe!
A fun ( and funny!) read…
https://www.zerohedge.com/markets/pray-powell-world-hit-12-trillion-dollar-margin-call
Folks, what happens if the markets SHUT DOWN?
In particular, what happens if for example I hold in the money puts, the market shut down, and while it’s shut those puts expire. Someone is telling me that Schwab told them “the puts will be worthless”, i.e., the “last price” doesn’t effectively get honored.
Any insights into this as a trading risk????
ps: I’m not talking about brokerage bankruptcy, just a “temporary shutdown” that perhaps lasts for weeks.
Such a scheme to defraud short-side traders would not surprise me in the least.
If they try it, and refuse exercise /liquidation of ITM contracts there WILL be class action lawsuits…guaranteed!
Not a bad idea to anticipate such an eventuality.
(Another reason I love credit spreads…! ) 😉
Ah, right…they expire early “valueless” and we hold all the dough!! I should have thought of that…being such a fan of credit spreads!! Got a big such call spread on as a matter of fact in SPX…
🙂 🙂 🙂
Kevin – they will use the same logic that had been used in previous national emergency. I am sure there is a fine print somewhere that clears them of any liability.
Is it frozen until the cash open
Most probably, unless it gets the bid and absorbs everything sitting on the offer before RTH opens..
In short, it can not go down any further until RTH now but if it gets the bid before RTH it can rise.. the market is not halted, it’s just there’s too much on offer for it to rise.. hope it helps
Circuit breakers triggered in futures once again. The tree shaking move on Friday presaged such a possibility. The FED announcements are being correctly seen by the market as capitulation.
Only the slowest of wit will fail to grasp what just happened. They are now out of ammunition, and their egregious market manipulating days are done.
Here is the truth – The size of the disclosed intervention pales in comparison to what they have been already doing surreptitiously, yes, even beyond repo!
The strategy now is to attempt to influence market psychology with public jaw-boning about doing, a la Draghi. ” Whatever it Takes!”
How about 2 Quadrillion?
The stock market seems to have realized that the corporate bond msrket, where the real action will unfold, is about to implode.
Nice head-fake from the coil…did anyone bite? 🙂
Verne – I had folks jumping for joy on zero rates and liquidity. I was like wow…
Totally agree Verne.
Nothing is left in the chamber. I do believe as per Lara’s analysis. Bounce to close too 2900 and then the house of cards will collapse
I sadly missed it; a fantastic opportunity for some intra-day $’s!!! I was monitoring it as usual but then got sidetracked on other business in the final 45 minutes. But had I gotten long ZERO CHANCE I’d have held over the weekend, lol!!! I’ve heard someone on this forum talk many times about violent counter-trend rallies…Verne. I listen!!
That all said, I do have a large positional short and am quite please with this future’s action. And a far deeper ‘fly in RUT too…
🙂
Truth, Verne. I’m now starting to worry about our cash positions.
Cash should be O.K. , unless the brokerage goes under. Take advantage of the service offered by some to sweep unused cash into a FDIC account. Truth be told, no way the FDIC could cover everyone.
I have seriously considered liquidating most of my accounts prior to a high degree third of a third after a final top. The risk of loss of cspital is very real.
And what, taking delivering of suitcases of cash???
Your money nominally has to sit SOMEWHERE, and isn’t “everywhere” going to be DOA if the entire financial system breaks and all the banks and brokerages claim bankruptcies? Are we really having this conversation???? Seems surreal.
Somehow I can’t see the 0.5% who own and operate the whole thing allowing the gov’t they also own and operate to allow that, since they have trillions at stake. But maybe they get paid off and we Little People just eat it? I dunno…this is far beyond my pay grade!
Frozen …
Gloomy research this weekend:
https://www.bloomberg.com/news/articles/2020-03-15/goldman-sachs-warns-s-p-500-might-not-bottom-until-2-000
And now Fed cut the rate to 0 and will buy more Treasuries and MBSs for $700B. The QE continues as expected
This will fail as well…give it couple of weeks…
0 to 0.25%. It does not offer significant help against a collapse in consumer spending. The rate cut last week did not stem the selling pressure on Wall Street. I do not think this rate cut will be effective in the immediate future.
I think it could work as a bazooka, especially with the quadwich this Friday….
The acceleration in Coronavirus spread will slow down in 2-3 weeks then it will decline… similar to china & SK…
Market can bottom before the Coronavirus spread peaks.. but we were expecting a bounce this week anyways, let’s see if it sustains or there will be lower lows.. open to all possibilities..
On what basis are you claiming CV spread globally will peak in 2-3 weeks???
That seems EXTREMELY unlikely to me. The models (based on it’s actual spread rate and historical analogues) don’t indicate that in the slightest. The models indicate broad world-wide contagion.
S. Korea appears to be an outlier. Italy and Iran are the more typical scenarios, and the completely inept US response has the US very much in that same scenario. I’d love to hear what rationale you might have for that.
Hi Kevin,
I have posted an article before which shows that such cases don’t rise exponentially but have an ‘epi curve’…
Which shows how it was flat in china initially then started to rise exponentially then peaked and started to decline… it could then become like a sign wave….
So yes US is a bit behind and no of new cases is gonna rise exponentially in next few weeks before it’s peak.
Here’s the link again
https://voxeu.org/article/it-s-not-exponential-economist-s-view-epidemiological-curve
The voxeu article is good, and from a reputable author, but measures taken in Asia are not taken in the West.
This is a (long, and not from a such reputable author) article that explains why SOCIAL DISTANCING is the only remedy:
https://medium.com/@tomaspueyo/coronavirus-act-today-or-people-will-die-f4d3d9cd99ca
(I would tend to believe the 2nd one…)
Thanks for your reply.
The shape of the curve over it’s entire history doesn’t say anything about how high it goes. The data from China and S. Korea probably don’t apply to the US due to our late and ineffective response. Italy and Iran would appear to be more likely models of what will happen in the US. And other countries like England that are reacting very slowly. I hope I’m wrong. Like everything, the future isn’t pre-determined: all we can do is estimate probabilities.
The big news is the USD-swap lines, not the rate cut
you are right Rodney, market seems unimpressed, futures are significantly down to start.
Yeah a bit concerning reaction but it’s a quadwich, so there will be all kinds of shenanigans and exaggerated moves this week IMO
Futures down across by 4+ %… Significant recession coming based on this action by FED
But I like that they are proactively doing it rather than waiting for a recession to act, this action will help with the liquidity and soften the blow…
Well, COVID-19.. it’s not exponential growth but will follow ‘epi curve’.. A very good read below
https://voxeu.org/article/it-s-not-exponential-economist-s-view-epidemiological-curve
Great social isolation simulations in this article:
https://www.washingtonpost.com/graphics/2020/world/corona-simulator/
That’s what they hope for to achieve through social isolation. The question is will that work in US? It’s only assumption.
And don’t forget what the result of “social isolation” is. Huge economic slowdown.
Dividends are the collateral damage of this crisis.
In Europe, shareholders general assemblies have been postponed, which means dividends have been postponed or canceled (dividends are approved at the meeting). This lowering of dividends has massive effects in the market:
– The March/June basis on the Eurostoxx moved by 40 points on Friday (this is not a panic effect of people rolling position, this is a repricing caused by delay of dividend payments). There is no hedge against this…
– European banks have issued massive autocall positions. The lower dividends make them massively long, and they have to sell to hedge.
– Vol target funds have been deleveraging the entire week, and this is not finished.
So, the selling pressure coming from Europe is not finished. Again, this selling pressure is caused by re-hedging caused by changes in market factors, it is not some speculation by banks (regulators across the globe prohibit proprietary trading).
I have some doubts about wave (2) of this (A) wave. It’s a quick (2), followed by 1 and 2 of (C), so the main count is (2)-1-2. However:
1/ I think this (2) counts better in 5 waves, which was actually the main count when it was developing (refer to analysis on March 4 & lots of expectation for a correction upward to maybe above 3000 at the time).
2/ The Dow Jones made a new high on March 4, so the count for the Dow is A-B-C making (2), not (2)-1-2 as on the SPX.
3/ The NDX did not make a new high on March 4, but has a text-book 5 wave count for the first leg up.
In my view, it is very possible that the last wave up was an aborted C (SPX has not made (2)-1-2, but A-B-C(aborted) making (2)). Therefore, the drop since March 4 is only in 3 waves, and Friday 3:30 PM action is only wave C up of a 4th wave.
I like this wave count better…
Wave 4 is capped at 2835 (wave 1 territory), so there is a nice short to play with a tght stop.
🙂
So, Cesar and I are now back in Panama city. You may have noticed from last post that we are in the process of emigrating. Panama is a nice central hub for us to explore more waves to surf. The infrastructure is good and it’s safe.
But now we may be stuck in this apartment in Panama city because Covid-19. I mean, it could be worse. But there’s no surf here and I left my surfboard back with family in Texas.
We were only supposed to be here a couple of weeks to orient ourselves and make our residency applications. But the government wants everyone to stay at home and flights are being cancelled.
So I may be hanging out here more. I’ll have lots of time for more Elliott wave analysis and we’ll get lots of work done.
I’m missing my family and my son particularly. Our remote home in New Zealand would have been a better place to wait out a global pandemic, but here we are in Panama city.
Some of you may also be in similar situations, staying at home as much as possible.
After more than a decade with some folks here, I consider this membership to include friends. And I’d like for us to maybe hang out here a bit to cheer each other up, and get all geeky with technical analysis and following what the markets are up to.
Weekend futures down 100 points
Hi Lara,
I did some analysis on Super Cycle going back to 1970s. I don’t go back beyond that, but here is what I found interesting and Fib levels also falling in place nicely. Please see the picture and my explanation below and let me know what you think. It’s a big picture but it might shed the light on where we might land based on fib levels.
Explanation:
From the SPX yearly chart: Taking 1982 low of 102.2 as the beginning of the Cycle (it was the last lower low before nice run all the way to end of wave 1 in 2000 at high 1552.9. Then we have wave 2 with ABC correction (exactly how wave 2 should be) ending in 2009 low of 666.8 and it matches nicely with 61.8% retracement (on the left of the picture of wave 1). Then we go all the way up to wave 3’s high of 3393.5 in 2020, and now we are in wave 4 going down to 38.2% retracement (typical for wave 4) at 2136 which falls nicely to the high level of 2015 red doji before hitting lower low in 2016. Then we can go back up to 5 at one of the trend lines drawn (green) to complete this whole Super Cycle.
What I like about this analysis:
the trend lines drawn from 1980s fall perfectly on all the highs and lows over the course of this whole Super Cycle and you can clearly see the trend channels and can see how wave 3 just runs at much higher angle than the original trend which is typical of wave 3.
What I don’t like about it:
I’m not sure how to get to 3393.50 (2000’s high of wave 3) using fibs from 1982 low of 102.2
20 MA line perfectly follows the same angle as the trendline drawn which confirms that this is the major Super Cycle trend.
So what do you think about this approach? It’s also kind of ironic that if this approach has some standing, then 2000-2008 market which we call bullish in reality was just wave B of wave 2 correction:)
Thank you in advance for your input.
Just an update for my concern for not finding fib ratio for wave 3 above – it is actually exactly 1.272 of wave 1, perfectly fitting right there at 3393 level. See the picture attached. Now the question remains – when will we hit 2136 level bottom of wave 4 (38.2% retracement) – this year or next year or even more? But unless for some reason this was it for the wave 4 (the rout we saw so far), then no matter what market does as long as it’s not going above ATH at 3393, we are still in a bearish trend of wave 4. The trend lines fit perfectly.
Also, the angles of wave 1 and wave 3 are close to each other (around 45 degrees).
Lara, what do you think?
I am a visual thinker and I’m having a rather hard time visualising your description. Please could you put it on a chart and upload.
I attached a chart- you didn’t see it? Here It is again.
Just in case.
I also posted another update, but it says it’s waiting for moderation. Here it is below:
Just an update for my concern for not finding fib ratio for wave 3 above – it is actually exactly 1.272 of wave 1, perfectly fitting right there at 3393 level. See the picture attached. Now the question remains – when will we hit 2136 level bottom of wave 4 (38.2% retracement) – this year or next year or even more? But unless for some reason this was it for the wave 4 (the rout we saw so far), then no matter what market does as long as it’s not going above ATH at 3393, we are still in a bearish trend of wave 4. The trend lines fit perfectly.
Also, the angles of wave 1 and wave 3 are close to each other (around 45 degrees).
Lara, what do you think?
Hi Lara, I just resent graphs twice and both times it says it’s waiting for meditation before posting. Do y9y see the charts?
I see them
I found them in moderation. I’ve taken a look at your chart. I’m a bit overwhelmed right now with unfolding events and being quarantined in a strange city, will respond tomorrow.
Thank you, Lara. While it looks like we will have a negative return in 2020, it might be relatively quick to end bear market if we are indeed in wave 4 and retrace to 0.382 (normal for wave 4). It also corresponds to some fundamental analysts whose reports I have just read who predict 2021 to be a rebound year.
Melanie asked late Friday about how/where to learn about option spread trading. She mentioned theotrade and simplertrading.
Paying a few bucks for a one month “all you can eat” subscription to theotrade and binge watching most of their trading videos is a pretty good idea. Once you get the hang of their videos you can speed watch them too with lots of skipping ahead.
I would not recommend simplertrading for this purpose. I’m not aware that they have good basic educational material on spread trading. And their broad focus is on selling people proprietary indicators for exorbitant amounts of money. That said, a $7 one month trial membership for access to their “options” trading room is a good value if you are interesting in listening their their traders talk through the trading day. “Sam” is exceptional. John Carter is very good. Others…not so much, IMO.
The best way to learn about options is to use Thinkorswim or any platform that allows you to structure up draft trades and look at the profit/loss/probability curve.
Here are my key views on spread trade alternatives:
– I LIKE credit spreads, for two reasons, PARTICULARLY with the super high volatility we now have and hence super high option prices. Being on the receiving side of premium decay is a happy place and arguably gives edge. Second, when the trade goes your way, both the options that you bought and sold go to zero value. No one is going to exercise on your sold calls or puts and create a mess for you. If the trade goes against you, you are probably going to exit well before any chance of exercise. With a debit spread, it’s the inverse, and getting assigned is not a pleasant experience.
– I like two type of credit spread trades. The first in a deep out of the money sold credit spread in a strongly trending market. This should be a trade with between 1-1 loss to win size, to maybe 1.5-1 loss to win size. Identify a clear structural stop that gives you such a ratio. That should be a price point well below current market. So you get very high odds of making your profit. The second is a at the money sold credit spread, with a very tight structural stop. In this trade, you are going for something like a 1-5 loss to win size, with far higher odds of losing. But once you get into black, adjust to break even and wait to collect. Good for precision entries on market turns (tops or bottoms).
I like to trade only HIGH PRICED issues with option spreads. Why? Because that means each spread has a lot of “bang for the commission buck”. Spreads on $30 stock have poor commissions to max profit ratios vs. say a $100 or $300 stock. Also, you need to be sure the options market is reasonably liquid. If you look at the next monthly expiry (3rd friday of each month), there should be hundreds of options in “open interest” around the current price (unless price has moved very quickly and dramatically, in which case it takes awhile to build up open interest; look at the interest levels where prices was stable before). Spreads are ideally reasonably tight; if you see massive spreads, best to stay away. For all these reasons, trading the mega-caps and the broad averages is ideal. Note that with the options for RUT, NDX and SPX (the actual indexes), it’s all cash settled and there is zero risk of assignment (nothing to assign!). Also note that month options of these indices settle on the OPENING of the friday of expiry, while all stock and ETF options settle on the CLOSE of the day of expiry.
I like to use a spread of strike prices that give me AT LEAST $60 of profit per spread, but getting $150 up to $300 is great! Size the trade appropriately in terms of #” of spreads from there. Below $60 per spread and the commission vs. profit ratio starts getting out of wack.
Finally, butterflies. I like butterflies, but I suggest using “unbalanced” ones that assure you profits if price moves past your fly. I only use flies well away from the current price, when I have good reason to believe price is heading far and “that way”. Like now for a month out, with at a price well below Friday’s close!! The idea of a fly is you perhaps pay $200-$400 for it, you profit if you zoom by it might be $400-600, and if you NAIL it, perhaps $2500! On the other side, if price doesn’t go your way, you can get out before the profit/loss curve sinks alot, and maybe you end up only losing $100-200 instead of the full $$ paid.
Lastly, I do “trade” spreads. Note that when price moves sharply your way, you may be up 60-70% of your max profit. Do you want to wait weeks more to get the rest? Maybe, but the risk is that the market goes against you in a big way and goodbye to all your profits. Given “diminishing returns” due to limit on your max profit, maybe better to cash! And maybe if price comes back down you get another excellent set up and you can put on the same or similar trade! So you have flexibility with how you want to managed these things.
Always, always, always have a clearly defined structural stop that if hit tells you “my set up failed, time to take my medicine”, and take it. Never hold and hope.
I hope this helps launch you on profit spread trading. Best of luck.
ps: Melanie if you want to run your spread option trade ideas as you develop them by me here or in private on email, I’d be glad to give you my thoughts. zinc1024 at the gmail place.
Kevin,
Thanks so much for your thoughtful and detailed response. Much appreciated. As you can see I am quickly reviewing site at 2:45am EDT. I had an electric hot water heater fail tonight. Have spent most of night cleaning up and will spend next few days finding a repair man and pricing out electric HWH or tankless heaters. An unfortunate time for this to happen. BUT there is Never a good time for things like this to occur….so I will resume comments as soon as I can.
Also…thanks to Verne for his comment after close 03/13….possibly meant to answer another trader’s question, but informative.
Much to consider this coming week technically and fundamentally. Sometimes appropriate to step back and watch for clarity.
Synchronicity! My automatic garage door broke badly, probably terminally, over the weekend. A home: a hole in space you dwell in and pour money into!!
You’ve got that right!
I would highly recommend Tastytrade and Sheridan mentoring (which has a $49 trial, classes and live trading).
Tastytrade has tons of content, all day live programming, (including beginner level classes) and it’s free.
I tried the trials at theotrade and simpler options, and they weren’t for me. Your experience may be different.
Tha;nk you Davo. If I’m not mistaken Tastytrade is associated w/Dough. Please read my brief email to Kevin above….
Yes, they have their trading platform and brokerage, though I am a thinkorswim user so haven’t used them, but worth a look.
Tastytrade does a lot of research/backtesting about what actually works. As an old Investools student, they really changed by mind about probabilities and strategy.
Good luck with the water heater. They always go at the worst time! 🙂
Thanks much…Davo, I will look at them. I’m curious. Do you use Think or Swim to trade eminis or micro mini futures? If so, do you find their trading platform for futures efficient, easy to use and not distracting? There is a company in Chicago…Zaner… nice platform which you can minimize to a point where it sits at a small corner of your screen so you can concentrate on your charts, etc. while you manage your trade. Important when watching 2 different time frames intraday, and various indicators.
I have been in this situation before, and I have made the same mistake again…… so hopefully by sharing we can all make batter trades.
Friday 3/6 I bought June SPY puts, and added some Mon and Tues. I made the most money EVER on the (3) down this week. Locked is some profits Wed and Thur, BUT then ADDED April puts late in the day Friday looking for the (5) to break down….
The coil can be a great money maker, or it can BITE you…… scale DOWN (not up) to the appropriate size for such a volatile trade….
Again thanks to all who post…..
And thank you, Peter S.
Yes I’ve made that mistake several times Peter… the coil can unwind in the opposite direction, releasing that same energy in the opposite direction!
In real time, its impossible to say which way it will break for sure…
But who knows, maybe this wave up is actually intermediate 4, with the last leg still to bring the market down to 2350-2400… Remember the last 2 times we’ve had ramps of 5% and 7% last week, it all came crumbling down the next day… same thing might happen again… Is this a shake out also?
I actually had a long position that I opened on Thursday, and closed it as I saw the coil develop Friday… and then saw the rocket ride up as soon as I closed my long position! LOL :-/
I got busy on some paperwork just minutes before that big consolidation zone was broken to the upside…noticed something after market close about “10% up” and said WHHHHAAAAT??” What a final 20 minutes.
I think that was pure technical momentum trading and short squeeze action. I’ll be surprised if that isn’t fully retraced down this next week, and it wouldn’t even surprise me if it was retraced by the open on Monday.
To sum up the situation, the “TheoDark” analyst who updates several times a week with comprehensive analysis of fundamentals through the lens of economic reports, and has been very slow to identify the downside risk (because it’s not yet in the economic #’s), just said “the American economy is likely to completely shut down in April”.
I think that says it all. Total economic shutdown. Think that’s priced in yet? I sure as heck don’t.
I have somewhat large positional short via sold call spread way up at 2800 that expires in mid April. I’ll take the heat…because I just can’t see any way that the market is up there by mid April!!! Just seems impossible to me.
More wild times ahead for certain.
1 month is only 8% of full year. I think we’re pricing in 3 months of ~30% activity. Lower in March and April gradual increase in May and June. Interesting to see what happens to bankruptcies with oil related cos and small businesses.
BANKRUPTCIES is perhaps the HUGE issue ahead. Note what’s happened in the corporate bonds markets: TOTAL DESTRUCTION (look at LQD chart), and in both the low quality bonds AND the high quality bonds! “Unnatural moves”. What’s the reason? I think it’s because these companies face very real risks of extreme drops in revenue, and they are going to go bankrupt. Corporate borrowing since the 2009 finance crisis is WAY up from prior historical norms, and now that’s going to blow up. Chris (who may still be around and lurking??) used to point to this regularly as a hidden time bomb in the market.
Yes agreed, that’s the big x factor here. I’m tracking LQD. Any other suggestions how to track bankruptcies and stay ahead of the curve? Thanks.
Yes indeed, Kevin.
Classic “Shake The Trees” price action.
Classic ‘C” wave…. 🙂
C wave? You mean B wave that Lara referred to in the main count?
As long as Feds keep pumping money, liquidity won’t be an issue so maybe it’s not that bad, but yes, small businesses and high leverages businesses with no cash coffers will suffer for sure.
Thanks for sharing that Peter. It’s hard to share about ours losers, I know!! But it is absolutely the losers where we learn the most about improving our process and plan.
Thanks Lara. Both counts today have us in Cycle II where we are presumably close to the low 2350 with significant upside. I understand there is flexibility to some more bearish downside targets if things get much worse.
On March 11, the main had us in Cycle IV approaching the end of a super cycle. Is that count still valid? I have trouble keeping up with the higher level counts and am curious about the confidence in shift from cycle IV to cycle II. To me that is much more bullish long term.
Thanks for your help!
Apologies, I just reread your March 11 post and see that was labeled as P2 of Cycle 5.
So I guess my new question is, do you have an active count that has this down move as a primary 4 of cycle 5 or a cycle 4 move? Thanks again!
I have charted it and members have asked this question before.
I do not. The proportions are not good and it doesn’t fit into the channel as well. Because of the strong close below the channel on Thursday this move now looks like a correction of the bull market beginning March 2009.
Thank you!
So odds are we are somewhere between cycle wave 2/3 in super cycle 5? If that’s the case I believe we will ultimately have to test 2350 before the end of this drama.
Is it too early to target cycle wave 3 and 5? Trying to get a sense for longer term risk reward around 2350. I know it can easily be another 25% down to 1700, but we can hedge that risk.
Thanks for bearing with me, still trying to learn EWT on the side!
I have a target for cycle III on the chart posted below.
If Friday was a 90% up day that may become the main wave count.
If that happens, I expect it may be wildly unpopular here. And that’s okay. I’m gonna go with the math and data, I’m not here to win a popularity contest 🙂
And we tremendously value your analysis for that!
It up to us to input that into our own hoppers and add whatever other data we believe to be pertinent. That’s how I view it anyway.
You’re all too slow this morning so I’m gonna be first. It’s fair, it’s in the rules (which I made).
Lowry’s data for Friday’s session is preliminary. I won’t have access to their full data until Monday.
If Friday is a 90% up day then I’ll be publishing a wave count that shows cycle II over at the low, and it may be the main wave count.
This would be the daily chart, for now it is an alternate idea
And Rodney just beat me to it. Nice one Rodney!
This would be the hourly chart. Cycle wave II will subdivide nicely as a zigzag.
I know it’s a very brief cycle degree wave, over in just 16 days, but this particular market does tend to have extended slow bull moves and relatively fast and volatile bear moves. Durations for wave degrees are a guideline which should be approached with a fair amount of flexibility.
If this model plays out I’ll pass out.
Here’s the latest CV infection rates. Data for 3/14 is PARTIAL.
Clearly, absolutely GOING EXPONENTIAL. With all that that implies.
The data for 3/14 is in, and the total new infection count for “today” is yet higher still. The exponential rise continues.
Friday was only 80% up, not 90
Hey hey hey. #1 finally.