
A lower low and a lower high fits the definition of downwards movement, but the session spent most of the time moving price higher. The Elliott wave counts remain the same.
Summary: A short-term target at 2,173 may be about where a bounce or consolidation may begin. Thereafter, the bear market may resume.
The final target is now at 1,708.
If price makes a new high above 2,711.33 by any amount at any time frame, expect primary wave A is over and primary wave B has begun.
The biggest picture, Grand Super Cycle analysis, is here.
Last monthly charts are here with video here.
ELLIOTT WAVE COUNTS
MAIN WAVE COUNT
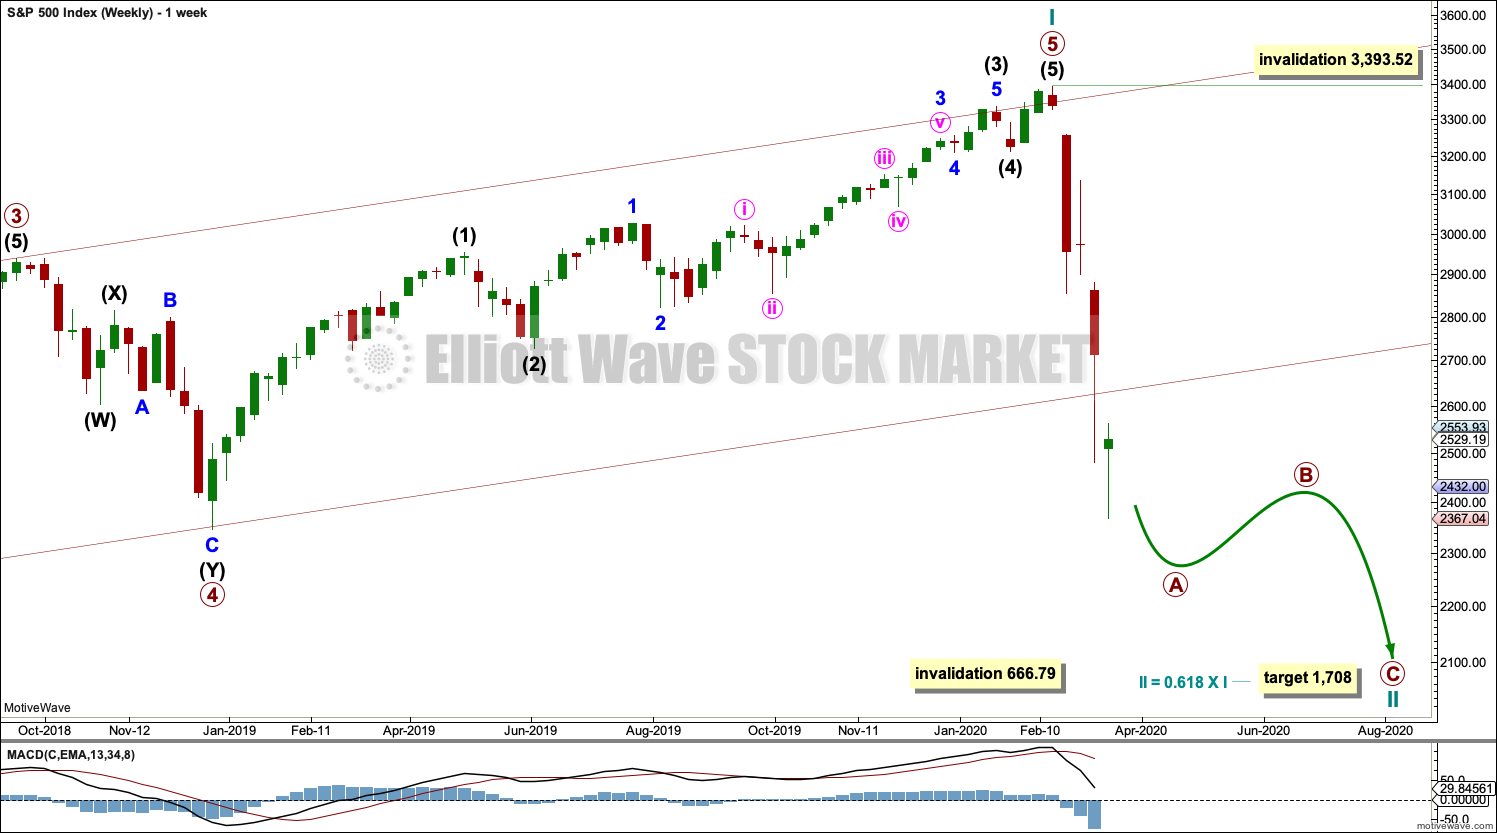
WEEKLY CHART
Click chart to enlarge.
Now that the channel is breached by a full daily candlestick below and not touching the lower edge, further confidence in this wave count may be had.
Price is now very close to the 0.382 Fibonacci ratio of cycle wave I at 2,352. The structure of cycle wave II needs further to go to complete. The next Fibonacci ratio at 0.618 is now a preferred target for cycle wave II to end.
Cycle wave II may not move beyond the start of cycle wave I below 666.79.
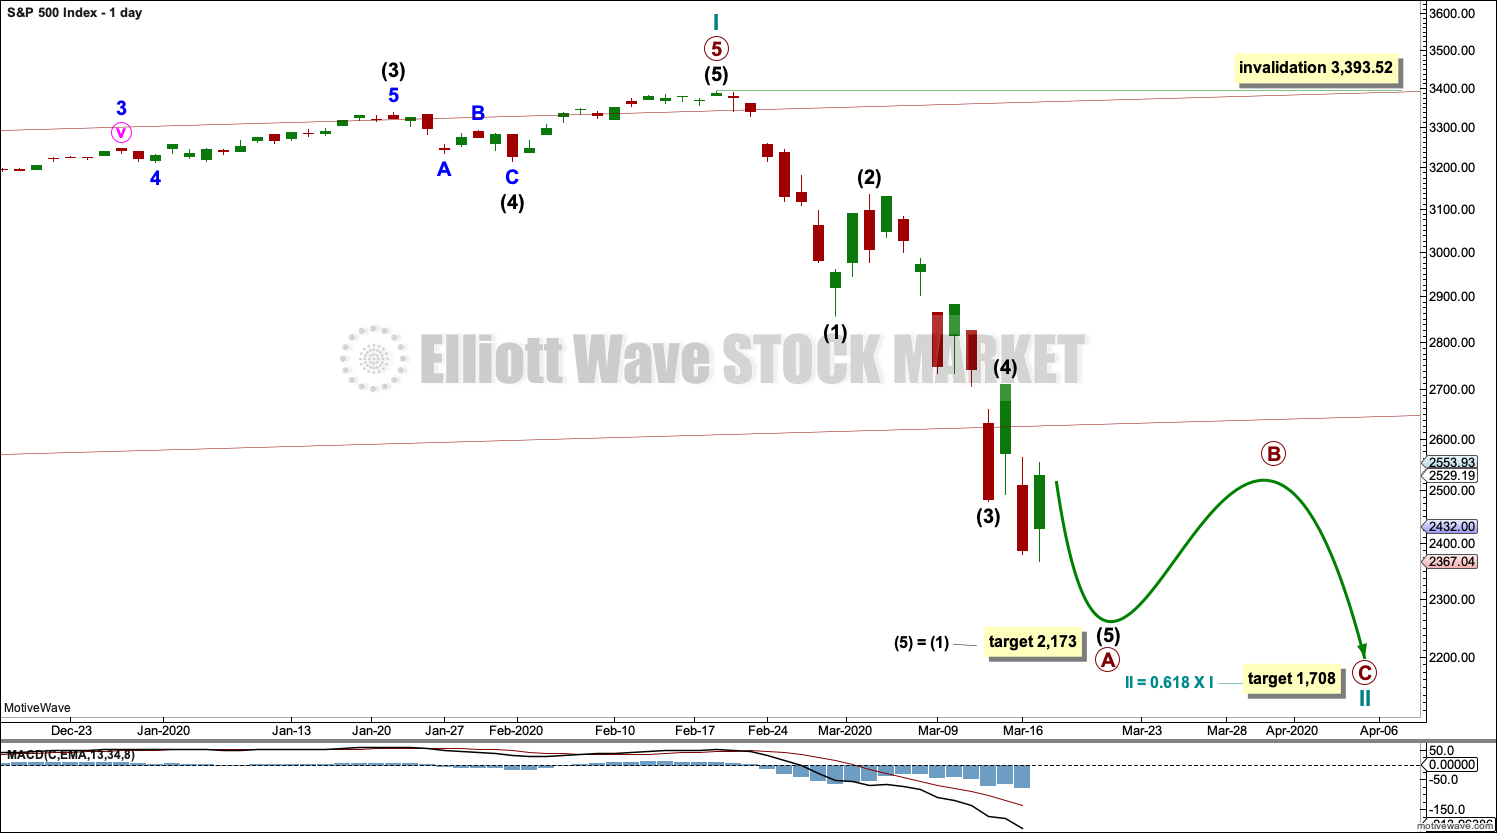
DAILY CHART
Click chart to enlarge.
Redraw the wide maroon trend channel carefully: draw the first trend line from the end of primary wave 1 at 2,093.55 (December 26, 2014), to the end of primary wave 3 at 2,940.91 (September 21, 2018), then place a parallel copy on the end of primary wave 2 at 1,810.10 (February 11, 2016). The channel is fully breached indicating a trend change from the multi-year bull trend to a new bear trend.
Cycle wave II may subdivide as any Elliott wave corrective structure except a triangle. It would most likely be a zigzag. Primary wave A may be an incomplete five wave impulse. Primary wave B may not move beyond the start of primary wave A above 3,393.52.
Within primary wave A, there is no Fibonacci ratio between intermediate waves (1) and (3). This makes it more likely that intermediate wave (5) may exhibit a Fibonacci ratio to either of intermediate waves (1) or (3). The most common Fibonacci ratio for a fifth wave is equality in length with its counterpart first wave.
HOURLY CHART

Click chart to enlarge.
Primary wave A may be an incomplete five wave impulse.
Draw a channel about primary wave A using Elliott’s first technique: draw the first trend line from the ends of intermediate waves (1) to (3), then place a parallel copy on the end of intermediate wave (2).
During bear moves, this market sometimes behaves like commodities. It may exhibit swift strong fifth waves. Look for the possibility for intermediate wave (5) to end with further strength.
Intermediate wave (5) must subdivide as a five wave motive structure, either an impulse or an ending diagonal. Within either motive structure, the second wave may not move beyond the start of its first wave above 2,711.33.
If price makes a new high above 2,711.33 and breaks above the upper edge of the black Elliott channel, then that may be taken as indication that primary wave A may be complete and primary wave B may have begun.
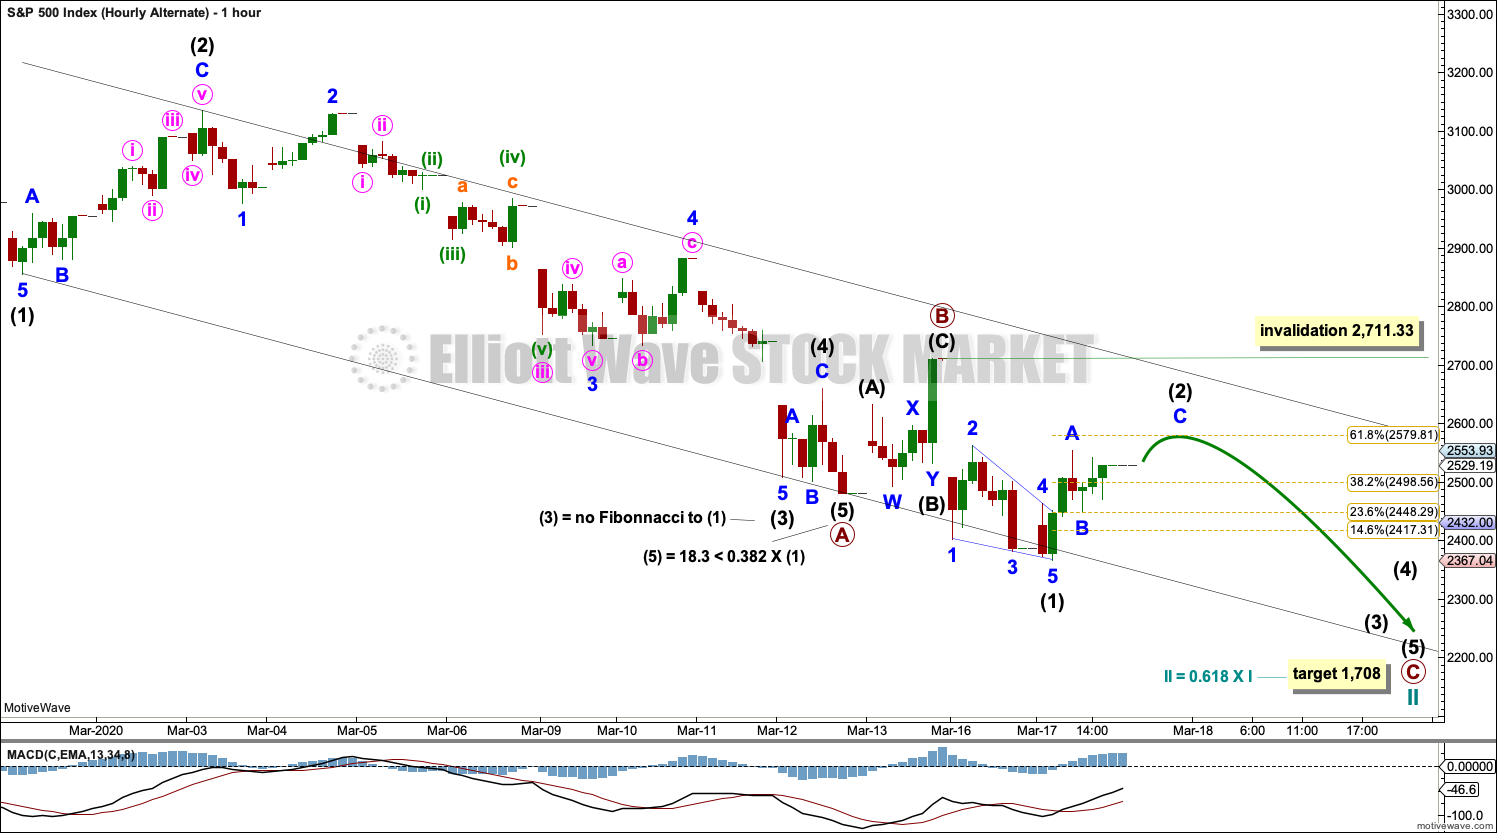
ALTERNATE HOURLY CHART
Click chart to enlarge.
It is possible that within a quick zigzag for cycle wave II both primary waves A and B may be complete. Primary wave B may have been a very brief and shallow zigzag.
Because of the brevity of primary wave B, this wave count no longer has good proportions.
The final target is the same. This wave count expects price may fall very quickly towards the target with very little interruption.
Within primary wave C, intermediate wave (2) may not move beyond the start of intermediate wave (1) above 2,711.33.
TECHNICAL ANALYSIS
WEEKLY CHART
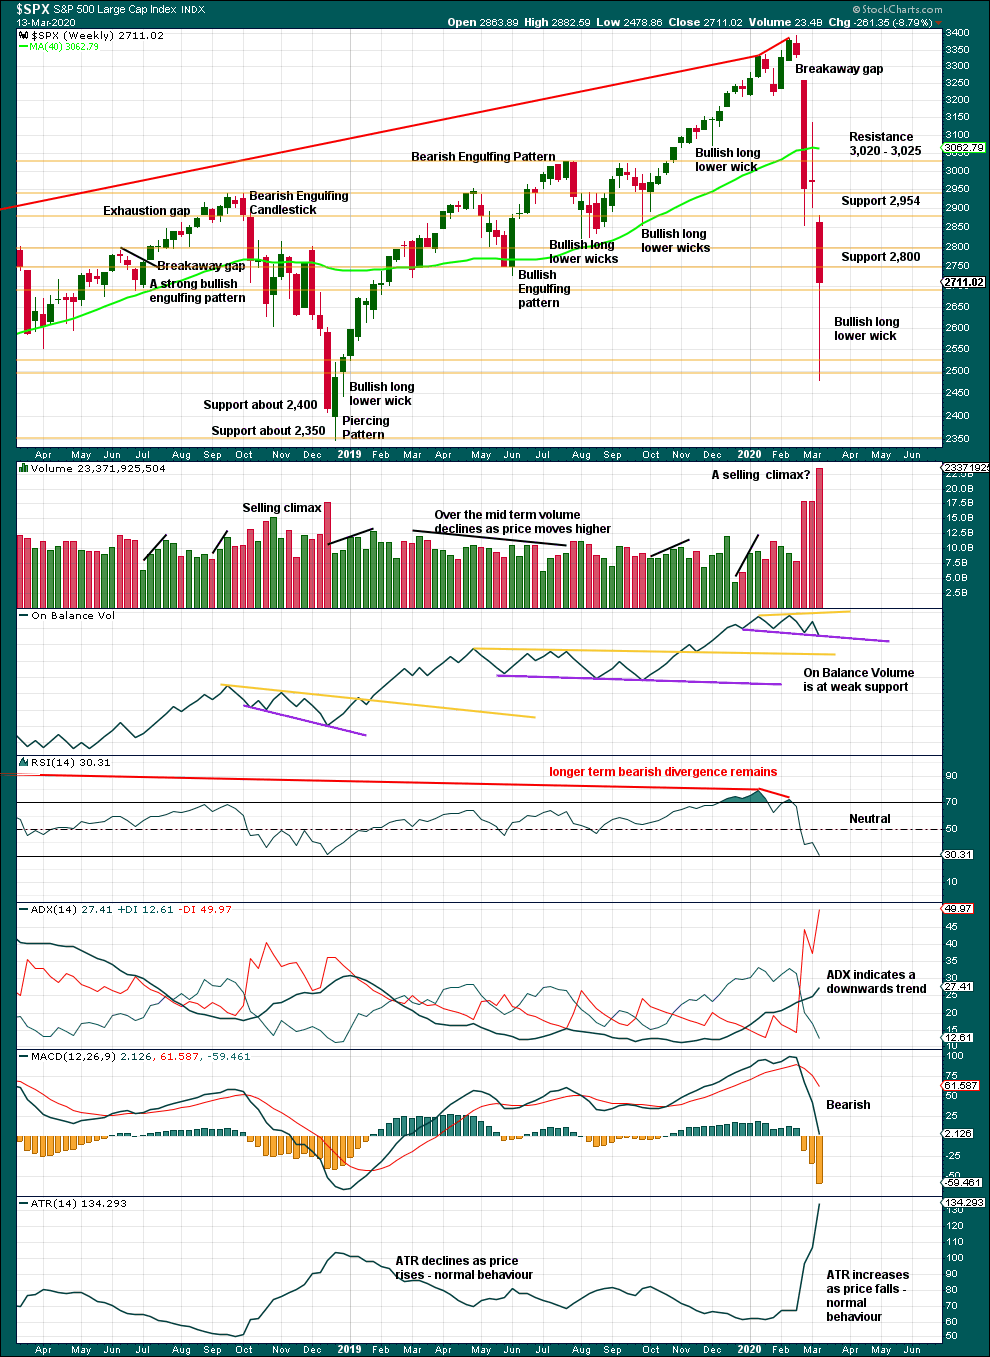
Click chart to enlarge. Chart courtesy of StockCharts.com.
A 29.7% drop in price (high to close) no longer has precedent within the larger bull market.
At the weekly chart level, conditions are not yet oversold; there is room for downwards movement to continue.
DAILY CHART
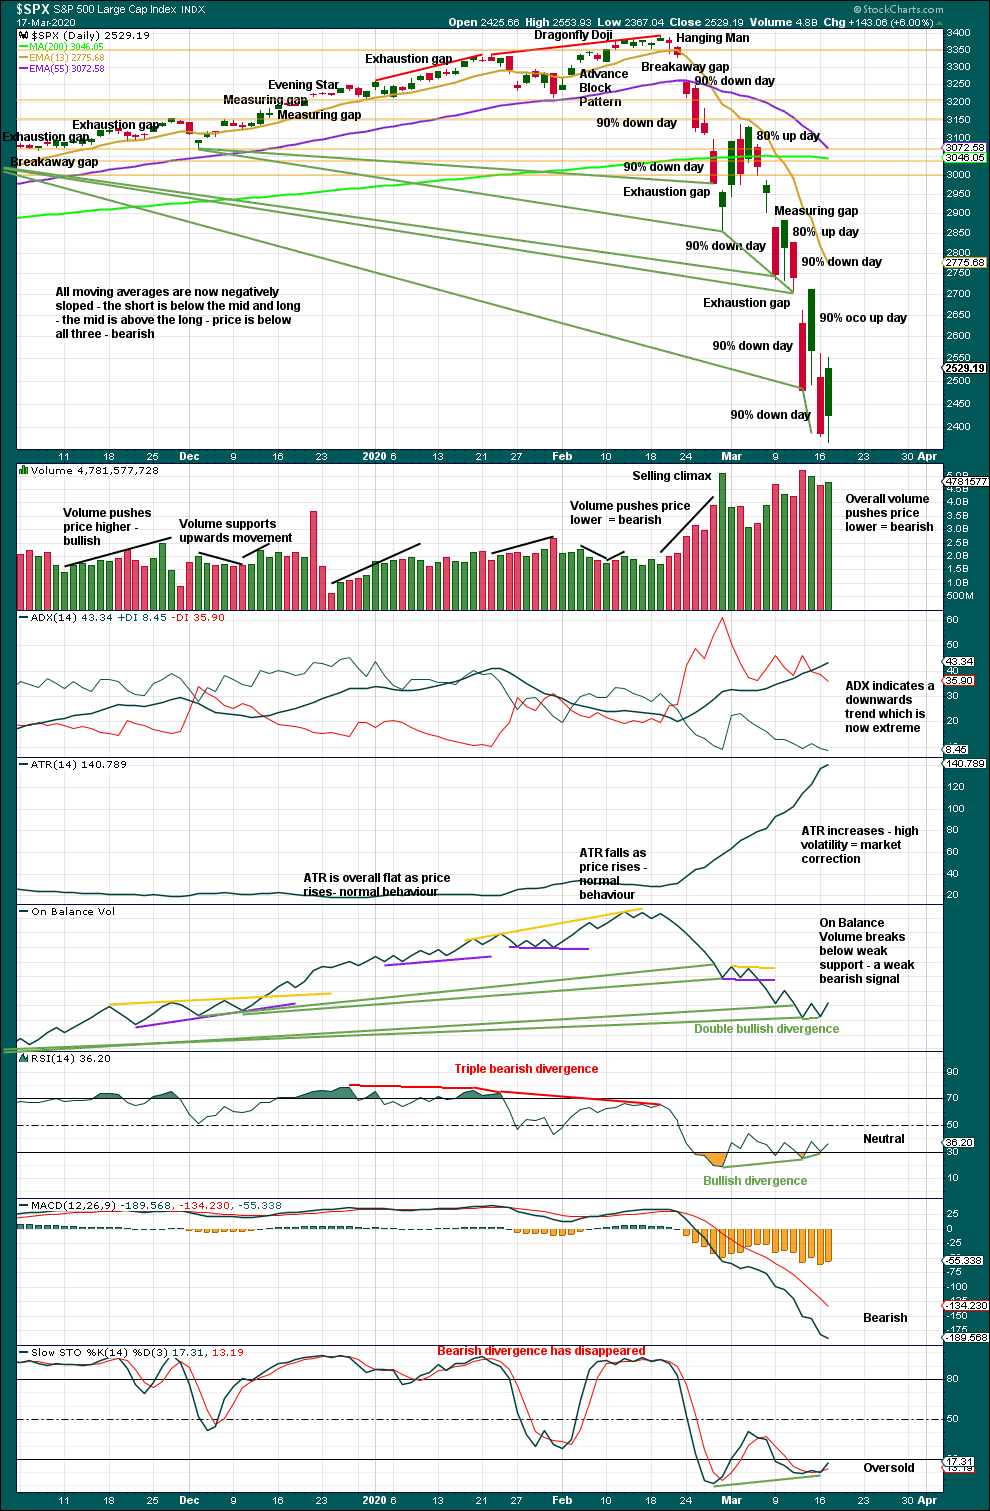
Click chart to enlarge. Chart courtesy of StockCharts.com.
There are now seven 90% downwards days in this strong downwards movement.
The following indicators still suggest a low may be in place soon:
– RSI reached deeply oversold and now exhibits short-term double bullish divergence with price.
– Stochastics reached oversold and now exhibits short-term bullish divergence with price.
– On Balance Volume continues to exhibit double bullish divergence with price.
If price bounces here, then it would most likely be a correction within an ongoing bear market and not necessarily the end of the bear market.
Despite a 90% OCO (operating companies only) up day on Friday, price continues to fall. There is precedent for this during the bear market of 2007 to 2009. This market is currently vulnerable to whipsaws of large magnitudes.
To identify an eventual sustainable low a 90% down day followed within three sessions by a 90% up day or two back to back 80% up days, with a complete Elliott wave structure and then a breach of a trend channel, would be looked for. Waiting for a breach of a trend channel would be the most conservative option.
BREADTH – AD LINE
WEEKLY CHART
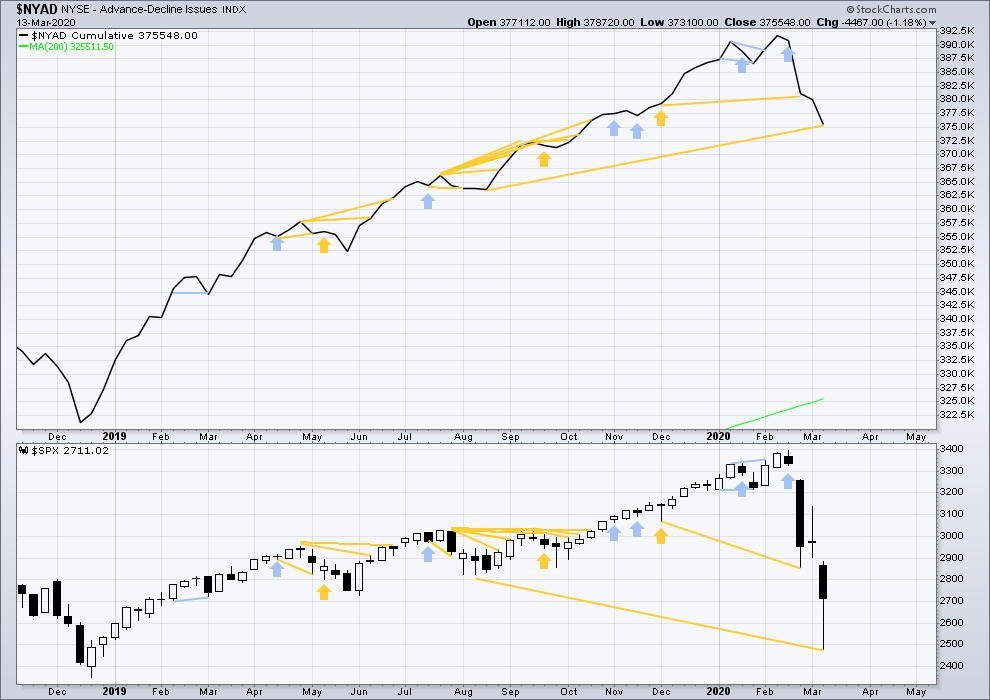
Click chart to enlarge. Chart courtesy of StockCharts.com. So that colour blind members are included, bearish signals
will be noted with blue and bullish signals with yellow.
Bear markets from the Great Depression and onwards have been preceded by an average minimum of 4 months divergence between price and the AD line with only two exceptions in 1946 and 1976. With no divergence between the AD line and price at the last all time high, this current bear market now makes a third exception.
In all bear markets in the last 90 years there is some positive correlation (0.6022) between the length of bearish divergence and the depth of the following bear market. No to little divergence is correlated with more shallow bear markets. Longer divergence is correlated with deeper bear markets.
This bear market comes after no bearish divergence. It would more likely be shallow, but this is a statement of probability and not certainty. So far it is less than the 0.382 Fibonacci ratio of the bull market it is correcting (beginning March 2009).
Last week price made new lows below prior lows of August 2019, but the AD line has not. This fall in price does not have support from a corresponding decline in market breadth. This divergence is bullish and supports the view that this bear market may more likely be shallow.
Large caps all time high: 3,393.52 on 19th February 2020.
Mid caps all time high: 2,109.43 on 20th February 2020.
Small caps all time high: 1,100.58 on 27th August 2018.
DAILY CHART
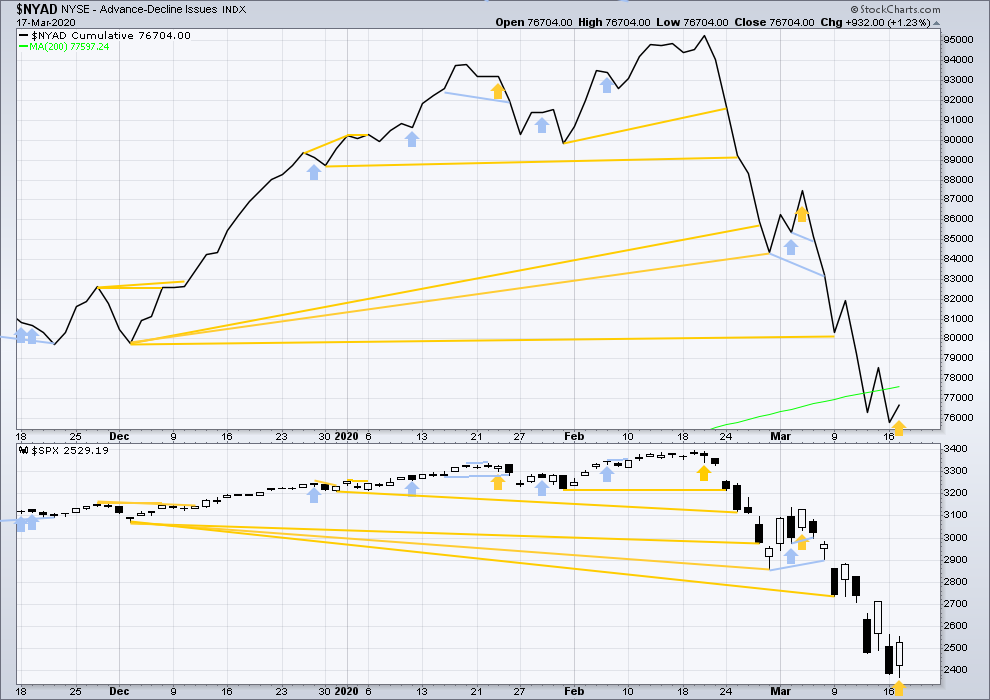
Click chart to enlarge. Chart courtesy of StockCharts.com. So that colour blind members are included, bearish signals
will be noted with blue and bullish signals with yellow.
Breadth should be read as a leading indicator.
Today price has moved lower with a lower low and a lower high, although the session saw mostly upwards movement. The AD line has increased. This divergence is bullish, but it is weak.
VOLATILITY – INVERTED VIX CHART
WEEKLY CHART
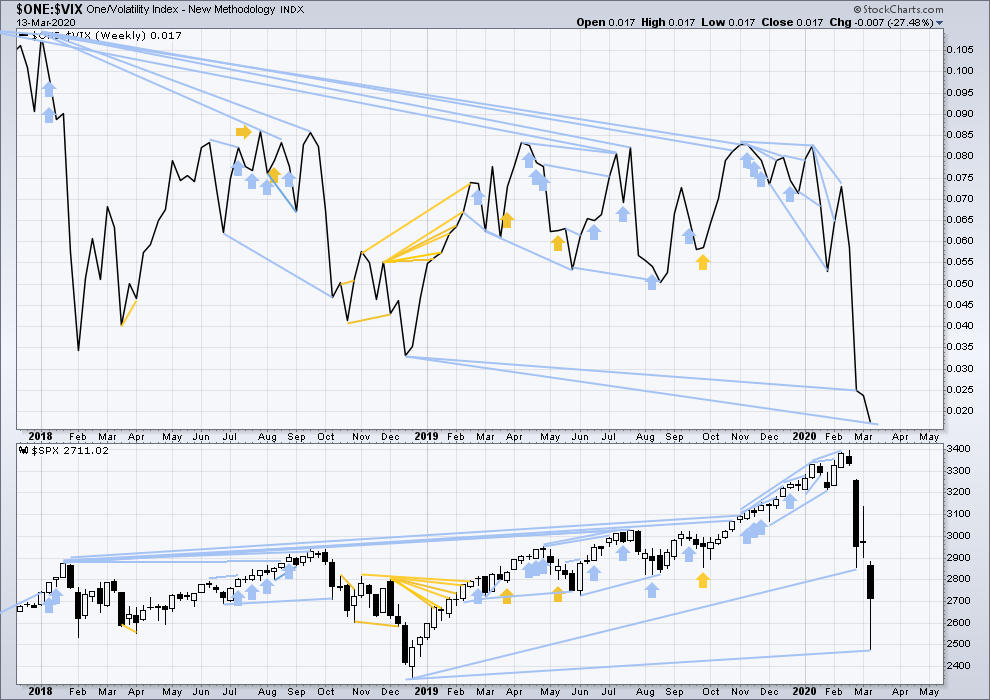
Click chart to enlarge. Chart courtesy of StockCharts.com. So that colour blind members are included, bearish signals
will be noted with blue and bullish signals with yellow.
The all time high for inverted VIX was on 30th October 2017. There is now over two years of bearish divergence between price and inverted VIX.
The rise in price is not coming with a normal corresponding decline in VIX; VIX remains elevated. This long-term divergence is bearish. It may now be resolved by this last fall in price, which meets the technical definition of a bear market.
Last week inverted VIX has made new lows below the prior major swing low of December 2018, but price has not. This divergence is bearish and suggests this bear market may not be complete.
DAILY CHART

Click chart to enlarge. Chart courtesy of StockCharts.com. So that colour blind members are included, bearish signals
will be noted with blue and bullish signals with yellow.
Today price has moved lower with a lower low and a lower high, although much of the session saw upwards movement. Inverted VIX has increased. This divergence is bullish, but it is weak.
DOW THEORY
Dow Theory would confirm a bull market if the following highs are made:
DJIA: 26,951.81 – a close above this point has been made on the 3rd of July 2019.
DJT: 11,623.58 – to date DJT has failed to confirm an ongoing bull market.
S&P500: 2,940.91 – a close above this point was made on the 29th of April 2019.
Nasdaq: 8,133.30 – a close above this point was made on the 26th of April 2019.
Dow Theory would confirm a bear market if the following lows are made on a closing basis:
DJIA: 21,712.53
DJT: 8,636.79 – a close below this point has been made on March 9, 2020.
S&P500: 2,346.58
Nasdaq: 7,292.22
Published @ 06:56 p.m. EST.
—
Careful risk management protects your trading account(s).
Follow my two Golden Rules:
1. Always trade with stops.
2. Risk only 1-5% of equity on any one trade.
—
New updates to this analysis are in bold.
US wartime Act invoked today. About the same time when markets were at lows to sort bring above 2,348 level. Hmmm… tomorrow will tell the tale.
Correction Defense Production Act.
Hi Lara,
there’s no end-of-day update chart in the Gold forum?
I know. I tried to upload the chart but an update to EWG broke the function.
Cesar’s working on it right now, but I know it’s too late. Looks like we may change to Disqus today.
Lara,
I assume your earlier post meant to say 2299 instead of 2209? Was the move up to 2254 area wave 4? and we are now moving down in wave 5?
I meant 2,209 for 3 to = 1.
3 has not yet moved far enough below the end of 1 to allow room for 4 to unfold, so I don’t think minor 3 down is over yet.
Anyone have guidance of the S&P open in the AM?
Thanks
flip a coin? watch for the news headlines to come out right around 745 pm wcoast time?
the opposite of the main count? opposite of the alternate count? opposite of the alternate alternate count? if your dog barks three times at the mailman… tomorrow will be a down day.
ROFLMAO. I like relying upon my dog’s barks!
Hyuk! 🙂
My dog can sniff out the virus, but she’s too scared to go out doors. In any event with all the news today I decided to pull out before close and see how the morning sets up. A trader once told me not to leave money on the table overnight. I took my profits and will live to fight another day.
There’s been a ROUGH pattern of down day (sometimes 2) then up day.
I would lean slightly toward upwards movement tomorrow Allan.
For these reasons:
– triple bullish divergence between price and RSI
– a Hammer pattern today
– On Balance Volume has failed to confirm the last two daily lows – bullish divergence
– today inverted VIX failed to confirm this new low
residual fears complete A wave
calm in chinese new cases of covid = B wave
as chinese -rush out side…
resurgence of new chinese cases initiates C wave
great synopsis from infectious disease experts, that seems to fit the expected shapes and time frames
It is hard to believe that I exited my longs some few weeks ago when the SPX was 1000 points higher! I have many friends who have been devastated. In just a few weeks, years and years of saving and piling it into equities all blew up in their face. I hurt for and am concerned for such people. It runs into the millions of people in just the US alone.
I strongly promoted exit during that initial B wave to family and friends. Most heeded my advice, fortunately. My sister “only” exited on 1/3…but THEN she was told to access that cash she needed to cash it ALL out and transfer from a 401k to an IRA. So all to cash it went. That’s when it really started tanking. LUCKY!!!!! I do believe she’s still in cash…I told her sternly a few days ago DO NOT PUSH THAT MONEY BACK IN YET.
But yes, it’s very sad what’s happening to the vast bulk of American’s with retirement accounts.
Billions…!!!
Another ramp into close the last hour?
Will it be another shorting opportunity?
Nearly at the target…
Minor 3 needs to end first, then minor 4 needs to unfold, if I’ve counted the waves from the high right that is.
At 2,209 minor 3 would = minor 1 in length. This may be about where minor 4 may begin for a shallow consolidation.
The invalidation point may be moved down to the start of minor 3 now.
Lara, can you count an ending diagonal for this (5) ?
it doesn’t work.
all subdivisions within an ending diagonal must be zigzags, it’s hard to see minor 1 as a zigzag
your count is:
i-ii-iii-iv-v (making 1 blue), 2 blue, 3 blue.
you can totally make it:
a-b-c instead of i-ii-iii
a-b-c instead of iv-v-2
now in 3 blue
And the count works well on the future as well.
That makes 2 an expanded flat.
It may only be a zigzag for an ending diagonal.
A chart of what you’re outlining would be helpful.
This:
Thanks so much for that chart. Yes, that looks okay…. I’d be checking the subdivisions of C within 1 on a five minute chart though…
Actually, I’ve just noticed that your 2 ends with a small truncation. Given current downwards pressure that may be possible, but I’d prefer a count without trunctions.
And ALL of this is JUST a primary A!!!
Oh my….
So your target for mother of all trades might work very very well if executed to perfection.
You mean a butterfly centered at 666???
Yea, but it would be un-holy…and the lowest SPY options I can see are at 130, I’d need some around 66!!
But unbalanced flys between here and there, oh yea…I plant those around the top of the primary B rally to come I think.
….Or wave 1…!
Why is 2300 strong Fibo structural support? This chart shows why: at this level, the entire bear market run has excellent pivot structure at Fibonacci levels defined by the complete swing. Doesn’t mean it’s going to stop here. Indicates it’s very likely to CONSOLIDATE here, and maybe stop/pivot up here. But fundamental-wise, I think this is just a way station myself. There are deeper levels with good fit too!!!
Thankyou kevin
I could have marked several pivots at that 50% too…
I forgot to add…this low is ALSO sitting on the 2019 low, and there’s a 127% extension of the prior smaller downswing. Loads of reasons for it to consolidate on top.
Kevin. Question. When you say If 2300 holds what’s the exact time frame your using. Could you write a brief explanation please
Explanation just above my friend. Any questions if it’s not clear, ask away! Not so much a question of time frame, you just need enough “granularity” to see the pivots clearly. I’ve used hourly above.
I’ve got a paper on this coming out on this technique (“Fibonacci Fitting”) in the May Technical Analysis of Stocks and Commodities magazine by the way.
BA should go bankrupt. These vagrants spent 45 billion buying back their own stock. The board should be sacked, and if the government considers them essential, simply take it over. No more. #%&*€£#**#:!! bailouts for reckless conduct. NO MORE!!!!
I heard that this morning. What a joke. BA is getting something like 60 billion dollars of which roughly half will be a grant. So the average person on the street will get $2000 or so. But the stockholders of BA get $30 BILLION free and clear. I thought we lived in a free market capitalism system. I thought that means we let the market take its course to get rid of corporations who cannot weather the storm. It used to be the banks that were too big to fail. Now its the airlines and airplane manufacturers, hotels, and on and on. I recognize stimulus and assistance is needed. But do we really think we can ‘buy’ our way out of this mess? Like 9-11, the actions of the past few weeks has changed the world and all its economies and the impact may last for years to come.
I whole heartedly agree.
Sadly, corporate America owns and operates the US gov’t. “Of/by/for” the corporations. And they will receive all the $’s they ask for. As we know. Socialism is HUGE in America. It’s nonsensical doublethink that we are not a vast socialist state. It’s just not for the common citizens benefit. Oil/gas, “defense”, corporate farms, finance, large private universities (by being tax exempt they effectively get massive subsidies), the list is very long. Additionally, massive monopolies are enforced. It’s the furthest thing possible from “unfettered capitalism”. But they have most of American citizens believing that.
Verne – VIX is being held back in light of the selling or is it that volume selling has not yet started to spike VIX?
Not sure. Strange things going on…
Someone Holding AMZN and AAPL back as well
Second Circuit Breaker…
European car manufacturers SHUTTING DOWN. US manufacturers may/likely to follow.
This is an economic death spiral…
Circuit Breakers triggered…
Verne.
How long is the wait. I’m still thinking it’s down again. Maybe test 2300 tonight
I am expecting to see 2,200 before close today..expecting second breaker hit as well. Let’s see Mr. Market has in mind. Battle around 2,348 level
2200. Really
only 40 more points down on S&P
You mean 2300
below 2,300 will be 2,200s
And I wonder what the banksters are going to do in the last 30 minutes of the day
For some reason I seem to remember it is 15 minutes for a circuit breaker shut down.
I have strong Fibonacci structural support at 2300…let’s see if it holds.
I guess Cooper’s call that today would be an epic down day (55 days after the mid Jan high) is spot on. Of course…MOST days are epic down days now! But today isn’t close to over yet….
Epic to me will be 13% to 20% down.
THAT would be EPICALLY Epic!!! And float my boat big time…
It’s coming soon enough though. Little worry here about that.
Apparently there are quite a few traders who do ot realise the nature of this market has fundamentally changed. They are starting to figure this out.
Look at that Pavlovian response to the extended levels of VIX. That sad crowd has been spoiled rotten by the banksters. Well, they all piled in on the short side of VIX, confident that it could not possible extend higher from these levels…wanna bet? Oh…you already did and had your gluteus max handed to you…lol! 🙂
Battle for DJIA 20K intensifying.
Not sure what’s going on there.
An intra-day VIX gap higher on impulsive decline below would be uber bearish…
DJIA 20,000 penetrated to the downside relatively strongly. SPX to follow?
We are seeing oversold indicators and oscillators continue to get more oversold. Normal indicators etc are just not reliable in this blood bath.
Rodney – Thoughts on the volume as expectation were to have significant numbers but some stocks are being held back to support the index levels IMHO.
Spy low at 6:30. Spx low at 8:30. Don’t know what that means ….
RUT view. A and B of a corrective flat up in place? Maybe. Note the double bottom look on top of the Fibo fitted target. A definite level for consolidation above.
Double bottom in place in SPX too on the hourly…we could get some bullish action here.
Wrongo!!!! And very happy about it too…
Next stops for RUT: 942, then 884.
Holy cow batman. Might we see RUT < 500 in the months ahead? Oh yea we might. -9.3% at the moment on the day and falling hard…
And now…POP goes the circuit breaker!!! Time to secure some breakfast…
Lay of the SPX land below. Price has strongly busted the mid-channel line. The lower channel line beckons.
Kevin your painting 2200 as well or close too. I don’t think I have ever in my life seen a blood bath so quickly.
If DJIA breaks 20K. An awful lot of traders glee-fully shorting VIX are gonna get TORCHED…!!
I wonder if we see a 20% down day today to flush and/or shred the remaining bulls in this market.
Still looking for that C wave up?
Broken markets can sometimes issue broken signals.
Ordinarily VIX divergence a pretty good signal of an interim bottom, and a fifth wave down. We have that this morning. HOWEVER, it looks to me like short vol is a crowded trade…
I’ll say!! Had a big SPX sold call spread. It opened showing a BIG LOSS, even though I sold it around the highs yesterday. WTF??????? After 15 minutes…BOOM, sudden the sign bit changes, and big loss becomes (proper) big gain. Very weird.
I have noticed REALLY FUNKY bids at the open. I think they do it to ambush open market orders when the cash session begins. They ARE that devious… 🙂
How come I don’t see VIX quote?
Whew!! Took all my shorts pretty close to the lows here today once I saw the turn and am I glad I did that!
Will reload whenever we get a clear pivot high up above.
This is the most awesome trading environment of my life. Incredible.
Are you keeping your positions overnight?
I’m flat as a pancake at 4:15
Oh yes, I’m putting on “positional trades”, willing to take some heat, selling spreads well in the money, sometimes using put back ratio spreads. But then when I get to maybe 1/2 of max profit on the sold spreads (often the next day!) or just fat profits on the back ratios, I cash on the start of a pivot low. Then wait for the push up and pivot high to reload. It just keeps working…
Also in RUT I’ve put on a out of the money sold call spread for mid April. I intend to just build that over time on the corrections up.
I keep think about butterflies but I’m going to wait for a BIG correction up to put on some of those, at cheapest possible prices.
I don’t really believe in this scenario, but it hits the chats regularly.
In case of a market shutdown over expiration: futures and options on futures expire on the next SQ opening (you cannot trade out of the position though), not for options on stocks. They use the last quoted price for the automatic exercise calculation, you can always exercise or instruct not to exercise, but you have no idea where the spot is, and if you are assigned on your short.
So for options, a spread on futures is more or less ok, but a spread on stocks is a total gamble in case of a shutdown lasting over expiration. (It’s actually the same risk that you have if there is news after hours the Friday before expiration, and you have no idea where the spot will be on Monday)
IF I were to start collecting oil calls, what instrument would be the most resistant to collapse ? …..
You mean the oil that might be headed to $9 a barrel?
Careful.
FWIW Gerald Celente latest publication Trends Journal is calling this a start of great depression.
Wow! Since I subscribed a few weeks ago I don’t think a single analysis has been accurate or even delivered on time for neither this nor the gold analysis. Sometime as much as days late!
Is this just bad timing on my part? Can you other subscribers advise?
Alternatively perhaps suggest other sites I could subscribe to that are a little more reliable?
Re: timeliness, I have zero idea what you are talking about. Every evening like clockwork, never hours late, never days late. Weekend editions come out Saturday evening usually.
Re: accuracy, maybe you don’t understand what Elliott wave models are all about. I’ve been using Lara’s service daily for years and I absolutely have zero interest in not having it available as a guide. EW models are not “predictions”. They are roadmaps, with some probability of being accurate. Of course, the most likely couple can’t cover EVERY POSSIBILITY, and this market has delivered BIG TIME on “unlikely paths”. Boy has it ever. But Lara always adjusts if and when necessary, and her forward going guidance is always valuable to me. But I have no illusions it will always “be right”. I let it inform me, and then I let actual market action fill in the specifics. Sometimes there are surprises. Most often, the most likely wave model allows me to anticipate and watch for critical pivots that I can trade off of.
I hope this helps. More than willing to try to answer specifics questions if it’s not clear.
I was under the impression that the analysis was supposed to be released prior to market close every day and it hasn’t once. Perhaps I read it wrong when I signed up.
I don’t have much experience so after receiving her YouTube videos I thought I would try her analysis for some swing trades and the ones I picked fell right through the bottom of her floors. Perhaps this is aimed for experienced people and not inexperienced traders. Again, something I might have misunderstood. I thought I was subscribing to expertise as opposed to an opinion.
In terms of always being right; within the short timeframe that I’ve subscribed it seems to have been quite the opposite but maybe I didn’t allow for timeframes or errors.
Clearly this is not for me and I should have read the description correctly prior to subscribing.
Make no mistake about it; I take full responsibility for pulling the trigger on every one of my trades. I am asking the community if this is what one can typically expect and/ or if there are other sites you would recommend so I can determine if this is a subscription suitable to me, if there is a better one out there better I’m better suited to with my lack of experience or if I should just throw in the towel with any dreams of swing trades within my portfolio and just cut my (recently sizable) losses.
Might I suggest you send me an email to zinc1024 at the gmail place and I’ll send you a copy of my book “Pragmatic Trading”, which perhaps will help you use Elliott wave (and many other structural modeling tools) to find high EV set up and trade them.
Kevin your aleays out to help buddy. Champion
Thanks NB. Hate to see people here not do well. It’s hard…but not that hard.
you can’t “just” trade EW models! You MUST trade the PRICE ACTION. The models are GUIDES only. Like a map. When you drive a car, do you look at the map and turn the wheel? No!! You look at the map when you are stopped, then you use that info as you drive head up watching the actual road.
And I’ll say again, in this a MANIC market, NO ONE can precisely call the daily action. It’s “storm time”. When the sea is up and all is on the hazard, predicting when the next wave is gonna hit is very, very difficult. So your eyes have to be up and focused on the ACTION.
Also, if you are taking longs, you are doing yourself a HUGE disservice. The trend is DOWN at the strongest level in stock market history. Any and every long trade, no matter how precisely entered, suffers from instant negative EV due to that. And vice versa, every short has the huge benefit of fundamental +EV. THE TREND IS YOUR BEST FRIEND.
Perhaps I should mention that I subscribe to the daily for S&P and Gold and not the one due on Saturdays when I refer to delays
If you are in the US the timing is perfect. I’m in California and for years I’ve trusted Lara’s EW guide and education. It’s not a trade signal subscription but a chance to learn and better understand the markets from an EW methodology point of view. It can be difficult beginning here in the middle of a larger move. Especially this one. I’d say review the bigger picture to understand where we are in the wave counts. Maybe not trade on it yet but understand what’s being shared and how you can find value for your trade methods. Wait for the time to get in and be okay with not being in a trade while waiting for the right moment to join the trade’s direction. And lastly use safe trading lots and allow flexibility in these volatile swings. Hope to see you stay around and learn. It’s a great addition to your trading or investing tool set.
I prepare and publish the analysis after the close of the New York session. It is published in the evening EST.
As a bonus I provide an updated hourly chart here in comments prior to NY close. This is not part of the paid service, it is an extra that I do because members appreciate it.
I need to wait until NY is closed in order to have data for the session which I am analysing. It is literally impossible for me to analyse the session prior to it closing.
From the FAQ:
“Q. At what times do you publish the analysis on the site?
A. StockCharts volume data is not finalised until 6:30pm EST and so I begin the analysis then when I have all information I need. Analysis of each market takes an absolute minimum of one hour, most often quite a lot longer. I normally do the S&P500 first and Gold second. So S&P is normally published in the evening EST, about 7-9pm.
End of week analysis is done over my weekend and is published Sunday early afternoon EST at the latest.”
If you are unhappy with my analysis then please cancel. I can do this for you if you like.
I’m also dumbfounded quite frankly that you claim I’ve published analysis “day’s late”. Thats simply not true.
My analysis of Silver has been accurate.
I expected at the ATH in the S&P for a pullback, but not a bear market. As price falls I’ve quickly adjusted to the reality that a bear market is here with very little technical warning.
My analysis of Gold in expecting a sustainable high has not been most accurate, but now the high is in since 12th March that has been the main wave count as soon as price confirmed it.
Since 28th Feb I’ve expected Oil to fall and it has.
So it’s not true to say I have not produced a single accurate analysis.
I see you have cancelled. That’s good, because this is not for you.
Today’s theodark report (search for “first-march-economic-data-it-isnt-pretty” and you’ll find it, I don’t think you need to be a member to read it) is worth a gander. A few critical quotes:
“we are seeing wholesale economic shutdowns previously thought to be impossible. Just a few days ago, charts showed the GDP impact of half the economy being shuttered. People thought that was too far. Now, it looks like that was an optimistic scenario. ”
“A recession went from an uncertainty a couple weeks ago to a guarantee. If no fiscal action is taken, this could be a depression. ”
“the Empire Fed index fell from 12.9 to -21.5 which missed estimates for 4.8 and the lowest estimate which was -5. That was the lowest reading since March 2009 when it hit -33.7. Worst reading of the recession was February 2009 at -34.3. As you can see from the chart below, this report had the worst 1 month change ever. Manufacturing went from coming out of a recession, to hitting a new trough.”
“The economic situation is dire. I’m not one to be negative, but this could be a disaster for the middle class and the poor. ”
This guy was still relatively bullish just over a week ago, by the way.
Boy, am I glad I work for myself from home, and am in a position to profit from the insanity. We retail traders are awfully fortunate.
Talk about coiling over a range. This thing is going NUTS over a what, 330 point range?
Massive consolidation after “first round” of price collapse. When does the bell ring for the start of round two?
futures look like they are headed to limit down again. this is crazy,, limit down or up was rare,, now an every day occurence.
Mnuchin said that unemployment in US could go up to 20%…yikes
The website is fixed! you can click on graphs and they open / close properly now!
Thank you
Ha true but hit the pause button !
The bonus of self isolation for days – weeks… Cesar has more time to get work done!
Second again 🙁
The benefits of BST before clocks go forwards.