
No bounce has materialised. The first target now looks too low. The second Elliott wave target is now the main target.
Summary: A short-term target at 2,173 may be about where a bounce or consolidation may begin. Thereafter, the bear market may resume.
The final target is now at 1,708.
The biggest picture, Grand Super Cycle analysis, is here.
Last monthly charts are here with video here.
ELLIOTT WAVE COUNTS
MAIN WAVE COUNT
WEEKLY CHART
Click chart to enlarge.
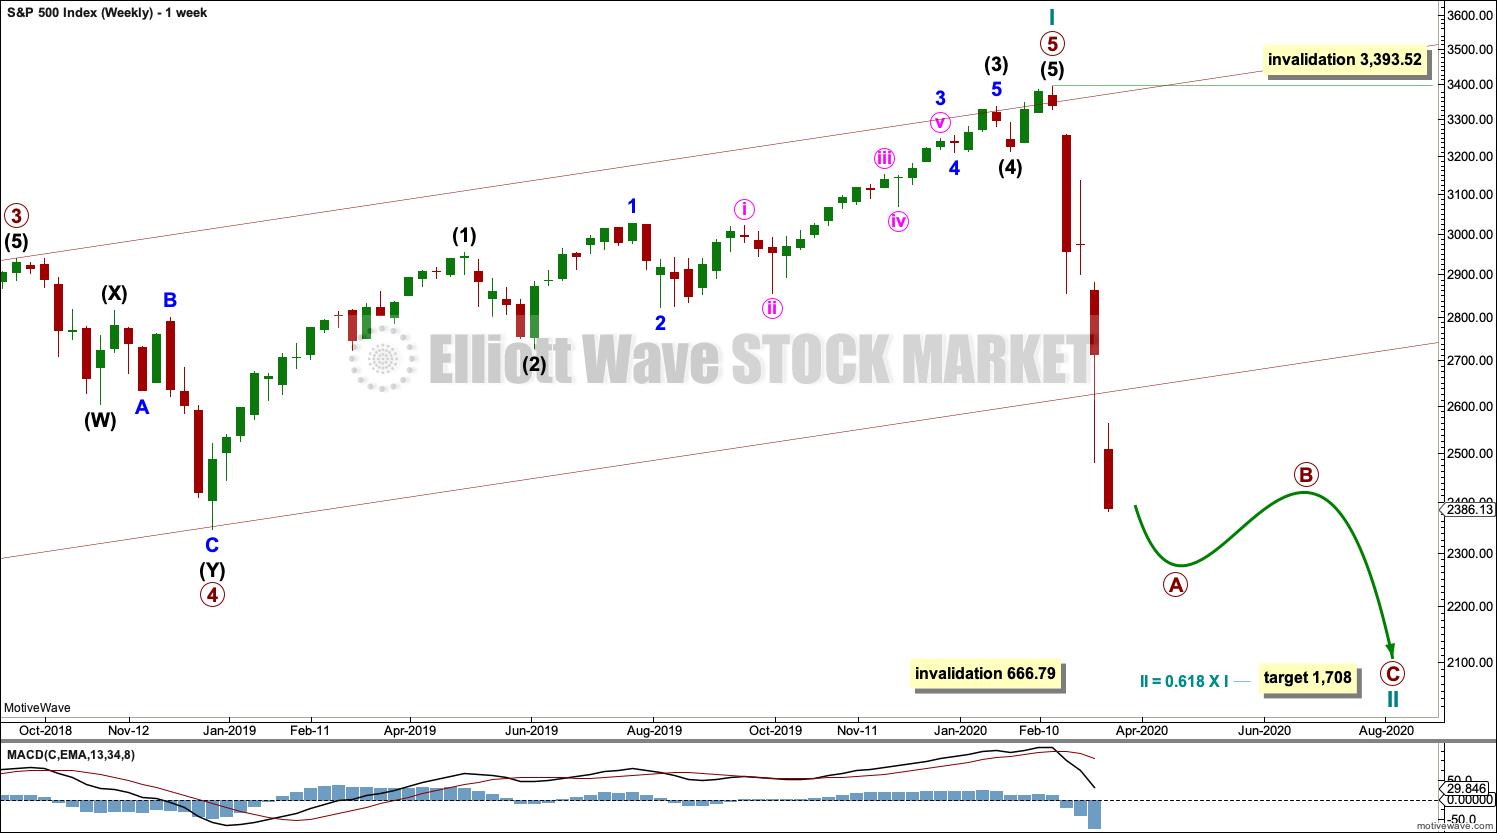
Now that the channel is breached by a full daily candlestick below and not touching the lower edge, further confidence in this wave count may be had.
Price is now very close to the 0.382 Fibonacci ratio of cycle wave I at 2,352. The structure of cycle wave II needs further to go to complete. The next Fibonacci ratio at 0.618 is now a preferred target for cycle wave II to end.
Cycle wave II may not move beyond the start of cycle wave I below 666.79.
DAILY CHART
Click chart to enlarge.
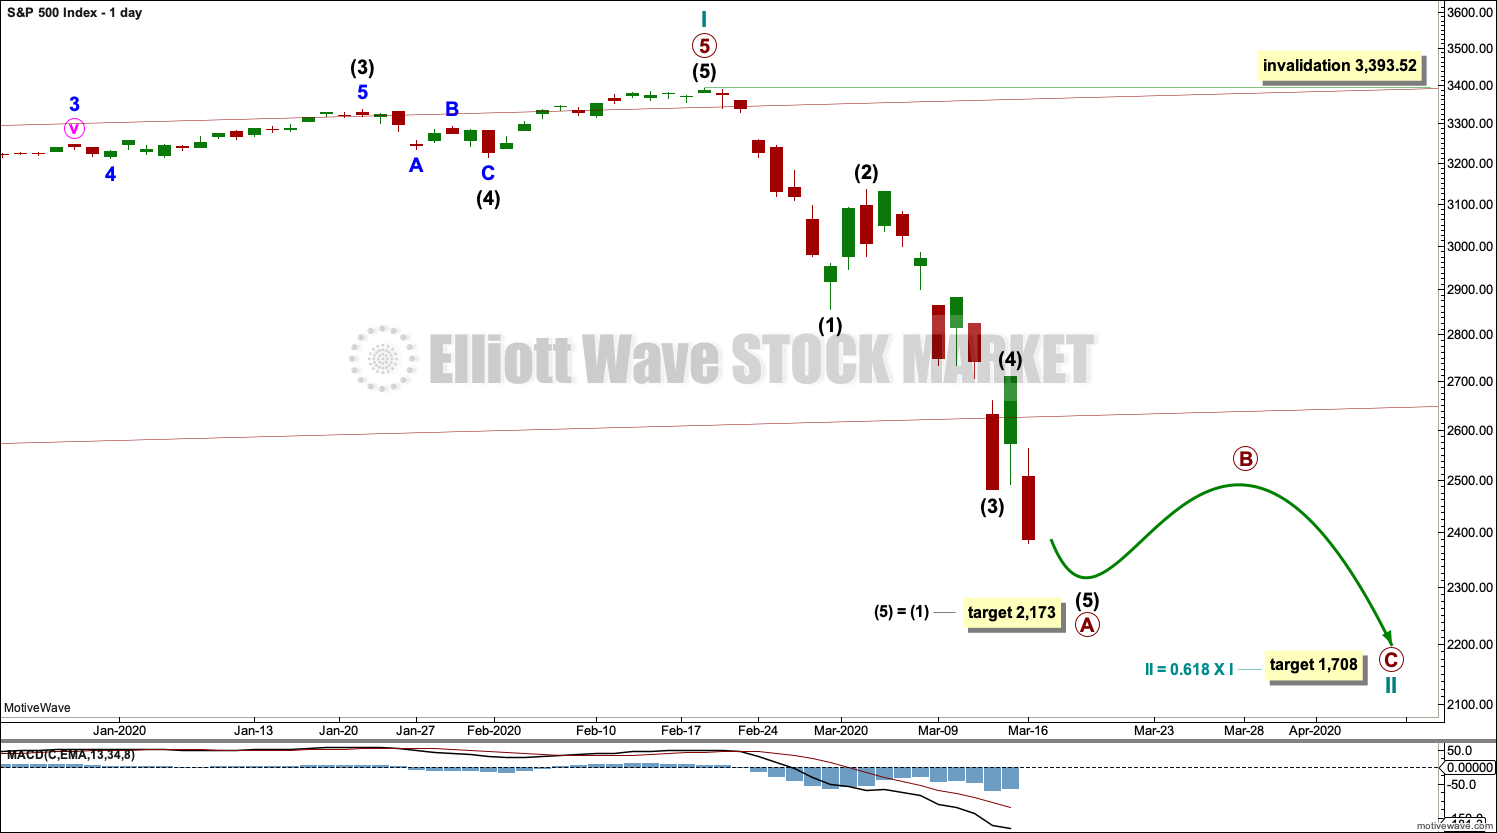
Redraw the wide maroon trend channel carefully: draw the first trend line from the end of primary wave 1 at 2,093.55 (December 26, 2014), to the end of primary wave 3 at 2,940.91 (September 21, 2018), then place a parallel copy on the end of primary wave 2 at 1,810.10 (February 11, 2016). Today’s candlestick is fully below the channel. The close below is again strong.
Cycle wave II may subdivide as any Elliott wave corrective structure except a triangle. It would most likely be a zigzag. Primary wave A may be an incomplete five wave impulse. Primary wave B may not move beyond the start of primary wave A above 3,393.52.
Within primary wave A, there is no Fibonacci ratio between intermediate waves (1) and (3). This makes it more likely that intermediate wave (5) may exhibit a Fibonacci ratio to either of intermediate waves (1) or (3). The most common Fibonacci ratio for a fifth wave is equality in length with its counterpart first wave.
HOURLY CHART
Click chart to enlarge.
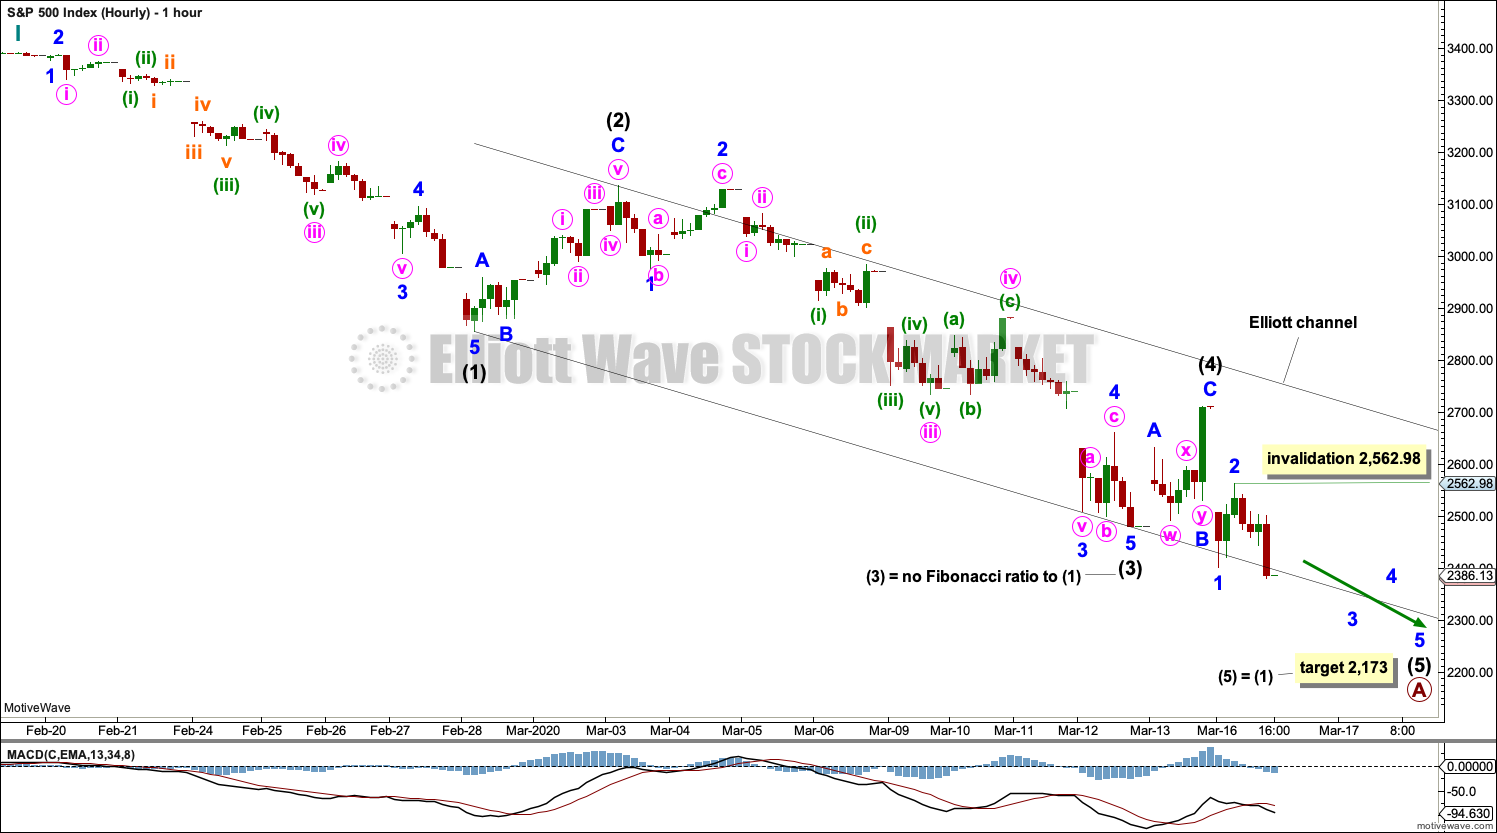
Primary wave A may be an incomplete five wave impulse.
Draw a channel about primary wave A using Elliott’s first technique: draw the first trend line from the ends of intermediate waves (1) to (3), then place a parallel copy on the end of intermediate wave (2).
During bear moves, this market sometimes behaves like commodities. It may exhibit swift strong fifth waves. Look for the possibility for intermediate wave (5) to end with further strength.
ALTERNATE HOURLY CHART
Click chart to enlarge.
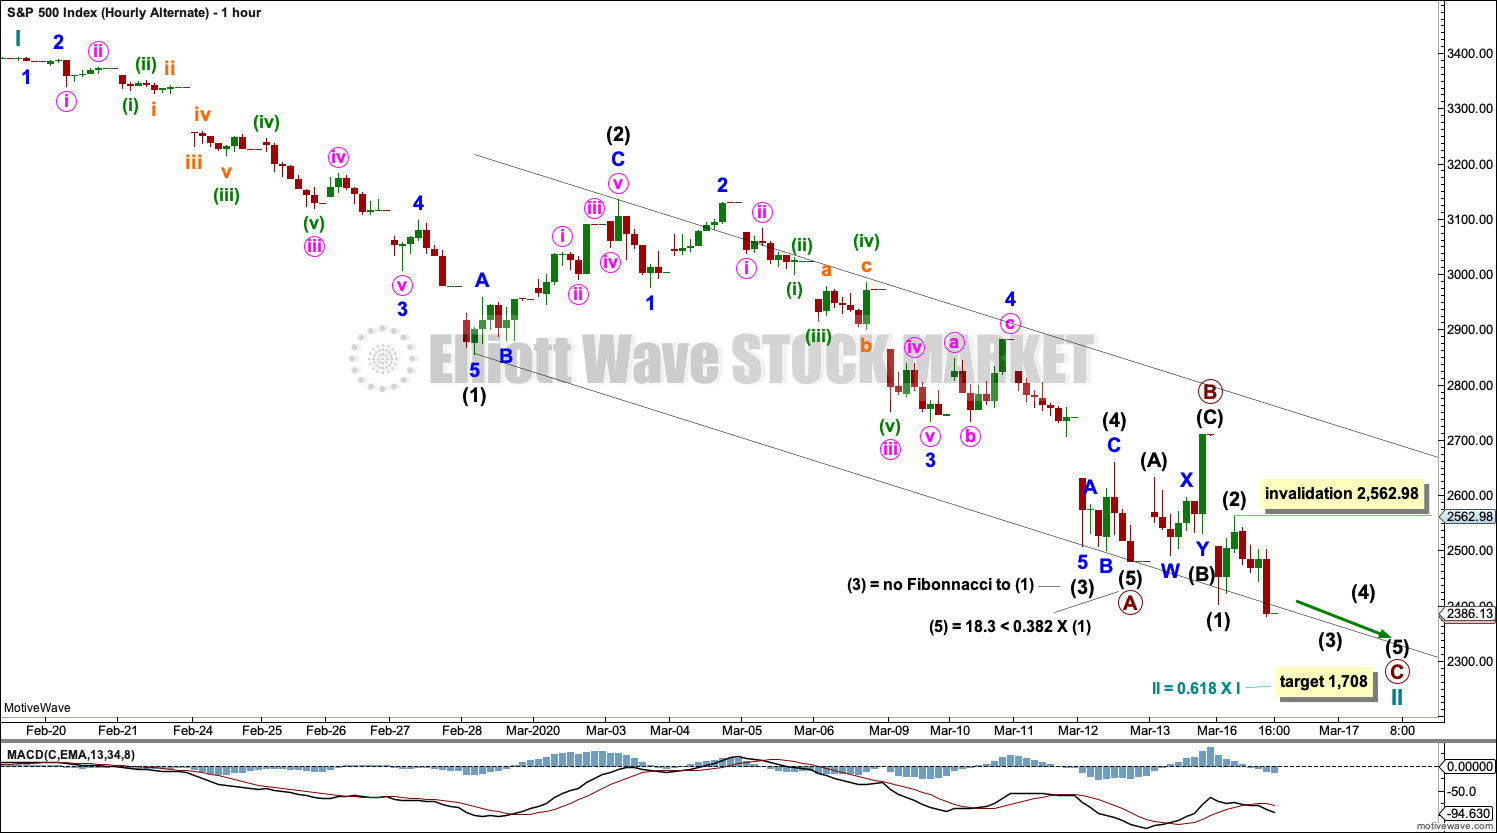
This alternate hourly chart follows on from the main hourly chart published in last analysis.
It is possible that within a quick zigzag for cycle wave II both primary waves A and B may be complete. Primary wave B may have been a very brief and shallow zigzag.
Because of the brevity of primary wave B, this wave count no longer has good proportions.
The final target is the same. This wave count expects price may fall very quickly towards the target with very little interruption.
Note: The alternate monthly wave count published in last analysis now looks very unlikely. A new more bearish alternate wave count may shortly be considered.
TECHNICAL ANALYSIS
WEEKLY CHART
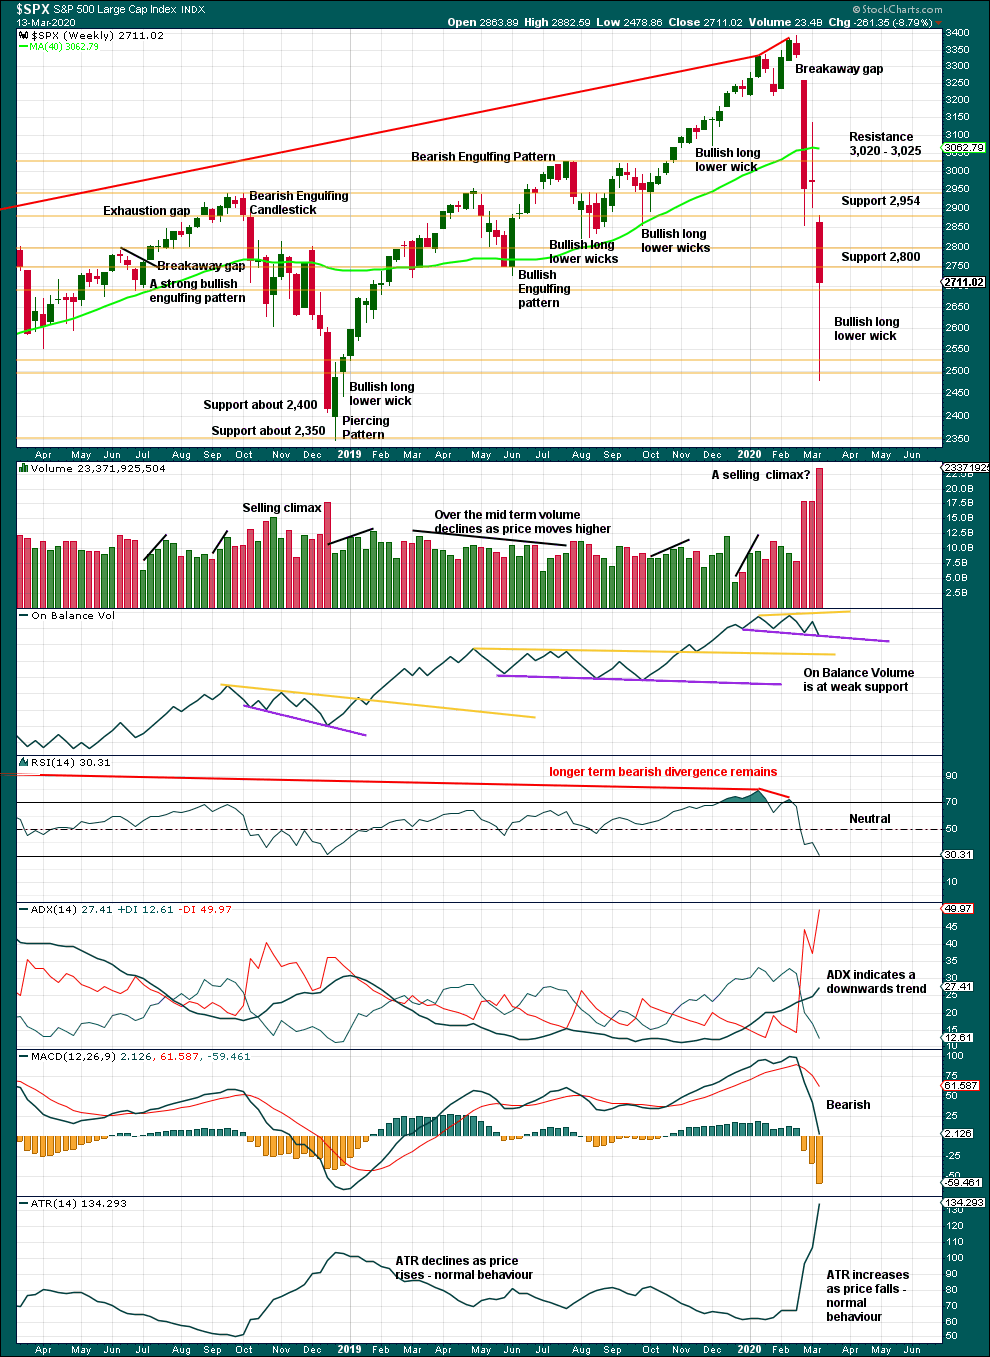
Click chart to enlarge. Chart courtesy of StockCharts.com.
A 29.7% drop in price (high to close) no longer has precedent within the larger bull market.
At the weekly chart level, conditions are not yet oversold; there is room for downwards movement to continue.
However, the long lower candlestick wick last week is very bullish. At this time, it has not been followed by any upwards movement, so the bullishness of that lower wick is now negated.
DAILY CHART
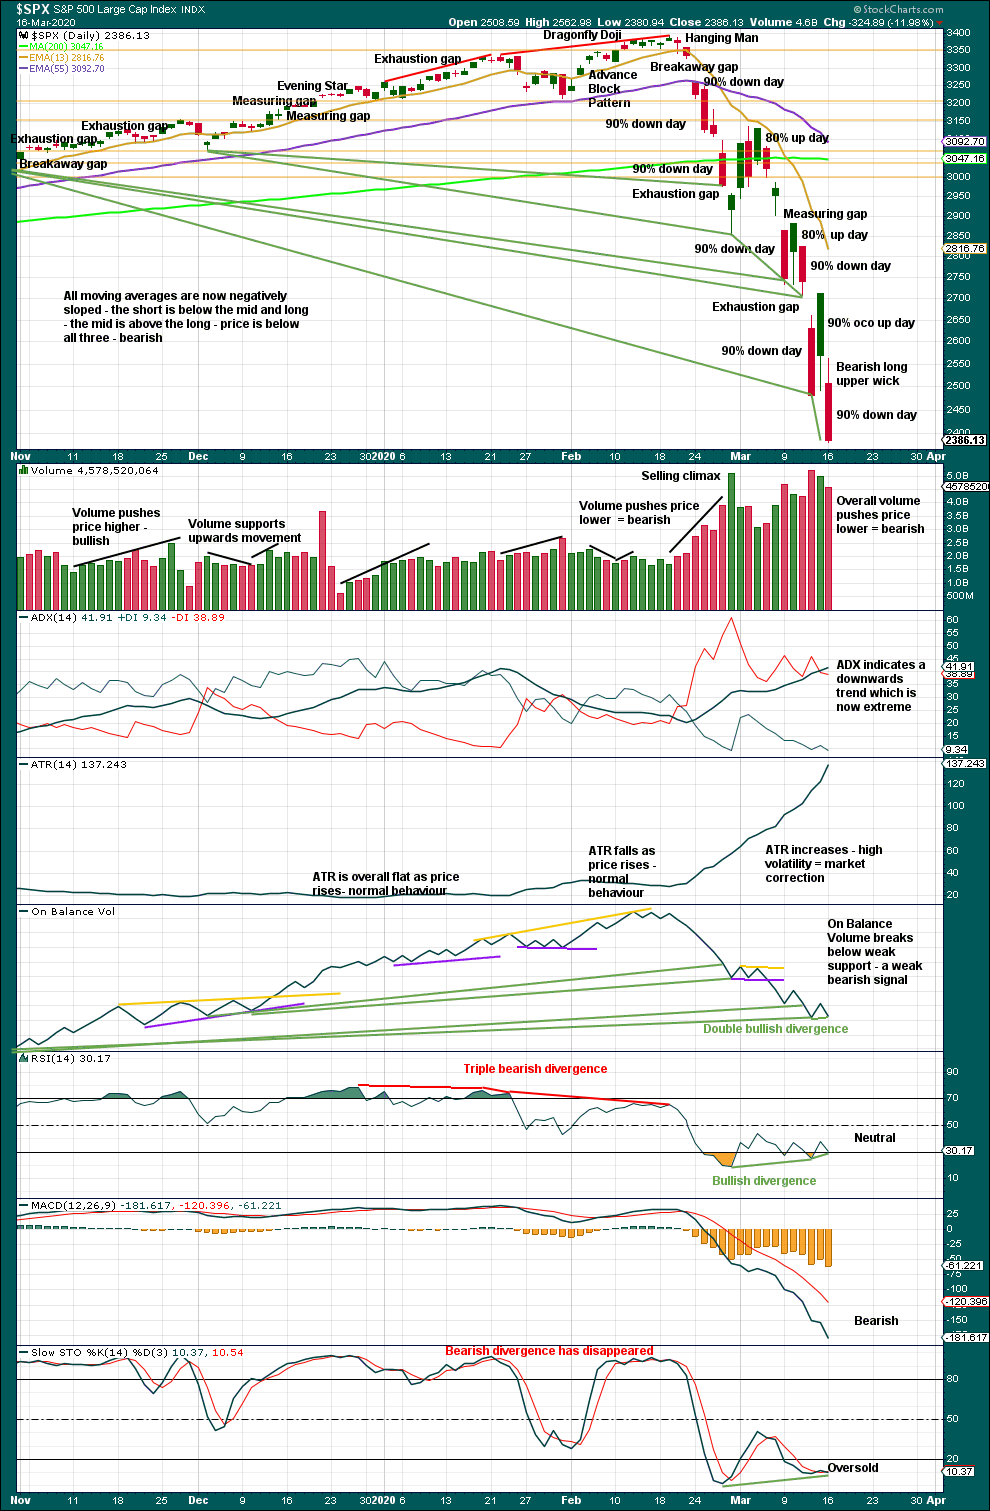
Click chart to enlarge. Chart courtesy of StockCharts.com.
There are now seven 90% downwards days in this strong downwards movement.
The following indicators still suggest a low may be in place soon:
– RSI reached deeply oversold and now exhibits short-term double bullish divergence with price.
– Stochastics reached oversold and now exhibits short-term bullish divergence with price.
– On Balance Volume continues to exhibit double bullish divergence with price.
Despite a 90% OCO (operating companies only) up day on Friday, price continues to fall. There is precedent for this during the bear market of 2007 to 2009. This market is currently vulnerable to whipsaws of large magnitudes.
To identify an eventual sustainable low a 90% down day followed within three sessions by a 90% up day or two back to back 80% up days, with a complete Elliott wave structure and then a breach of a trend channel, would be looked for. Waiting for a breach of a trend channel would be the most conservative option.
BREADTH – AD LINE
WEEKLY CHART
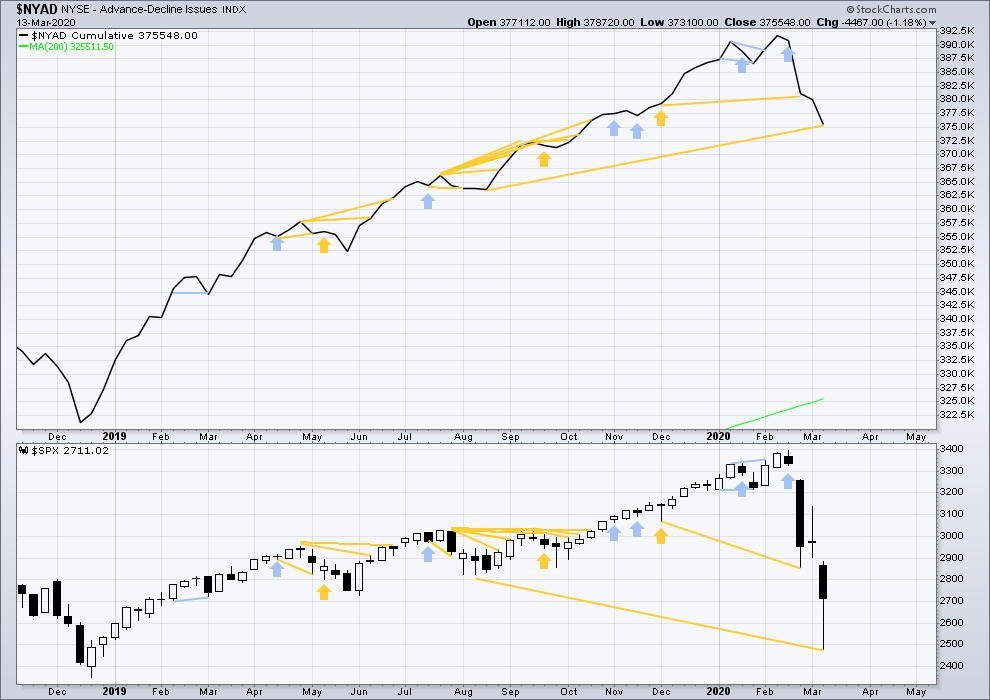
Click chart to enlarge. Chart courtesy of StockCharts.com. So that colour blind members are included, bearish signals
will be noted with blue and bullish signals with yellow.
Bear markets from the Great Depression and onwards have been preceded by an average minimum of 4 months divergence between price and the AD line with only two exceptions in 1946 and 1976. With no divergence between the AD line and price at the last all time high, this current bear market now makes a third exception.
In all bear markets in the last 90 years there is some positive correlation (0.6022) between the length of bearish divergence and the depth of the following bear market. No to little divergence is correlated with more shallow bear markets. Longer divergence is correlated with deeper bear markets.
This bear market comes after no bearish divergence. It would more likely be shallow, but this is a statement of probability and not certainty. So far it is less than the 0.382 Fibonacci ratio of the bull market it is correcting (beginning March 2009).
Last week price made new lows below prior lows of August 2019, but the AD line has not. This fall in price does not have support from a corresponding decline in market breadth. This divergence is bullish and supports the view that this bear market may more likely be shallow.
Large caps all time high: 3,393.52 on 19th February 2020.
Mid caps all time high: 2,109.43 on 20th February 2020.
Small caps all time high: 1,100.58 on 27th August 2018.
DAILY CHART
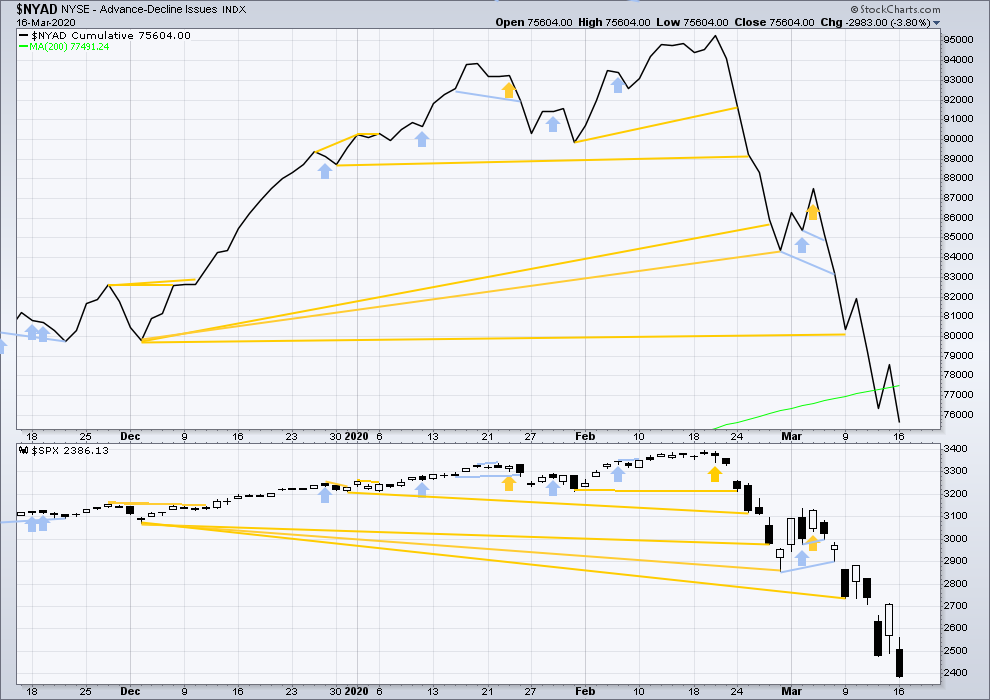
Click chart to enlarge. Chart courtesy of StockCharts.com. So that colour blind members are included, bearish signals
will be noted with blue and bullish signals with yellow.
Breadth should be read as a leading indicator.
Both price and the AD line have moved lower on Monday. There is no new short-term divergence.
VOLATILITY – INVERTED VIX CHART
WEEKLY CHART
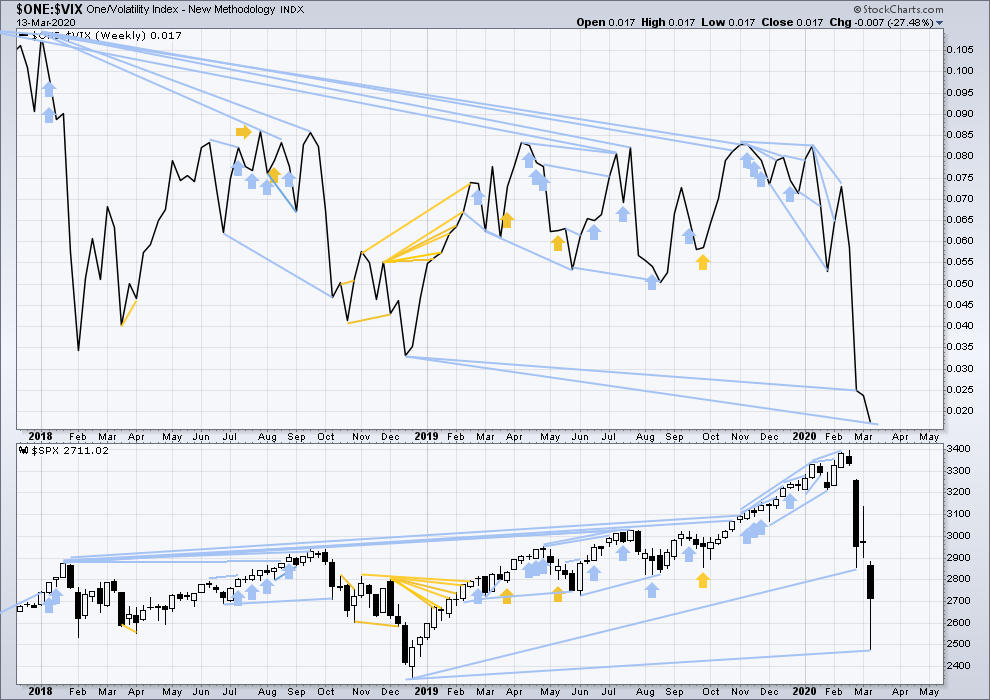
Click chart to enlarge. Chart courtesy of StockCharts.com. So that colour blind members are included, bearish signals
will be noted with blue and bullish signals with yellow.
The all time high for inverted VIX was on 30th October 2017. There is now over two years of bearish divergence between price and inverted VIX.
The rise in price is not coming with a normal corresponding decline in VIX; VIX remains elevated. This long-term divergence is bearish. It may now be resolved by this last fall in price, which meets the technical definition of a bear market.
Last week inverted VIX has made new lows below the prior major swing low of December 2018, but price has not. This divergence is bearish and suggests this bear market may not be complete.
DAILY CHART
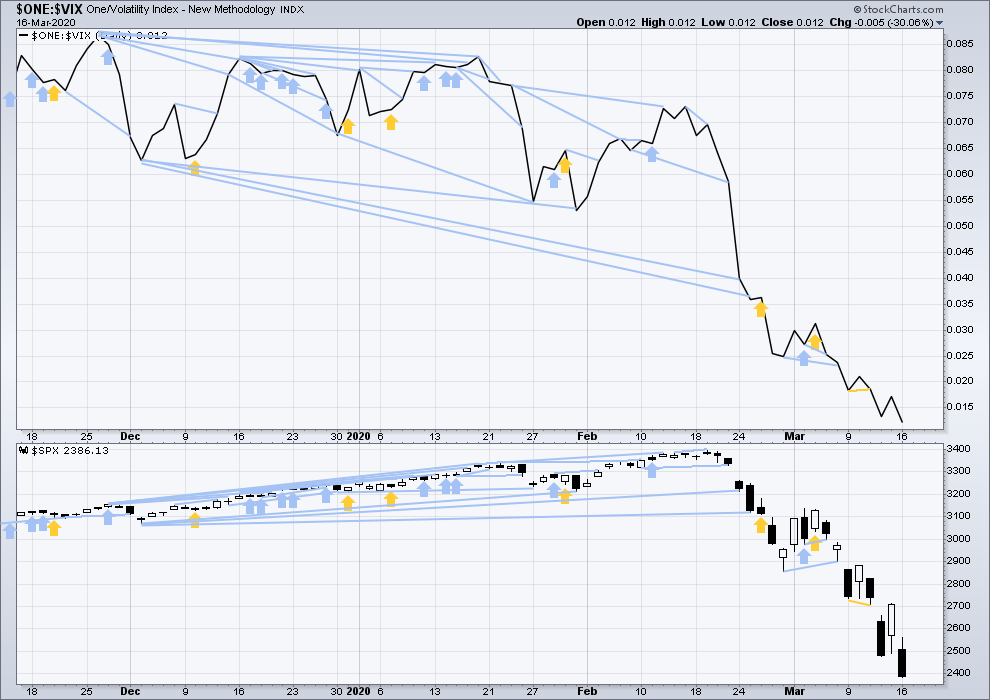
Click chart to enlarge. Chart courtesy of StockCharts.com. So that colour blind members are included, bearish signals
will be noted with blue and bullish signals with yellow.
Both price and inverted VIX have moved lower on Monday. There is no new short-term divergence.
DOW THEORY
Dow Theory would confirm a bull market if the following highs are made:
DJIA: 26,951.81 – a close above this point has been made on the 3rd of July 2019.
DJT: 11,623.58 – to date DJT has failed to confirm an ongoing bull market.
S&P500: 2,940.91 – a close above this point was made on the 29th of April 2019.
Nasdaq: 8,133.30 – a close above this point was made on the 26th of April 2019.
Dow Theory would confirm a bear market if the following lows are made on a closing basis:
DJIA: 21,712.53
DJT: 8,636.79 – a close below this point has been made on March 9, 2020.
S&P500: 2,346.58
Nasdaq: 7,292.22
Published @ 08:02 p.m. EST.
—
Careful risk management protects your trading account(s).
Follow my two Golden Rules:
1. Always trade with stops.
2. Risk only 1-5% of equity on any one trade.
—
New updates to this analysis are in bold.
VIX closes above 75, again, comments ….?
Is this what u mean Verne?
I just read a blurb that all New Zealanders traveling abroad are being told to return home. Have you heard the same Lara?
Australians have been warned by the Department of Foreign Affairs and Tourism to come home asap.
An update on above…only those who wish to come home should do so now due to countries closing their borders and lack of flights.
For example Qantas have slashed their OS flights by 90%.
That’s the first I’ve heard of it.
We’re in the process of emigrating to Panama, had no plans to return to NZ for some years.
Not planning on going back now actually. I think we’re safer staying put and travelling as little as possible.
One have of a well traversed 340 point or so range!!!! Insane.
The critical trend data…note today still partial!
Watching 2500 round number for clues…again…! 🙂
RUT coiling wide after entry from above…the weakest of the averages.
Snakey Wakey…! 🙂
Updated hourly chart:
It looks like minor 2 within intermediate (5) may not be over and may unfold as an expanded flat correction. I’ve yet to check subdivisions on the five minute chart though.
Will also look for an alternate.
Bottom line short term: a new high above 2,711.33 would be a strong indication of an interim low in place; primary A would then be likely over and primary B underway.
I’m not feeling that impulsive minute c up. Seems overly choppy for that, though it’s still technically possible. We are getting a relatively weak bounce day here today off a MASSIVE sell off yesterday (one of the larger one day moves in history). I suspect it’s setting up more sharp movement down consistent with the expected minor 3 down model generally. Could be wrong.
I think you are correct. Looking for a low tomorrow before the manic “C” up.
White House wants to send helicopter money $1K to each US citizen. Do they really think people will start spending this money on local businesses instead of hoarding it even more?
Funny how when the political rulers are threatened by events there’s suddenly lots of money to hand out…
Here in SF we aren’t even supposed to be outdoors!! Much less spending money on business (except “necessities”).
my friend (ski bum) just bought new ski’s and boots. and the checks arent even cut.
Mnuchin coming out saying they might shorten stock market hours
NOOOOOOOOOOOOOOOOOOOOOOOOOOOOO!!!!
Damn them.
That won’t change anything. Idiocy. Oh, right, Mnuchin….
Are the threats to the market going to induce more selling? I’m suspicious yes.
We are now PRIMED for minute 3 of minor 3 action down folks. I added a SPY put back ratio for mid April.
Is this an official news?
The good news is reassurances they will NOT close the markets.
Can we trust them?
A comprehensive one-pager:
https://www.onepagericu.com/
Thanks Arnaud!
Do we have a minute ii up of the minor 3 down complete here??? Double top at key fibo resistance on the 1 and 5 minute SPX chart. I’ve sold a SPY call spread for Friday right how and now, I bail if price goes above today’s high. In like Flynn or I lose my little intra-day UWM and GLD profits within minutes here…
2549 is next, 50% retrace level…much higher than that and the main is invalidated above 2562.
The main lives! For now. Put on my 3/20 call spread again…
Wave 2 of 5 in progress?
Would target ~2600, next short level
Restaurants and bars are closed, the parade is cancelled. I’m celebrating the Irish day by wearing a green T-shirt at home!
Happy Saint Patrick’s Day everyone.
SPX landscape below. 2300 a big roundie and a great place for a pivot to give everything above Fibo pivot structure. Might be a place for shorter term traders to cash and wait for a bit higher to reload. I’ve got a big sold call spread and I won’t take it; I want it all, even if it takes a month, and like it’s very low risk profile now. So adding on the pullbacks here is my game.
Some real bottom structure now in /ES with a clear double bottom in place. A larger pivot low? It could be. Note also it’s a BIG COIL now and if it pops above it a momentum/short squeeze run up like Friday is definitely possible. But I rather expect it to stay in this range (which is HUGE!) and then break down.
Kevin – What would a play in your view considering the range expected for next few weeks. I am agree that we will most likely revisit 666 on S&P given the extent of irrational exuberance. But first things first 1,710 level will shake a ton of people as there are still a lot of retail investors who are not giving up on long positions.
I like selling premium, overhead call spreads. Right around current action with very tight stops; might take a few tries to nail it. Or, “far higher” and accept heat on the confidence the market is not going to rally for long. I like ’em out in April still, but going out to May to collect up way more premium is starting to appeal to me too. This bear market is NOT going to do a 1987, no way. It’s a completely different fundamental beast (exogenous “off” of the economy!).
RUT/IWM and/or SPY/SPX. RUT is the weakest by far. Can it go much lower? Well, if companies starting going bankrupt by the score as indicated by the corporate bond market, yea, it can!
Put ratio backspreads are another play. But if they shut down the market and you have $20,000 in profit riding on long puts and they expire while the market is shut, wtf happens? I don’t want to find out. And a closing of the markets is I believe a significant possibility (greater than zero chance anyway). So I rather like selling premium; less risk of being robbed.
does a brief pause and climb coincide with your big drop Wednesday prediction from Gann?
That’s not my prediction, that’s Jeff Cooper’s. And I don’t think it’s precise for Wednesday, but “around” Wednesday. Let’s say +/- 3 days from there.
I have some serious work to do to grok the Gann time/price square thing. Cooper’s a very competent trader and if he think that stuff is real, it’s something I want to understand.
The crash of ’29 and the crash of ’87 both occurred on the 55th day after the high. Guess what tomorrow is? The 55th day from the Jan 22 high (discounting the more recent high as a “false failure high”).
Interesting times!
looks like you called it
RUT fast approaching my next Fibo fitted target at 1007. And just below that is the 100% retrace of the entire early ’16 low to mid ’18 high. I think that’s a likely area for some corrective upward consolidating action, and may complete the massive impulsive wave down as marked. My oh my RUT is weak!!!
That did not take long. Wall Street Shills are already bleating about how the Treasury needs to buy corporate bonds. Oh really now?
The fact that they all went out and gorged on credit, then used the money to buy back their own shares to FRAUDULENTLY drive P.E. multiple expansion in the face if declining top and bottom line revenue is after all, you understand, “Not their fault”.
It’s an “Exogenous Shock”
Let’s hope the government gets it right this time, and allow all the reck-less players get exactly what they deserve!
The Fed is launching a lending facility to support short-term commercial debt markets. Wait till they start buying equity besides Treasuries. They won’t stop at anything – printing money is easy. The problem long term – they are screwed as production and real economy doesnt come up because of a lot of money flying around. It would rather pop the bubble we are already in and then watch what inflation will do. Rates go up, gold will be real gold then, etc. Yo have the picture. Question is when it happens – what we see now might actually bring market back and we might at some point even be back to ATH (I;m sure not this year-;), but it would be all temporary in a grand scheme of things.
Shopping these last few days in New York City has been an education in what people do not like to eat. I go to my local Fairway, part of a supermarket chain that filed for bankruptcy in January but has been operating as usual since then.
People’s first reaction after Governor Cuomo declared a state of emergency on Saturday was to go shopping to prepare for long term isolation. On 9/11/2001, I went to the local Food Emporium, and the line of customers snaked literally through all the aisles in the entire supermarket. I discovered sections and products I didn’t know existed, and was in that store for about 1.5 hours. It was a very long experience, fortunately completely useless as there was no shortage of anything in later days, despite Manhattan being shut down.
The same occurred on Saturday as pasta, rice, and cereals were being completely sold out. As one would expect, Barilla and Del Cecco pastas disappeared rapidly, but the Thai rice noodle remained plentiful until Monday; in the cereal section, the shelves where Kellog’s Special K, Corn Flakes and Cheerios used to be became desperately empty, but the fiber cereals lasted much longer on display (and in your stomach too!).
Interestingly, throughout all this time and still now, there was absolutely no rush on the Impossible Meat. The meat section was raided of course: chicken wings disappeared (much faster than thighs) and people stocked grounded beef, as it’s probably excellent with Thai pasta, but no one ever bothered to purchase the Impossible burgers, and as of yesterday this is an item that never went out of stock.
Is it time to short BYND?
I’d rather short things revolving around large groups. some movie theaters are still open lol.
restaurant chains. but given income change over the next months anything luxury will be throwing itself out the window
Feels like a third of a third – ewi .
ES hourly, got a new sharper channel down now. But price has just double bottomed on a 61.8%. Either a B launches to fill up one or both of these channels, or it’s off the waterfall down again. A break below the two pivot lows in and it’s likely to go to 2300 immediately. Both a prior pivot there and it fits the Fibo structure of the move down too. I suspect very strong resistance there.
good morning Kevin.
I’m thinking a bounce here before the cards fall
My thoughts exactly BUT a bounce pretty much conflicts with the main WC.
We’ll see. I’m waiting for good set ups and triggers to add to shorts. I won’t touch longs except on a strictly intra-day basis if it starts of one of those “last Friday” moves, which I think is doubtful here.
One in a lifetime price action. Big time historic. Awe-some, because I am awe-struck.
It’s still in it’s early stages. The strongest multi-day/multi-week trend in stock market history. And it’s just started: price hasn’t even completed an A wave yet (or…it just did; we’ll see). I expect overall bearish action for a minimum of 6 months, but probably something more like 13 or more. Look at ’09 on the monthly: something extended like that is what I expect here after this blow off move.
This is the strongest down trend in history. And the trend is your friend. The short set ups now have tremendous positive expected value, tons of edge. It’s very unique and begs to be traded on the high side of your risk range to maximize profits. Get it while it’s easy.
One of the great short set ups in history may be immediately in front of us, on completion of the coming B wave.
The Fibo clusters below are marked as my targets. Momentum strongly indicates deeply lower prices ahead; I’m sure someone could do studies showing a correlation between extended high momentum selling and future deeper prices (someone ask Ciovacco…). I expect a big ringing down ward structure overall for the next year or more, most likely. We should be able to short the moves up for a long time here…
Targets marked. Consider butterflies. It’s time to take advantage of the advantage friends. This is a time to get bigger (within your risk tolerance).
And yes, I think even the potential GSC II defining level that’s right at 100% retrace of ’09-20 is in play here: 666. No clue how low this will go…one level at a time, and shorting on each leg is my general plan.
We can’t predict the future, but we can estimate probabilities, and when they are high (like this) and the distance to travel is far (like this), we have significant baseline edge in the short direction. Add the this the edge from excellent set up and triggers, and you’ve got an ideal trading environment for making substantially larger than normal profits.
And it should last for at least 6 months.
“I’m in heaven!!…”
wow they sure waited for the over night on this one.
Helloooooooo nurse!
Nurse?
Uh oh…you are CV guinea pig Peter?
I have already thought about volunteering in a vaccine trial. My goal would be to help others from getting sick or keep others from dying. If anyone knows of a way to volunteer for such a trial, let me know.
current human testing is out of Seattle through a kaiser facility- I think its through $MRNA Moderna
I am fortunate to have my daughter, an RN, living at home. However, my concern is for her. I hope the plea in the US for social distancing and isolating oneself will slow down the transmission curve. Be safe and stay healthy everyone.
Starting at midnight, bars and restaurants in Illinois will close until March 31….
SF has asked citizens to stay at home except for necessity travel. So we are under self-quarantine to the degree we can stay in our homes by the city’s request (command? order? I’m not sure.)
“Thing’s getting serious…”
The economic impact can’t possibly be priced in yet, if this is going to happen in every major city in the world.
many people still not taking it seriously
Take care of yourself ! very high survivability! stay positive