
A strong close today below a multi-year trend channel is very bearish and indicates an alternate wave count may be correct.
Summary: Yesterday’s alternate Elliott wave count is now the main wave count because although the trend channel was not properly breached the close below it today was very strong. Focus shifts to identifying where and when this bear market may end.
The biggest picture, Grand Super Cycle analysis, is here.
Last monthly charts are here.
ELLIOTT WAVE COUNTS
MAIN WAVE COUNT
WEEKLY CHART
Click chart to enlarge.
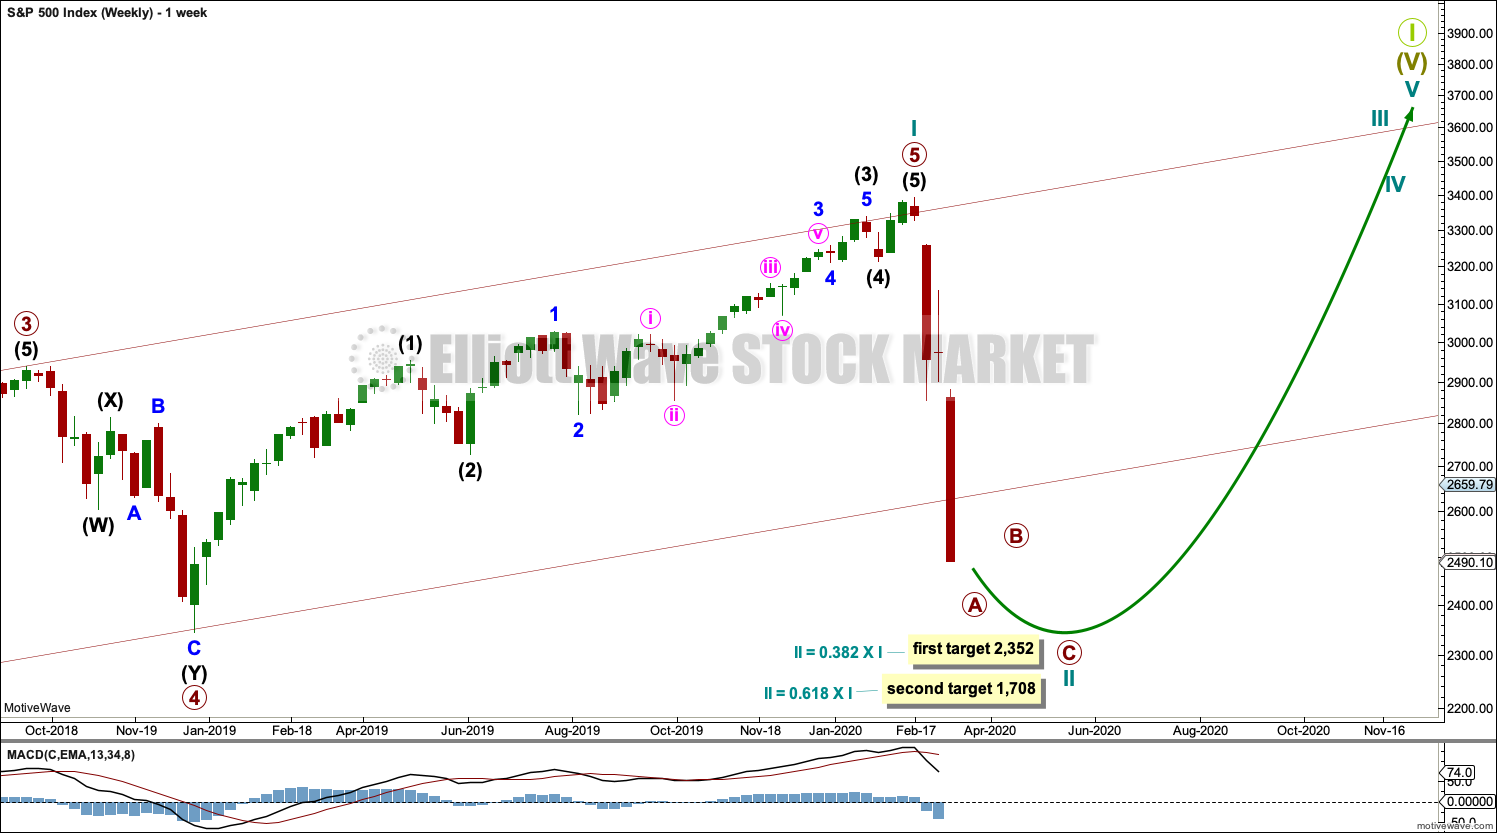
This was a second alternate wave count in the last analysis and last monthly charts. Today it is the main wave count.
If the channel is breached by a full daily candlestick below and not touching the lower edge, further confidence in this wave count may be had. Today the close below the lower trend line is very strong, so this now is the main wave count.
If the bull market is over and a bear market has begun, it has come after no divergence at the last all time high between price and the AD line as a measure of market breadth. Statistically this indicates the bear market to follow would most likely be relatively shallow. The 0.382 Fibonacci ratio would be a preferred target. The 0.236 Fibonacci ratio at 2,750.01 has already been passed.
The second target at the 0.618 Fibonacci ratio would have a lower probability. Lower probability does not mean no probability.
Cycle wave II may not move beyond the start of cycle wave I below 666.79.
DAILY CHART
Click chart to enlarge.
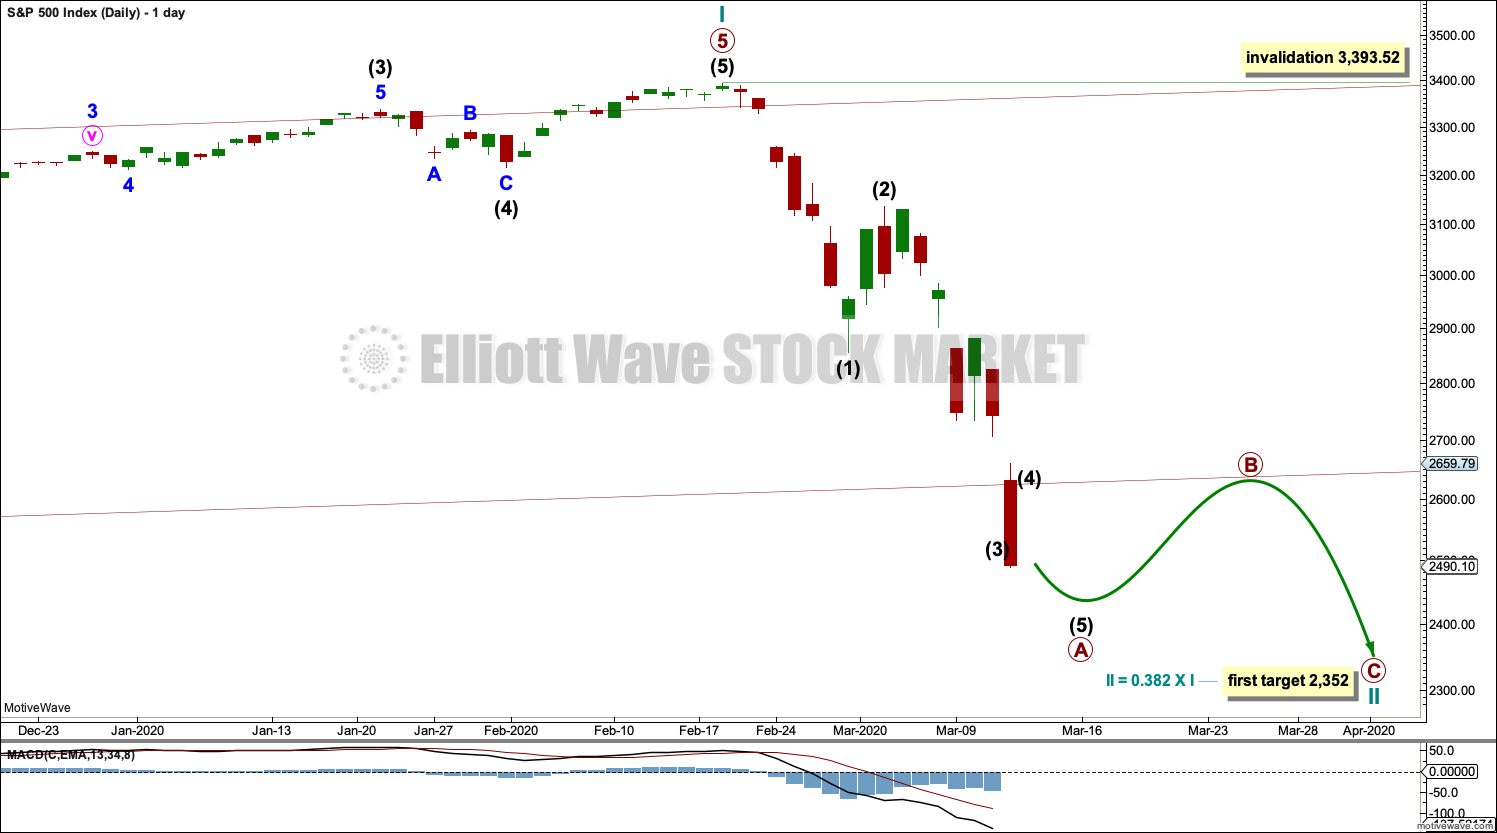
This wave count expects more downwards movement here.
Redraw the wide maroon trend channel carefully: draw the first trend line from the end of primary wave 1 at 2,093.55 (December 26, 2014), to the end of primary wave 3 at 2,940.91 (September 21, 2018), then place a parallel copy on the end of primary wave 2 at 1,810.10 (February 11, 2016). Today’s candlestick is almost all below the channel, and the close below is strong.
Cycle wave II may subdivide as any Elliott wave corrective structure except a triangle. It would most likely be a zigzag. Primary wave A may be an incomplete five wave impulse. Primary wave B may not move beyond the start of primary wave A above 3,393.52.
HOURLY CHART
Click chart to enlarge.
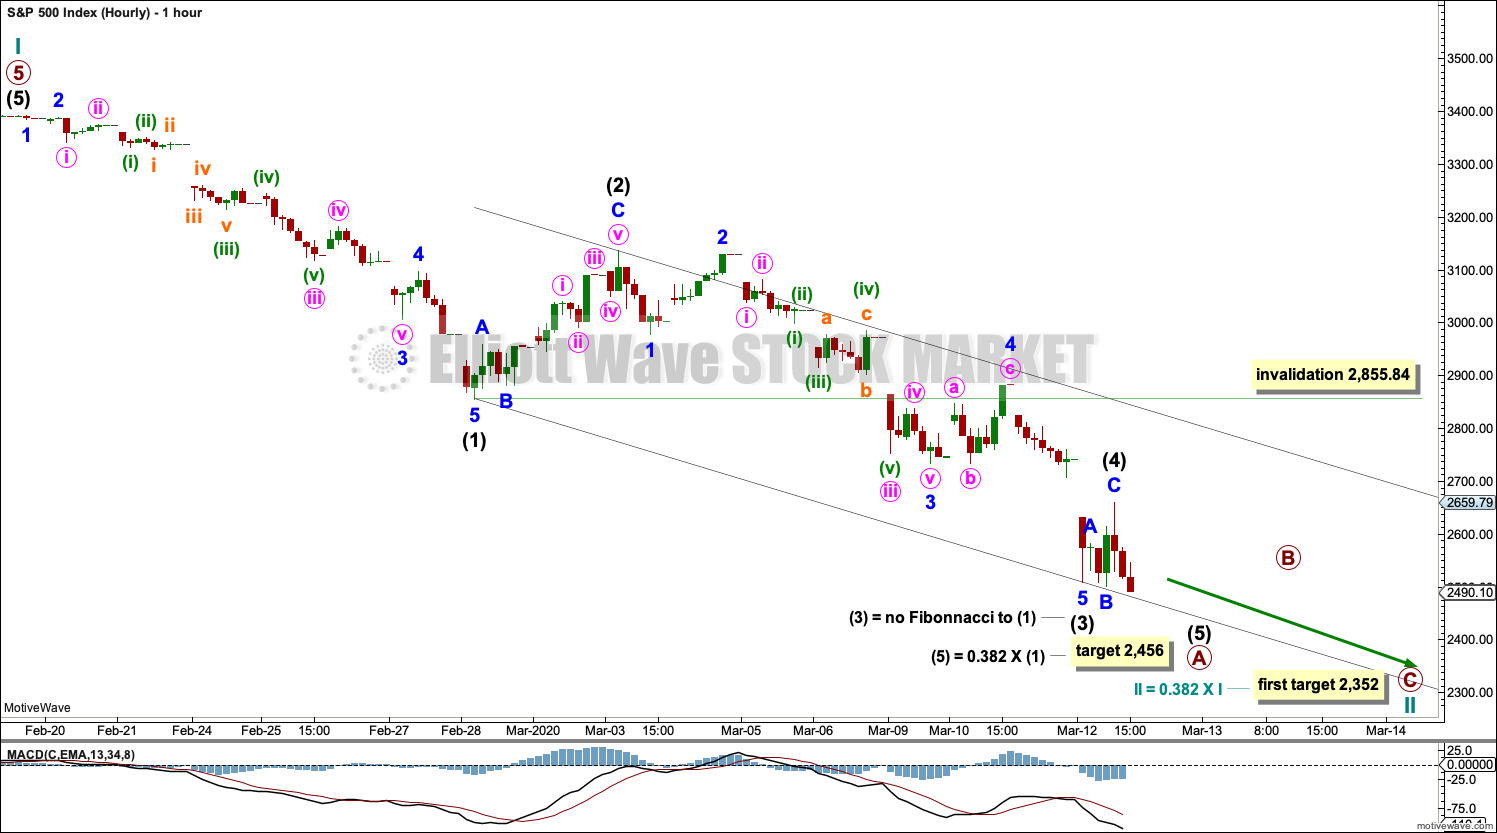
Primary wave A may be an incomplete five wave impulse. A target is calculated for it to end that fits with the first final target for cycle wave II.
If price reaches the target for primary wave A and keeps falling, then the next target may be at 2,329 where intermediate wave (5) would reach 0.618 the length of intermediate wave (1), and thereafter at 2,123 where intermediate wave (5) would reach equality in length with intermediate wave (1). However, both intermediate waves (1) and (3) may be thus far extended, so intermediate wave (5) may not be extended because only two of the three actionary waves may extend.
Intermediate wave (4) may not move into intermediate wave (1) price territory above 2,855.84.
TECHNICAL ANALYSIS
WEEKLY CHART
Click chart to enlarge. Chart courtesy of StockCharts.com.
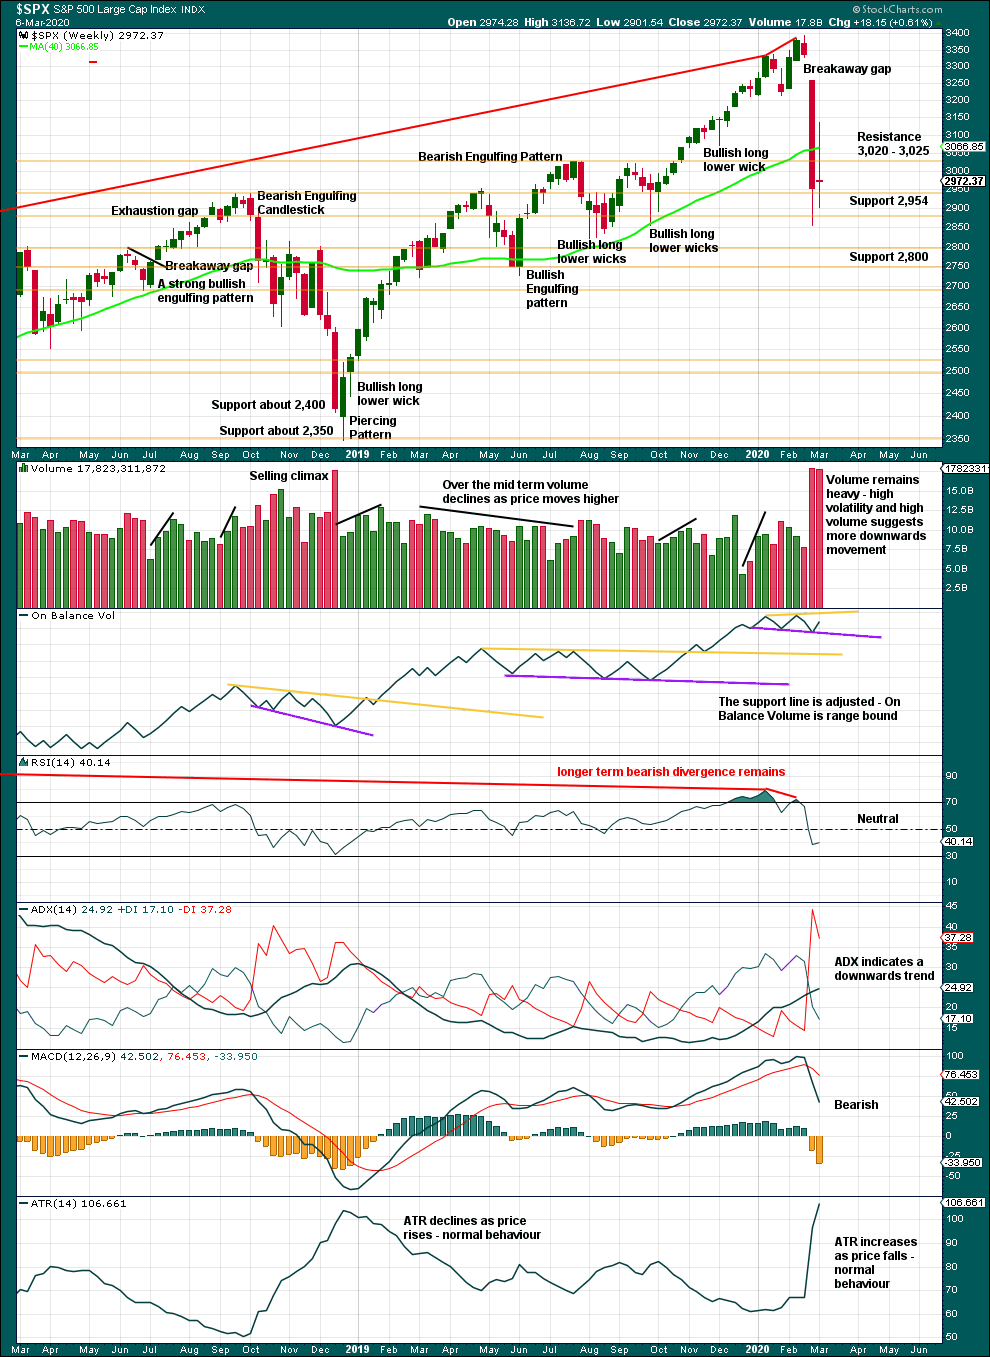
A 27% drop in price (high to close) no longer has precedent within the larger bull market. It is possible now that the secular bull market may be over.
At the weekly chart level, conditions are not yet oversold; this pullback may be expected to continue further.
A long legged doji last week represents a pause, a balance of bulls and bears. This is not a reversal pattern; doji appear within trends or consolidations.
DAILY CHART
Click chart to enlarge. Chart courtesy of StockCharts.com.
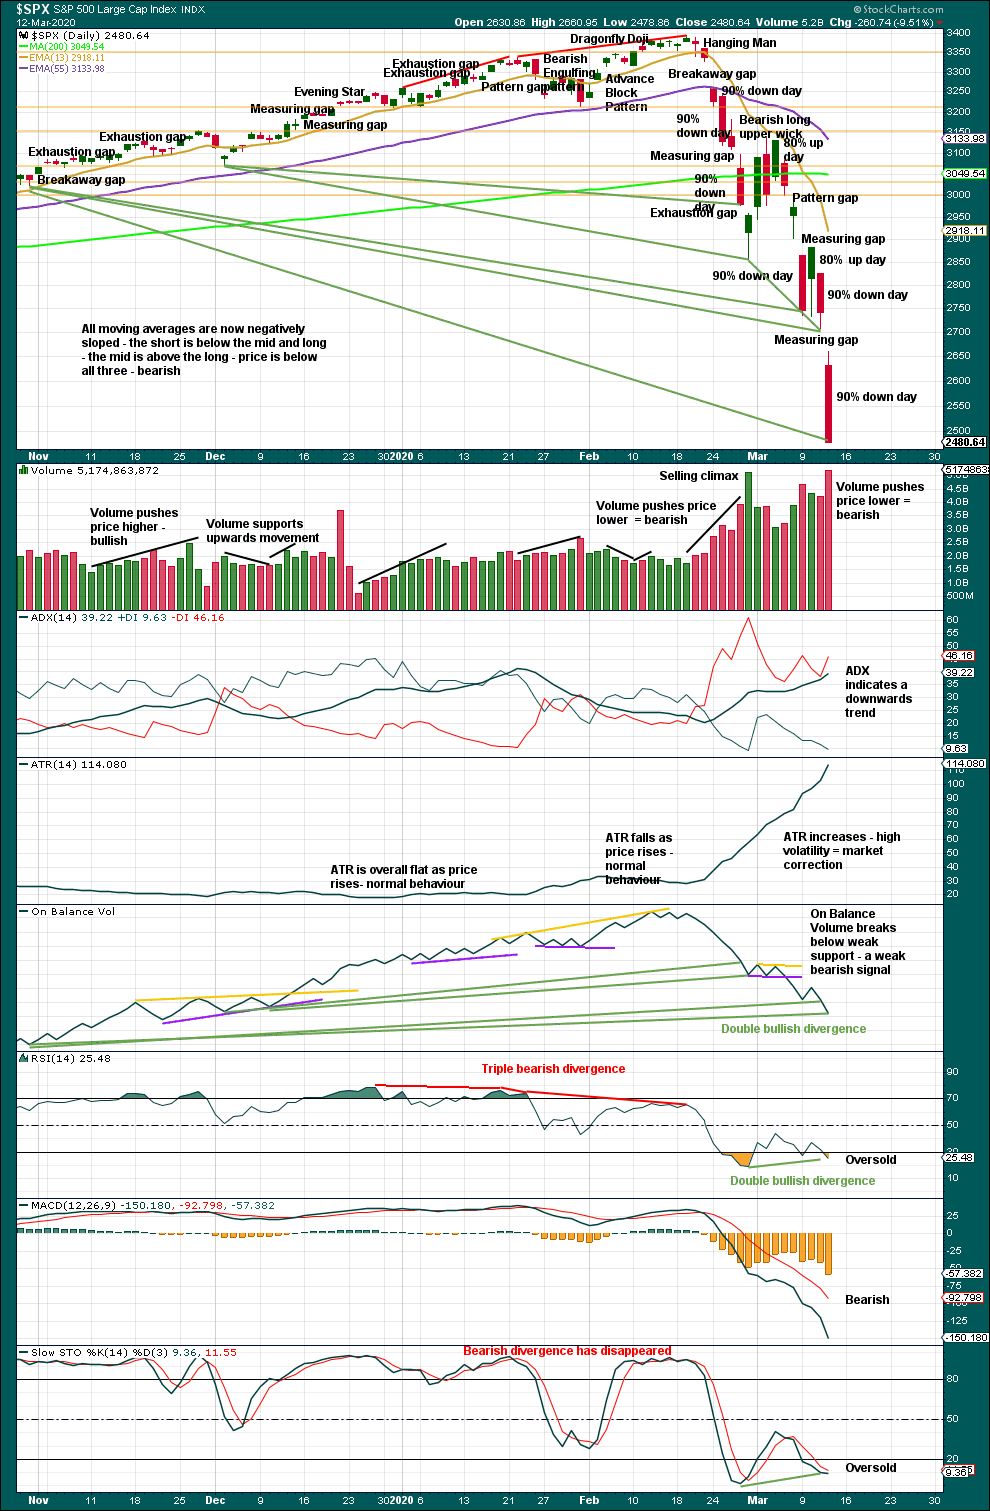
There are now six 90% downwards days in this strong downwards movement.
The following indicators still suggest a low may be in place soon:
– RSI reached deeply oversold and now exhibits short-term bullish divergence with price.
– Stochastics reached oversold and now exhibits short-term bullish divergence with price.
– On Balance Volume continues to exhibit bullish divergence with price.
The following indications will be looked for to provide confidence that a low is in place:
– A 90% upwards day.
– Two back to back 80% upwards days.
– A bullish candlestick reversal pattern.
At this stage, there is no evidence of a low in place. Assume the downwards trend remains intact until proven otherwise.
A target from today’s measuring gap is at 2,485.58, but this has already been passed.
Next support is about 2,350.
BREADTH – AD LINE
WEEKLY CHART
Click chart to enlarge. Chart courtesy of StockCharts.com. So that colour blind members are included, bearish signals
will be noted with blue and bullish signals with yellow.
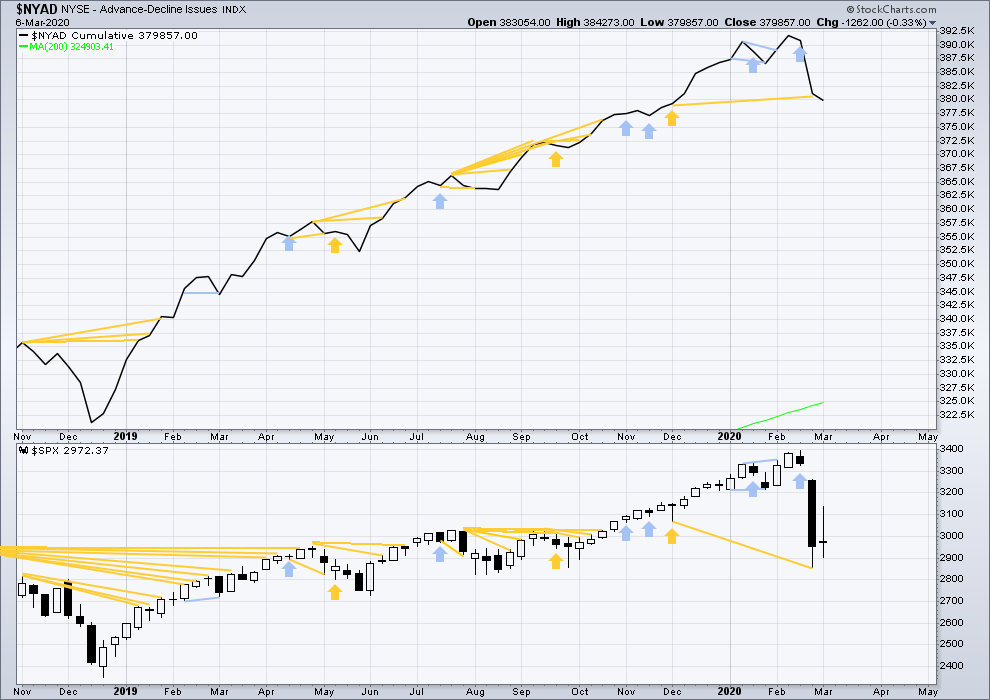
Bear markets from the Great Depression and onwards have been preceded by an average minimum of 4 months divergence between price and the AD line with only two exceptions in 1946 and 1976. With the AD line making new all time highs with last all time highs from price, the end of this bull market and the start of a new bear market is very likely a minimum of 4 months away, which is mid June 2020.
In all bear markets in the last 90 years there is some positive correlation (0.6022) between the length of bearish divergence and the depth of the following bear market. No to little divergence is correlated with more shallow bear markets. Longer divergence is correlated with deeper bear markets.
If a bear market does develop here, it comes after no bearish divergence. It would therefore more likely be shallow.
Last week price has moved sideways and the AD line has slightly declined. This is very slight bearish divergence.
Large caps all time high: 3,393.52 on 19th February 2020.
Mid caps all time high: 2,109.43 on 20th February 2020.
Small caps all time high: 1,100.58 on 27th August 2018.
DAILY CHART
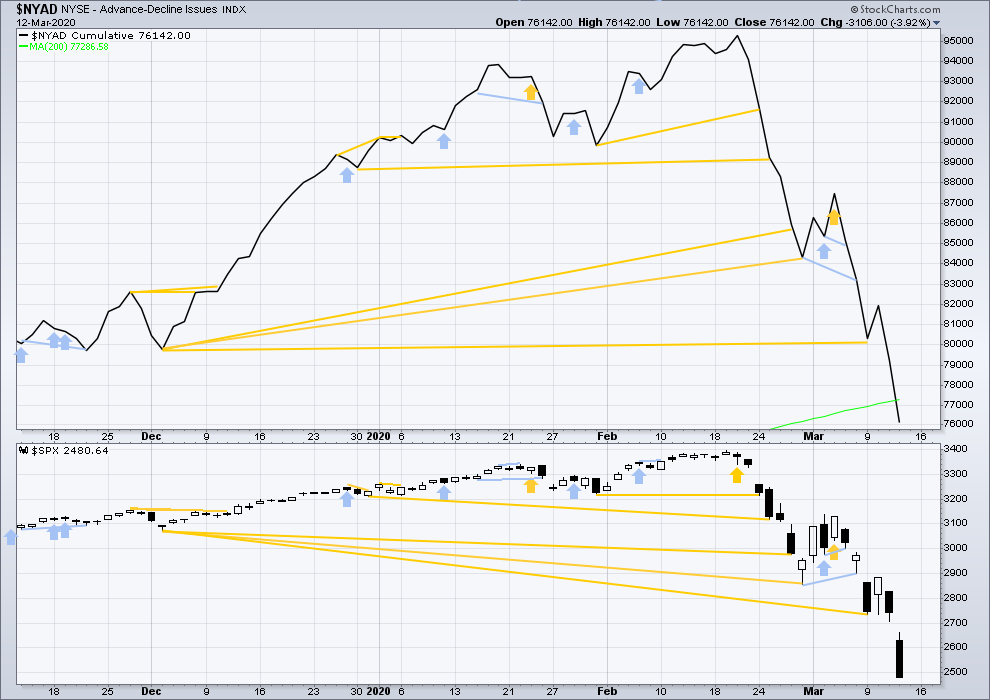
Click chart to enlarge. Chart courtesy of StockCharts.com. So that colour blind members are included, bearish signals
will be noted with blue and bullish signals with yellow.
Breadth should be read as a leading indicator.
Both price and the AD line have moved strongly lower. Both have made new mid-term swing lows. Bullish divergence was not followed by any upwards movement and is considered to have failed. There is no bullish divergence. The fall in price has support from a corresponding fall in breadth.
VOLATILITY – INVERTED VIX CHART
WEEKLY CHART
Click chart to enlarge. Chart courtesy of StockCharts.com. So that colour blind members are included, bearish signals
will be noted with blue and bullish signals with yellow.
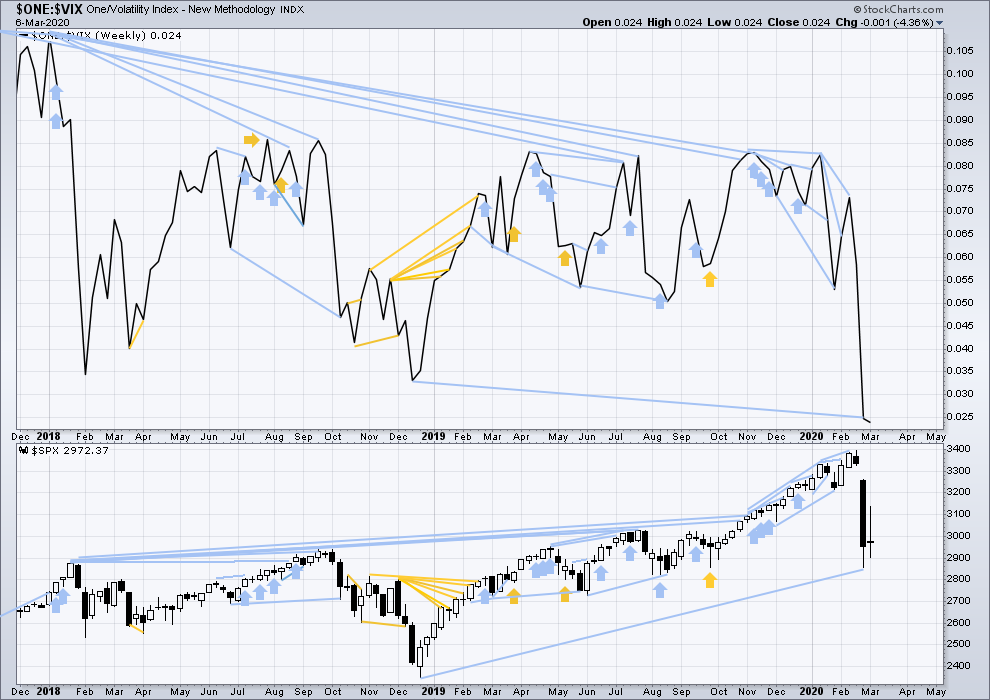
The all time high for inverted VIX was on 30th October 2017. There is now over two years of bearish divergence between price and inverted VIX.
The rise in price is not coming with a normal corresponding decline in VIX; VIX remains elevated. This long-term divergence is bearish and may yet develop further as the bull market matures.
This divergence may be an early warning, a part of the process of a top developing that may take years. It is clearly not useful in timing a trend change from bull to a fully fledged bear market.
Last week price has moved sideways and inverted VIX has moved slightly lower. This divergence is bearish for the short term.
DAILY CHART
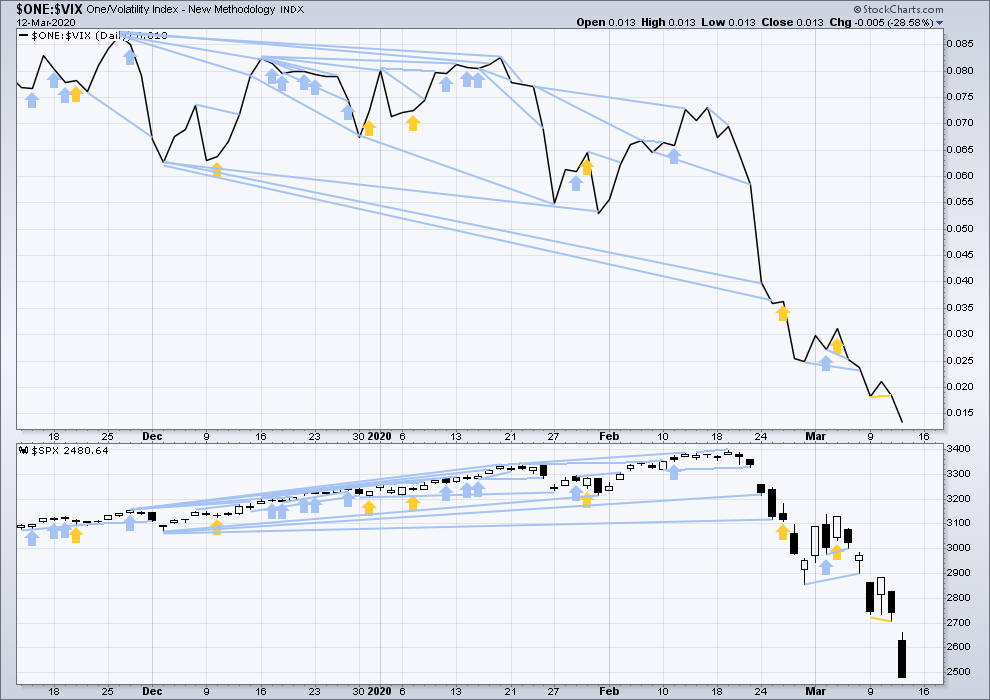
Click chart to enlarge. Chart courtesy of StockCharts.com. So that colour blind members are included, bearish signals
will be noted with blue and bullish signals with yellow.
Both price and inverted VIX have moved lower again today. Both have made new short and mid-term lows. There is no new divergence.
DOW THEORY
Dow Theory would confirm a bull market if the following highs are made:
DJIA: 26,951.81 – a close above this point has been made on the 3rd of July 2019.
DJT: 11,623.58 – to date DJT has failed to confirm an ongoing bull market.
S&P500: 2,940.91 – a close above this point was made on the 29th of April 2019.
Nasdaq: 8,133.30 – a close above this point was made on the 26th of April 2019.
Dow Theory would confirm a bear market if the following lows are made on a closing basis:
DJIA: 21,712.53
DJT: 8,636.79 – a close below this point has been made on March 9, 2020.
S&P500: 2,346.58
Nasdaq: 7,292.22
Published @ 06:50 p.m. EST.
—
Careful risk management protects your trading account(s).
Follow my two Golden Rules:
1. Always trade with stops.
2. Risk only 1-5% of equity on any one trade.
—
New updates to this analysis are in bold.
I’m sorry everybody, I know you’re all waiting for analysis but I just can’t finish it tonight. It’s nearly done, and shall be done and published Saturday morning.
I’m sure you’d rather I complete it when I’m not too tired to focus.
Well worth the wait Lara…well worth the wait…! 🙂
p.s. Panama is much closer to the BVI.
We got some nice beaches!!
Not totally surprised if we are in Primary 3 of the former bullish wave count.
I am building a short vol position and hedging with put spreads below and selling some upside call spreads as well.
I’ve finished my orientation tour of Panama and this afternoon we arrived back in Panama City.
I’ll be here for about two weeks, and although we had plans to go back to Texas and visit family that may not be able to happen because Covid-19. So it looks like we’re here to stay in Panama now.
The internet connection here in Panama City is very good. And I’ll have a bit more time over the next couple of weeks to focus on charts.
What a time to have travel planned!
Lara:
Pardon me for asking, but what does an “orientation tour” imply? Are you moving to Panama City?
I am moving to Panama, yes. Warm water surfing for me!
It’s a great central spot for Cesar and I to explore new waves to surf. Safe, good infrastructure and easy travel access (normally) to some really great waves.
I won’t be settling in Panama city, but we’ll find a spot in Panama with great waves.
Best of luck to you and Cesar as you look for your new residence. Have fun!
updated hourly chart:
A triangle may be unfolding for intermediate (4) and it could be complete as labelled, BUT triangles are very tricky structures. Too often it looks like a triangle is unfolding or even complete, only for it to be invalidated and the correction turns out to be something else, like a combination, or it was over sooner.
So the invalidation point remains at the end of intermediate (1).
I will be expecting a multi day bounce (possibly even multi week) for primary B. It should exhibit weakness.
Then the downwards trend to resume.
Yep! Morphed into what looks like a ZZ into the close. Sneaky!
Have a great week-end all!
Down Monday ?
I think so, or Tuesday.
Been patiently waiting over 6 years for this day…my last company (I was VP of Engineering and CTO) was acquired by private equity in late 2013. I got a nice payout of 1/3 of my shares plus a sizable performance bonus. A few months later…I was terminated with a one year severance; complete shock. But only the first to go! 18 months later, the ENTIRE executive team including the CEO was gone (I don’t think anyone except the CEO got such a nice exit package though; as they say, “first out the door does best”). 2/3’rds of my shares in the aquisition rolled into preferred stock in the new company. Just got word: they are finally being acquired again by yet another PE firm. Sadly at ONLY the same price as the original acquisition, seven years later; that’s crappy performance, I guess they should have kept the talent that got them valuable in the first place!!! I was the R&D leader there from 2006 to 2013 and we grew from nothing to a selling value of $156M. Doh. Anyway, I’m thrilled to get ANYTHING, and it’s manna from heaven for me. A VERY happy Friday for me…
Cheers!
Congratulations Kevin. Well done!
Looks like another “Cobra” is coming on an hourly chart. Plus the second shoulder is completing from head and shoulders pattern I could see. Might be wrong, but it looks so familiar 🙂
chart? show us what you see
Never mind- looks like after 8th touch on an hourly for today it finally breached it on the upside. Now it will probably start testing upper limit of that down channel.
Four tests from underneath of the big channel line…four failures so far.
Descending triangle with a breakout projects a move roughly 165 SPX points down; SPX 2350 right in line with Lara’s main count target.
Da Coil… 🙂
Verne/Kevin et. all – can you explain the concept of cobra/coil to me? If there’s ready material out there I’m happy to look there too. Just haven’t heard about it much outside of this board. Thanks!
It’s really Verne’s term but I think I understand it. Essentially it’s consolidating price action in a price range. When it keeps constricting it’s a “triangle”, but a coil is a more liberal reading. The point isn’t to get hung up on traditional patterns like “rectangles” or “triangles”, but just note the essence of what’s going on: a pause in the trend, or a preparation for a change in the trend. The most common behavior is price exiting in the direction from which price entered (continuation consolidation). But reversing sometimes occurs to. And of course there are sometimes head fakes out (goes one way for a bit…then slams back the other way, through the consolidation range and keeps trucking.) So…a “coil”, because the consolidation period by definition has a lot of overlapping price movement in a range.
thank Kevin, nice break down.
Excellent explanation Kevin. Thanks.
The reason you have never read about it anywhere is the term is an original. Lara’s site is quite unusual in that there are traders here who are willing to share strategies and techniques they have learned in the trenches. Very unusual.
Good traders are notoriously reticent to share info that actually works, and with good reason. Crowded trades are no good.
A few years ago Lara gave us the O.K to share our trade ideas in real time and so you will often see some of us actually put up our entries and exits. Very few analysts actually trade their game, and that is the way you separate the wheat from the chaff. Anyone can throw up a chart. Gleaning actionable info from it is quite another matter.
Will be ever grateful to the guys I learned so much from : Dick Diamond, John Carter, Jeff Clark, Bryan Bottarelli. Those guys are the real deal (RIP Dick).
Of course, nothing matters more than getting the trend right, and who better than Lara?
Best of trading success guys!
Thank you for this explanation!
This comments on this board definitely has influenced how I approach my own trading. Just about the right amount of comments each day to ponder. I’m learning a ton from you all, thank you.
VIX will give you a fairly reliable signal at the end of this fifth down. The high will come with three of five, and a lower high on completion of five of five.
you’re liking the 77.57 high as 5 on the vix or you’re saying there will be another run on it?
Likely a new high with the 3 of five down, and a lower high at the end of the fifth of five…
October 87 crash took VIX to 150 level
We have another sidewinder, likely a fourth wave. Great long entry after the next wave down….
agreed
would love to see it on a chart if you’ve got one handy
Verne isn’t good with posting charts. I’ve asked before 🙁
Sadly true…I need to work on that and not keep all those patterns in my head…!
Or a time to take profits in short trades, and look to reload again later at cheaper prices for the spread. Bingo!!
No longs for me in this market.
DAX was up 9% earlier today. Now it is in the red by almost 1%. SPX to follow?
Just ‘truckin’ down the do-dad road.
RUT has been the “leader” in this market collapse throughout, and arguably the canary for the last year or more by being so divergent with SPX and NDX in its price structure.
Pay attention to the “leader”: RUT is rock solid down again today to fresh lows.
Trucking down the do-dad road is a good way to stay out of trouble 🙂
Question: This is where I often make mistakes. The market seems noncommittal at this point. So, I tend to fall into the same funk. When a break then occurs, I’ll not respond thinking there is nothing to it…only to see a sizable move leave me behind. I guess one’s mindset of being a position guy rather than one comfortable with day-trading is what makes the difference?
I “day trade” less and less and less. I take positions that my analysis says should pay off well over some time (days to weeks, maybe months). Then if the market moves strongly in my favor quickly and I can take the bulk of the profits (maybe 60% or more)…I often do so. Gets me out of the “hot seat”, because risk is risk.
Here’s an example of a trade I put on just now. I sold a SPX call spread for Apr 16 expiry. I think this market is headed down. But I’m giving myself a lot of time to be right. To reduce risk and maximize gain, I’ve sold the spread well OUT of the money. 2350/2360 (sell 2350 calls, buy 2360 calls) I got $6.37 per spread. So for example sell 10 and the max profit is $6370 minus slippage and commissions, so call it $6300. Now the profit/lose curve on the loss side stays VERY shallow until we get much closer to expiry. So if the market goes against me, I should be able to get out for perhaps $1000 loss on the 10 lot. I like this trade. If I have reason to believe a significant bottom is in well before expiry and I’m in the profit zone…maybe I take what I can get then. Or maybe I take 1/2 and wait and see.
So there’s one idea for you. Another would be to sell a call spread well IN the money, one that is VERY high probability of paying off…but if the market goes against you, it’s gonna hurt, and if you hold and hope, it’s gonna hurt BADLY. I have one of those now too: I sold a 2990/2910 in SPX for next Friday. The idea here is shorter time to expiry so I can quickly benefit from the premium decay, and get out of the hot seat quickest! With this one, if I get 1/2 of my profits in hand because price goes my way…I might take it. Because while the probability of loss is quite low, the PRICE of loss is very high.
It’s not uncommon in these wild market conditions that I’ll put on such a trade and end up taking it the same day. So I’m setting up “positions”…but sometimes “day trading” them.
I’m not a CTA; my ideas are for EDUCATION only. Make your own decisions; own your own risk (I kind of have to say that).
One more idea, again, a trade I just took.
I like that RUT is CRASHING, and I expect more. I like to take low cost, high payoff bets in such an environment, and butterfly spreads the way to do that.
So I bought IWM ‘fly spreads for March 27, 105/102/100 (unbalanced; that’s key, so that if price zooms down and right by the heart of the fly, I STILL AM IN PROFIT). That’s buy one 105 and 100 while selling TWO 102’s. Cost me $0.42 per spread. So only $420 bucks for 10. THAT’S THE MAX I CAN LOSE! And of course if price moves against me I can and will get out for less loss than that. Max win? $2300. If price goes well below 100? $550. Love this trade.
Thank you for taking the time in writing such a thorough explanation. As I have followed many of you guys, it is clear I need to expand my repertoire of trading approaches. Thanks again.
Hi Kevin and I’d love to also hear what Verne has to say if you don’t mind sharing because : I know both of you are relatively comfortable w/placing and managing option spread trades at uncomfortable moments and riding them thru(managing legs, rolling, etc.).
It is obvious you have a knack for spread trading. What has been the most effective way that both of you have learned this valuable skill. I know Kevin has mentioned Theo Trade. I have been following their blogs consistently and after tax time may try a few courses. Verne in the past has given his approval for John Carter albeit, expensive. I think many traders here would be grateful to know best way to get effective spread trading education so one can not only be effective in placing the trade, but also confident in managing and exiting.
I know it sounds basic, but besides owning stock here/there I have been simply picking my levels in this turbulenc and purchasing SPY Put options w/high OI, OTM w/ a stop Or watching very closely. I’ve done O.K. so far, BUT…well aware a risky and expensive way to go….not a long term solution. Also , the lower we go, these options tend to gain less as traders may be anticipating we are closer to a bottom than not.
Anything you could share about educational resources [how you learned] that are truly ‘worth their salt’ would be greatly appreciated. I do also realize that one definitely needs to have ‘the will’ for this style of trading.
Thanks….Melanie
Melanie I’ll provide my answer on the weekend update to be sure everyone sees it, since it’s after market close now and many will never look here again…great question!!
Hey Rob – I don’t trade nearly as often as some of our members here nor am I anywhere close to the sharpest (ha), but for what it’s worth below is what I do when I trade shorter term.
1. I identify a purpose. For example, yesterday I wanted to sell a call to get some income to hedge against the downside.
2. I mentally prepare. I have a fairly large long position that’s in the red, so mentally I wanted to pick a strike that if reached, I wouldn’t make money on this trade but I’d be darn happy because my long position is in a much better place.
3. I take a stab at the day’s trend. Given that we were having a washout day, I decided to not do anything until “something” happened to the upside.
4. I use some kind of technical indicator for intraday timing. A long time ago some newsletter I followed suggested the 5 min period with Williams %R set at -1.15 and -90, and Ultimate Oscillator set at normal settings. The overbought/oversold signals has worked well for identifying entry points, as long as it is ***with the trend***. It’s a little hokey I know but better than nothing. You may have something even better (please share!!)
5. I have an idea on what to do if things go wrong. In this particular case, I planned to sell only a 50% position and leave the other 50% for rescuing the trade by rolling forward and up in price if necessary.
So yesterday when that spike happened midday, I had the perfect setup. I was mentally prepared to open a position, my guess at the day’s trend was right at the time, and the indicators were signaling overbought (%R at -4, UO at 63.5). As soon as the prices started moving back down, I sold 30 Mar 20 $265 Calls for $10.
I have no idea how it will work out by next Friday, but I will be thrilled if I make all $30K from the trade, or if SPY is at or around $275 by then. And we are above $275, then I have another 50% of powder ready to rescue the trade.
Of the steps above, I believe the most important thing is to get the daily trend right, and to be mentally prepared if the trade doesn’t go your way. The first will limit the number of your trades but give them a higher chance of success, and the second will keep you wanting to trade!
Hope this helps.
I truly appreciate your reply…great information. I will most certainly take a look at William’s %r and the Ultimate Oscillator. I’m also impressed at how many different approaches can be utilized in establishing a trading approach. I have found that study and research are absolutely necessary; but, until applied the lessons aren’t truly learned. I appreciate everyone’s willingness to share their experience. Thanks
Some Fibonacci fitted projections of ultimate lows of this bear market using SPX (blue dashed lines below price; the ones at the top were projections for the ultimate high of the prior bull swing). Also put in the 262% extension level of the A wave. The fit at this low is quite poor, strongly added to overall evidence that this bear is going to be traveling further before going back to his den!
Last chance to get off the train before it heads south again ???
or get ON the southbound train…. join us, its warm inside
Does it offer safety from Coronavirus 🙂
No safety except for seat belts and shoulder straps for roller coasters.
Lol!!!!!
Always liked that song “Southbound” from the Brothers and Sisters Allman Brother’s album. Back when Dickie Betts’ guitar was ringing out from radios everywhere. I was long haired surfer/skateboarder/stoner getting in trouble in high school back then (it was the mid-70’s in SoCal!). Then I started dating a girl and wanted to impress her, and start excelling in school and well, I did okay after that. Been married to her for 39 years now. Now I try to impress her with some bucks from trading! A long strange trip it has been…
It certainly has been a long strange trip. Glad I stopped to smell the roses. And congrats on a long marriage. I am on year 44.
BTW, The Allman Brothers rock! Or rocked.
The original “all of the sell off” channel was broken to the downside yesterday. Today, it’s getting tested from below.
A channel of just the C wave down is added in this chart. And the mid point crosses exactly at that original lower channel line test price.
I think this is a key battleground re: likely price action for the next few days.
Thanks Kevin. I read your comment near the end of yesterday’s session about moving to “mostly cash” to wait for a clearer picture. In response to that, I reduced my short exposure. I appreciate the input from you more experienced traders.
Well, thank you. Now given a big up day…I hope your decision plays out well for you longer term. All the evidence I see indicates a lot more down to come before this debacle is over.
Kevin.
Do you think we will touch 2700 tonight
Unlikely. It is possible. But it would surprise me a lot.
What big money is going to start buying campaigns here, and why? Seems unlikely to me.
I thought the Fed was supposed to meet
Thanks Kevin. Just noticed your response to my question. Thankyou again. Don’t mind me.
So far we touched 61.8 of yesterday range and retraced.
Futures lock limit up, I have never witnessed such long limit up ever…. if it stays this way then it probably gonna gap up, what if it comes back into the monthly channel strongly and have a strong up day..
I guess will require change in the count.
BTW RUT looks like a nice ABC from the 2018 high, if it recapture the Dec-2018 low (ie back into wave 1) then it could be counted as cycle IV complete in RUT as well as few other European indices with expanded flats
Did not realise they had it for a limit up.
Learning something new each day
Do we have Fib levels for this retracement?
Yeah 5% hard limit up/down before the RTH session, no limit up lock levels in RTH though.. only down for 7%, 13% then 20% trading stops
also- no breakers after 3:25 pm
this would be the (4) on the daily chart-no?
I’m thinkin’ yes, but looking forward to hearing that from Lara later. Expanding flat?
Wow ?, seems like another bull trap…..
4 waves up are!!!
Hi Kevin.
I just noticed a comment. Is the Fed meeting today. Being Friday. ? Thankyou again
No, not that I’m aware, just Rishi’s “rumor” that they are going to do another emergency cut. I don’t know anything more than that.
fed meeting next tues. and wed., announcement on wed.
It appears a bomb has been put under the futures. 150 points in approx an hour. Amazing
Well this has definitely been the most expensive subscription ever. I picked the worst week ever to subscribe. *licks wounds after sanitizing
Yep, I’m afraid in this above all other weeks, the old adage prevails:
Picking bottoms gives you dirty fingers.
I think this has been particularly difficult coming straight off highs. There was a 50% retrace to get some shorts off, but again that was recognised by most as a new upmove, rather than a counter trend shorting opportunity at about 500s&p points ago !
2393…. I have puts, but NOW I’m staring to feel anxiety
Ok 100 handles in a 2 hours candle, I’m out for now .. SOH
Thanks Lara! Why aren’t you considering an expanded flat where wave 4 had been in Play all along since December 2018? I don’t think you never considered to be an alternative since I joined this service. To me the wave 5 as per your analysis as complete wasn’t convincing. What am I missing?
interestingly, that would (?) be more consistent with Dow theory.
I am not very familiar with Dow theory but I had a feeling all along that the dec 2018 low to ATH looked like a 3 wave with a consolidation as a B, perhaps a triangle. Do you see this way?
I leave that to the EW experts to debate. My EW skills are not sufficient to really have a valuable insight into that.
An expanded flat for a fourth wave would have had to start in September 2018.
An expanded flat would have a B wave that would be 1.76 X wave A. That’s quite a lot longer than the common range of up to 1.38 but within an allowable guideline of up to 2.
The proportion doesn’t look good either. The counterpart second wave (of the same degree) would have lasted 14 months from Dec 2014 to Feb 2016. So far this possible expanded flat for a fourth wave would have lasted 18 months and it’s incomplete.
Rather interesting that Dow Theory says we’ve been in a bear market since what, Dec of 2018? Or did it begin in February of 2018? Either way…interesting. Got awfully close to moving to bull market status (transports got within about 12 points or so), but no. Now, it’s going to be a very, very long time until DT flashes a new bull market! I rather wonder if there will EVER be a DT bull market again, actually.
2400….. I wasn’t ready for that
Strong rumour that FED will drop the rates to Zero as well adding additional $500 billion via expanded repos. Wondering how that helps beyond creating and magnifying the asset bubble further.
The only folks I can see it helping are those with massive loans with interest rates tied to US benchmarks. Gee, I wonder who might be in that situation…
Nor I. I expected a rather larger intermediate 4 up. And I’m suspicious this is a head fake down, the rate cuts come tomorrow, and the intermediate 4 turns in a much larger (and most proportioned with intermediate 2) expanding flat. That’s what I’m hoping anyway. A better set up for fresh shorts.
I don’t want to flog a dead horse on the Covid 19 matter.
I must say however, how deeply saddened I am by the outright lies being told by some very able folk in the medical and virology fields who I know know far better.
There is an abundance of evidence about the origins of this awful virus.
The first moment I heard about this I was suspicious. The warnings from Frances Boyle confirmed my own fears. Those of you on the site who are Scientists I am sure are aware of the very dangerous so-called “Gain of Function” insane stuides with deadly pathogens that our Governement reccklessly funds and justifies, and I was also aware of a few done specifically with this particular virus. The dishonest , specious, and repeated comparisons to the flu with what we are dealing with is truly incomprehensible and betrays incredible contempt for thinking folk, notwithstanding the average person may not have the means (or interest) to search the literature to ferret out the truth. This is a dangerous pathogen.
And why?
Because it was ENGINEERED to be!!
Please do your own due diligence and take any and all steps you can to avoid being infected. Had to get that off my chest, and now I’m done.
https://www.the-scientist.com/news-opinion/lab-made-coronavirus-triggers-debate-34502
Good read, here’s a youtube link, you may have already seen this.
https://www.youtube.com/watch?v=E3URhJx0NSw
Lara what are Lowrys saying now other than the 90% down days ?
They keep pointing out that at the last ATH there was no increase in selling pressure and no decline in breadth, both of which almost always (not always) precede a major market decline.
They also say that conditions are right now deeply oversold.
Thanks Lara
Thanks Lara.
As per analysis It seems like this correction will last just few months or do you think it will last 2-3 years and we will have painstakingly ranging primary B?
Corrections tend to be quicker than the impulses they correct for this market. The impulse lasted one month short of 11 years, so this correction could be over in months to a couple of years.
It could also be over in weeks.
I’m here. Not infected yet.
thank goodness, keep washin those hands , and no more corona beer.
I have it on firm reports that copious amounts of Corona beer stops Corona virus, well, better even than the product from Jim Bakker!!
Like dissolves like …