
Strong downwards movement has brought price below the point where this pullback was expected to end but very slightly above the invalidation point for the main Elliott wave count.
Summary: There is no evidence to suggest the larger bull market is over. Downwards movement over the last four weeks is expected to most likely be a deep pullback, which has precedent in this secular bull market that began in 2009. It may be over at today’s low.
A new low below 2,728.81 tomorrow would indicate a deeper correction that may end at the lower edge of the teal multi-year trend channel.
The biggest picture, Grand Super Cycle analysis, is here.
Last monthly charts analysis is here with video here.
ELLIOTT WAVE COUNTS
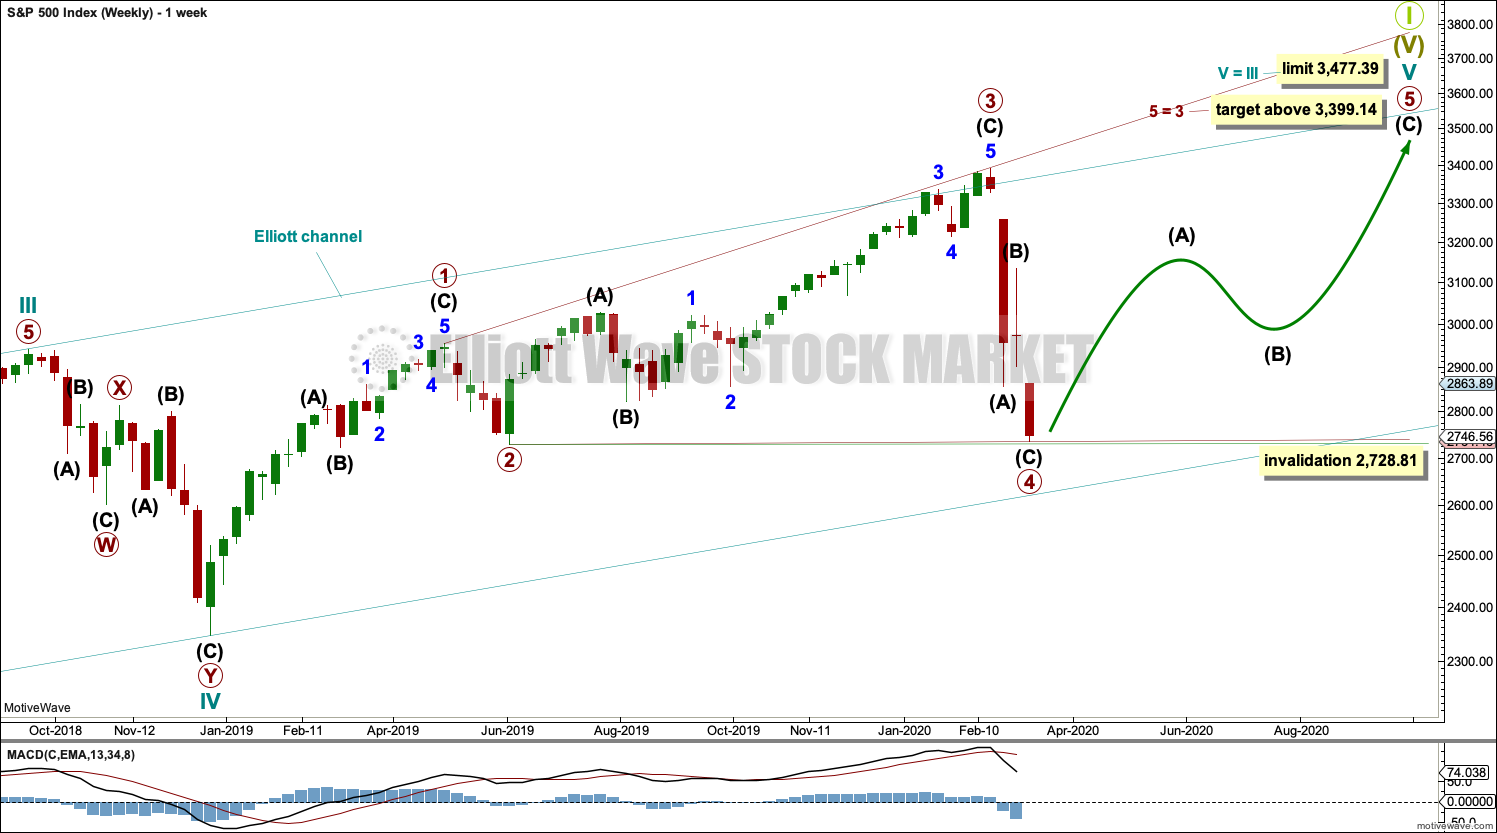
FIRST WAVE COUNT
WEEKLY CHART
Click chart to enlarge.
Cycle wave V may subdivide either as an impulse or an ending diagonal. This wave count considers a diagonal. The alternate considers an impulse.
A channel is drawn about the impulse of Super Cycle wave (V) using Elliott’s first technique. Draw this channel first from the high of 2,079.46 on the 5th of December 2014 to the high of 2,940.91 on the 21st of September 2018, then place a parallel copy on the low at 1,810.10 on the 11th of February 2016. Cycle wave IV found support about the lower edge. The lower edge of this channel is currently very important and should be watched closely tomorrow.
The middle of the third wave overshoots the upper edge of the Elliott channel drawn about this impulse (off to the left of the chart). All remaining movement is contained within the channel. This has a typical look.
Within Super Cycle wave (V), cycle wave III may not be the shortest actionary wave. Because cycle wave III is shorter than cycle wave I, this limits cycle wave V to no longer than equality in length with cycle wave III at 3,477.39. A new high by any amount at any time frame above this point would invalidate this main wave count in favour of one of the two alternate monthly charts which may be seen in last published monthly analysis.
At this stage, cycle wave V may end within this year or possibly into next year.
The daily chart below will focus on movement from the end of intermediate wave (B) within primary wave 3.
Ending diagonals require all sub-waves to subdivide as zigzags. Primary wave 4 of a diagonal must overlap primary wave 2. This rule is now met. Primary wave 4 may not move below the end of primary wave 2 below 2,728.81.
This ending diagonal would be expanding. Primary wave 3 is longer than primary wave 1, and primary wave 4 so far is longer than primary wave 2. Primary wave 5 would need to be longer than primary wave 3 for all rules regarding wave lengths of expanding diagonals to be met.
Downwards movement for this main wave count must end here (or very soon tomorrow) for the wave count to remain valid. If primary wave 5 begins here, then it must be longer than primary wave 3 at 3,399.14.
DAILY CHART

Click chart to enlarge.
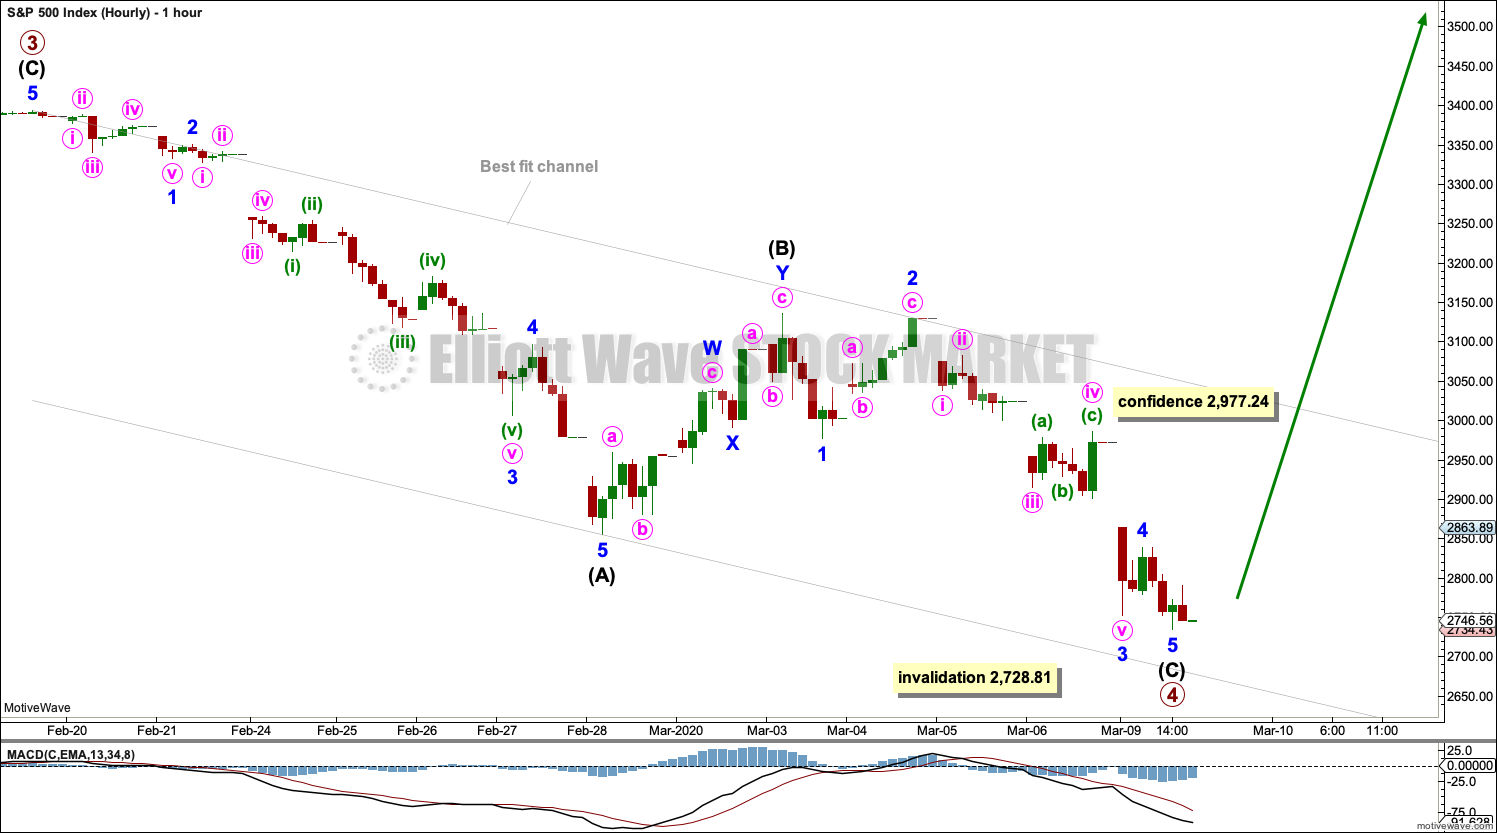
All sub-waves of an ending diagonal must subdivide as zigzags. This is the only Elliott wave structure where a third wave sub-divides as anything other than an impulse.
Primary wave 4 must subdivide as a zigzag. Intermediate wave (B) within the zigzag may have been more brief than expected, and it may have been over last week. Intermediate wave (C) for this wave count may now also be over here, or it may be over very early in the next session.
Diagonals normally adhere very well to their trend lines, which may be tested within the sub-waves. The upper 1-3 trend line is tested at the end of minor wave 3 within intermediate wave (C) within primary wave 3.
Primary wave 4 may not move beyond the end of primary wave 2 below 2,728.81.
HOURLY CHART
Click chart to enlarge.
It is possible to see primary wave 4 as a complete zigzag. A best fit channel is drawn to contain almost all of this movement.
A new high above 2,977.24 would invalidate the alternate below for the short term and provide some confidence in this main wave count.
A breach of the best fit channel would provide further confidence that a sustainable low may be in.
Strong confidence that a sustainable low is in place would come now with a 90% up day or two back to back 80% up days.
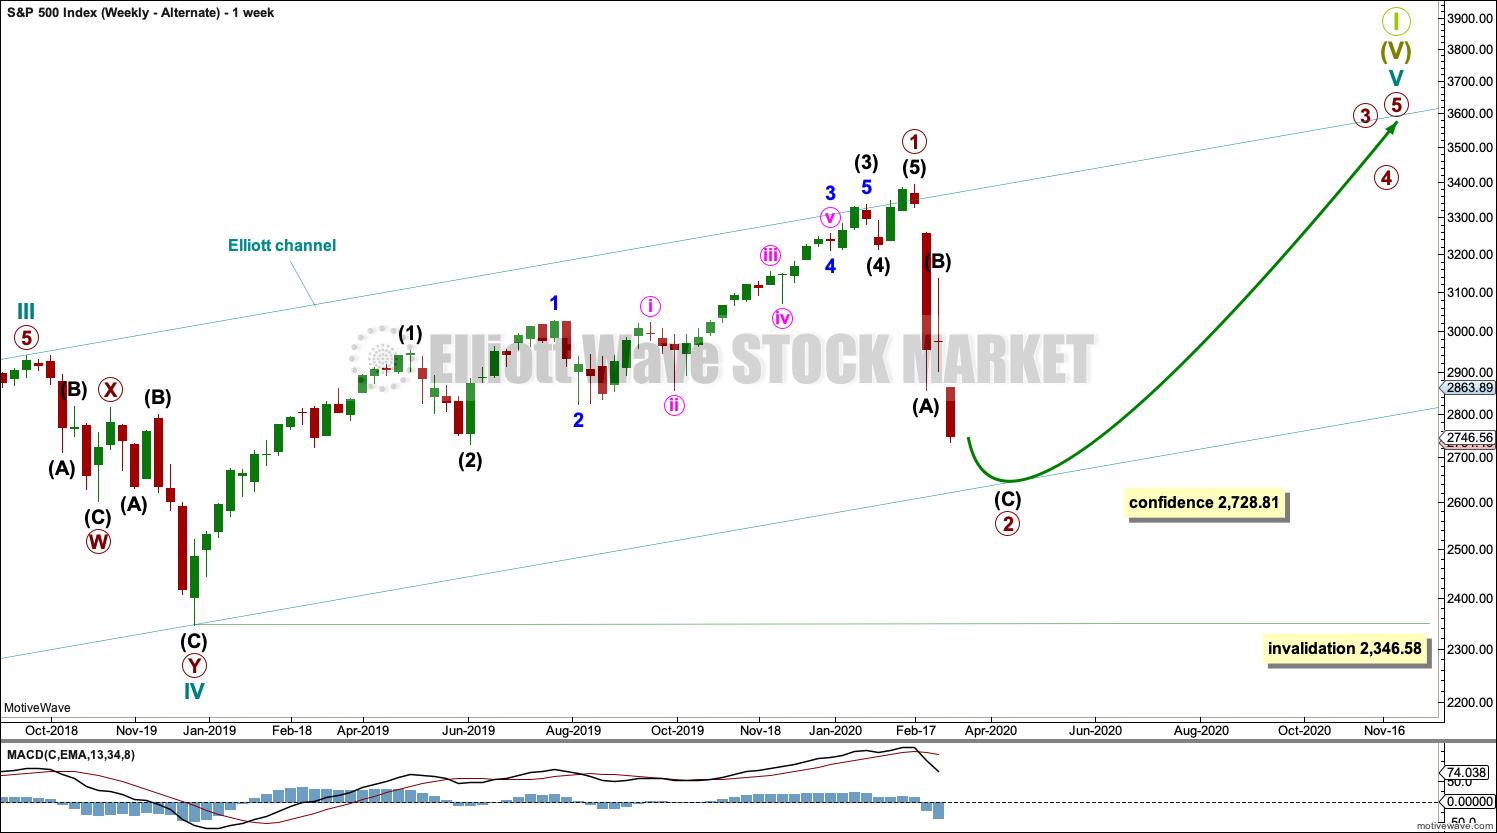
ALTERNATE WAVE COUNT
WEEKLY CHART
Click chart to enlarge.
It is also possible that cycle wave V may still be unfolding as an impulse. Within the impulse, only primary wave 1 may be over at the last high.
Primary wave 1 is seen as an impulse. Within primary wave 1, there is poor proportion between the corrections of intermediate waves (2) and (4) and minor waves 2 and 4. This gives the wave count a forced look, but it is valid. The S&P does not always exhibit good proportion, so a little flexibility in the right look is sometimes required.
Primary wave 2 may be unfolding as a zigzag. It may find strong support about the lower edge of the multi-year teal trend channel.
Primary wave 2 may not move beyond the start of primary wave 1 below 2,346.58.
If the main wave count is invalidated with a new low below 2,728.81, then this alternate would then be used.
The limit is removed from this alternate. If only primary wave 1 is over at the last all time high, then more room would be required for the structure of cycle wave V to complete than the limit would allow. This alternate may fit with one of the alternate monthly charts.
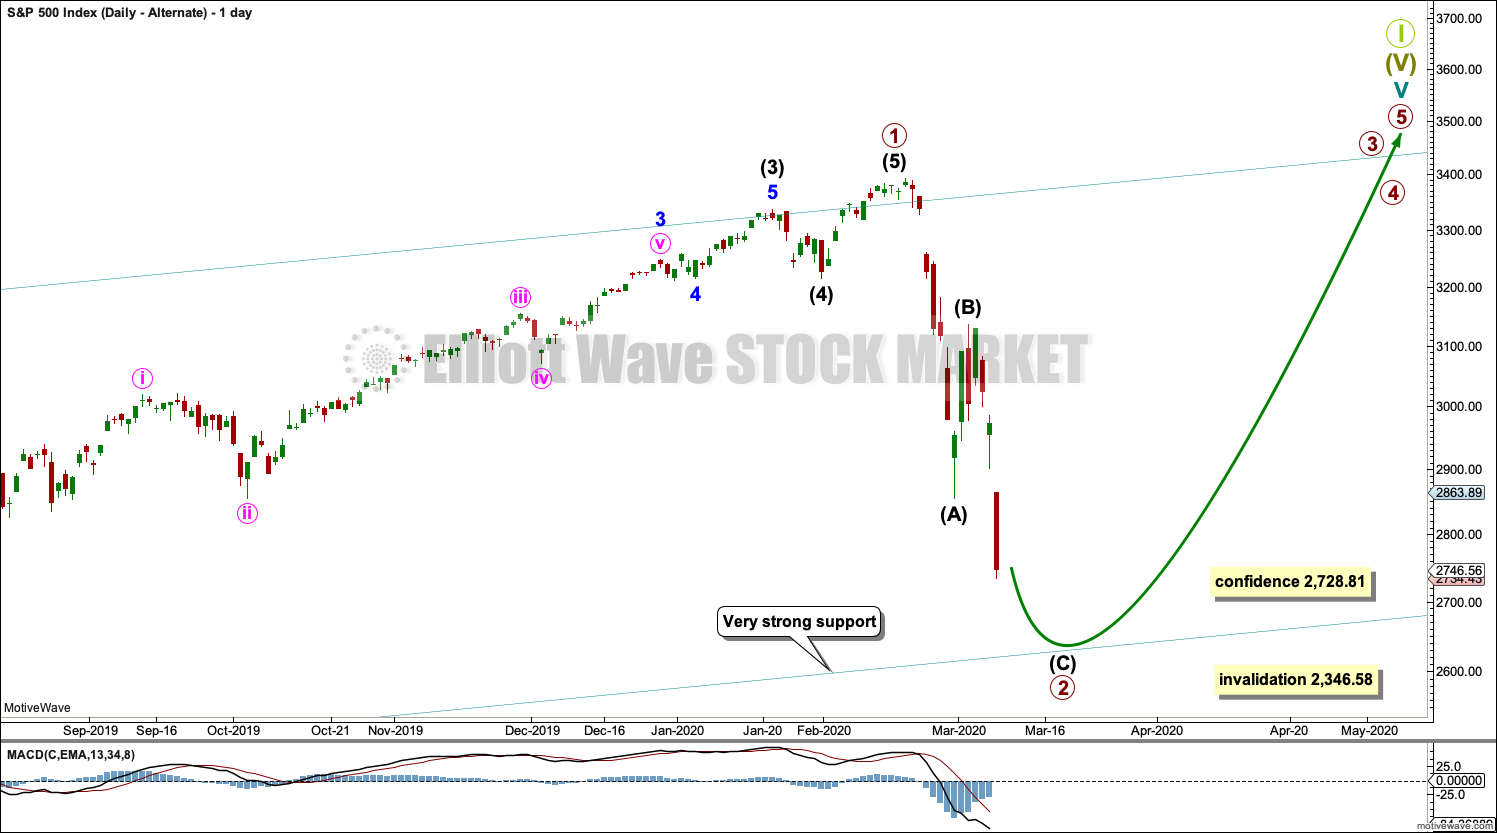
DAILY CHART
Click chart to enlarge.
This wave count allows for more downwards movement here. Primary wave 2 may not end until price comes down again to test the lower edge of the teal channel.
Primary wave 2 may be subdividing as a zigzag; this is the most common Elliott wave structure for a second wave. Primary wave 2 may not move beyond the start of primary wave 1 below 2,346.58.
HOURLY CHART
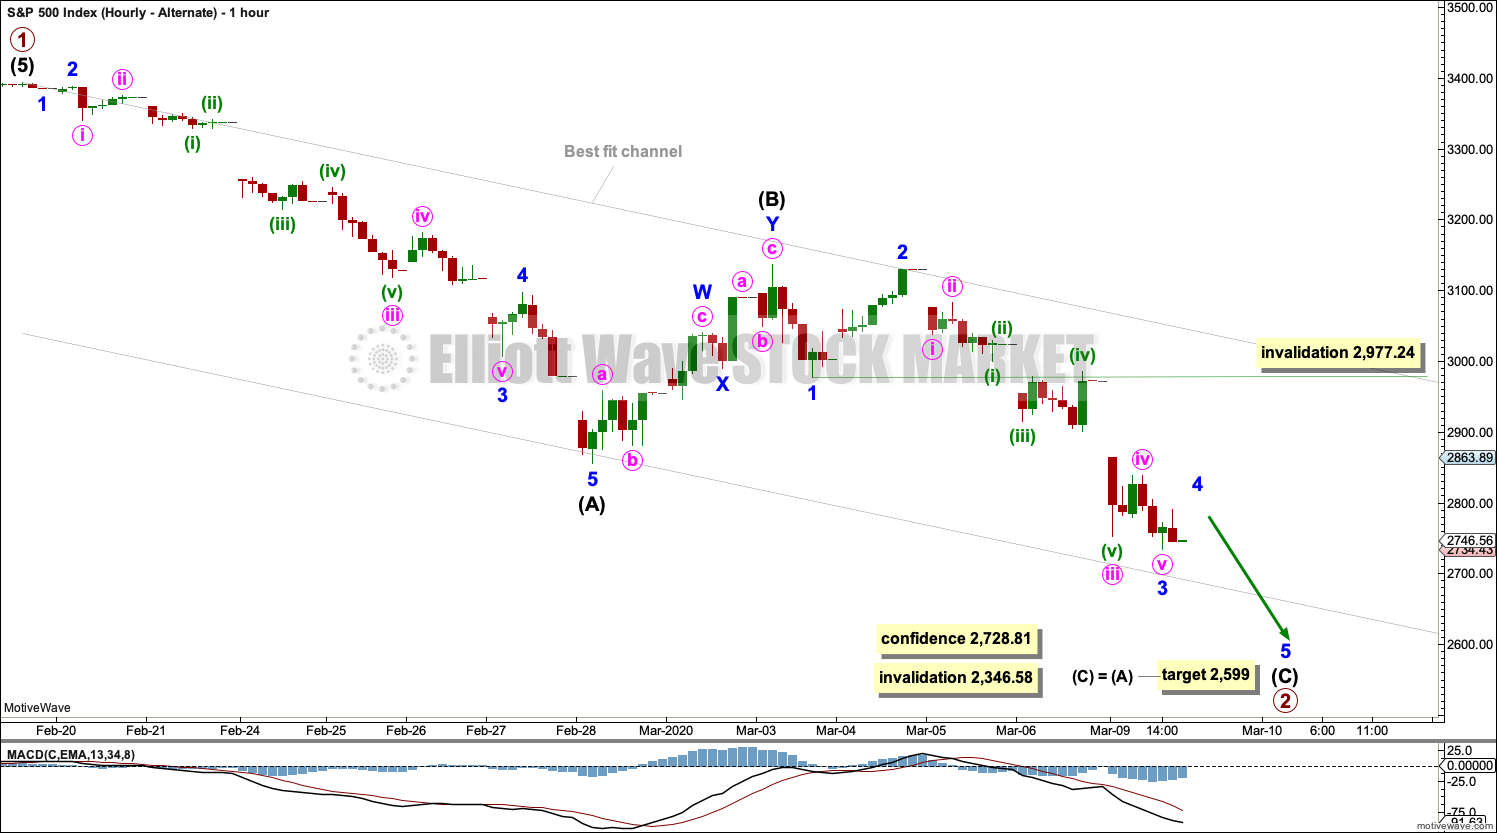
Click chart to enlarge.
Primary wave 2 may be incomplete. A target is calculated that may be a little too low. It would require a small overshoot of the lower edge of the teal channel. The lower edge of the channel may be a better guide to where primary wave 2 may end.
Intermediate wave (C) must subdivide as a five wave structure; it may be an almost complete impulse. Within the impulse, minor wave 4 may not move into minor wave 1 price territory above 2,977.24.
TECHNICAL ANALYSIS
WEEKLY CHART
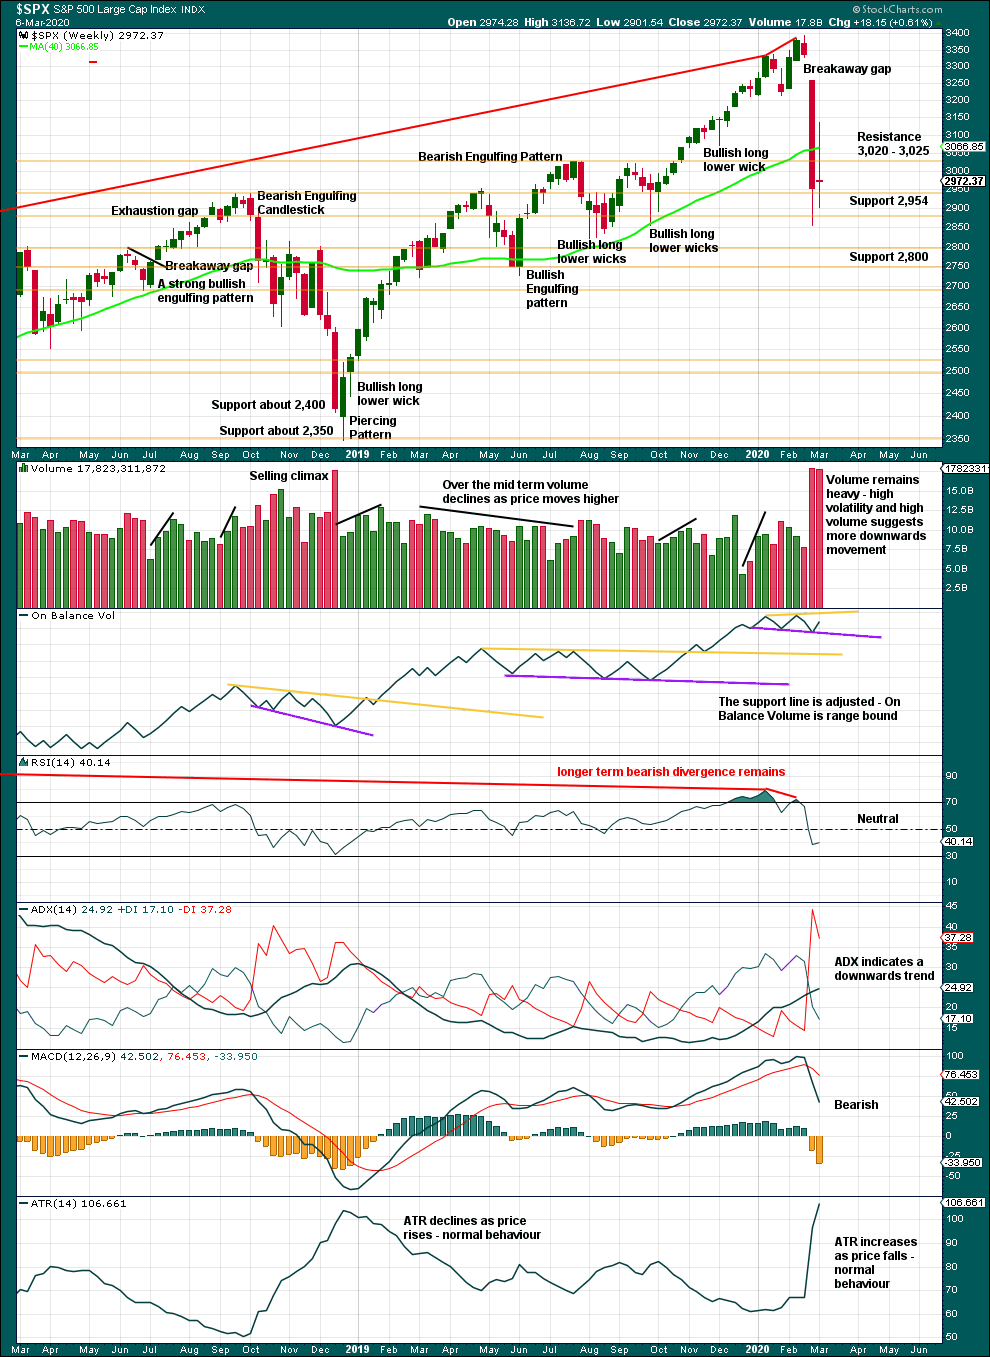
Click chart to enlarge. Chart courtesy of StockCharts.com.
A 19.4% drop in price (high to low) so far has precedent within the larger bull market. It does not necessarily mean the secular bull market must be over.
At the weekly chart level, conditions are not yet oversold; this pullback may be expected to continue further.
A long legged doji last week represents a pause, a balance of bulls and bears. This is not a reversal pattern; doji appear within trends or consolidations.
DAILY CHART
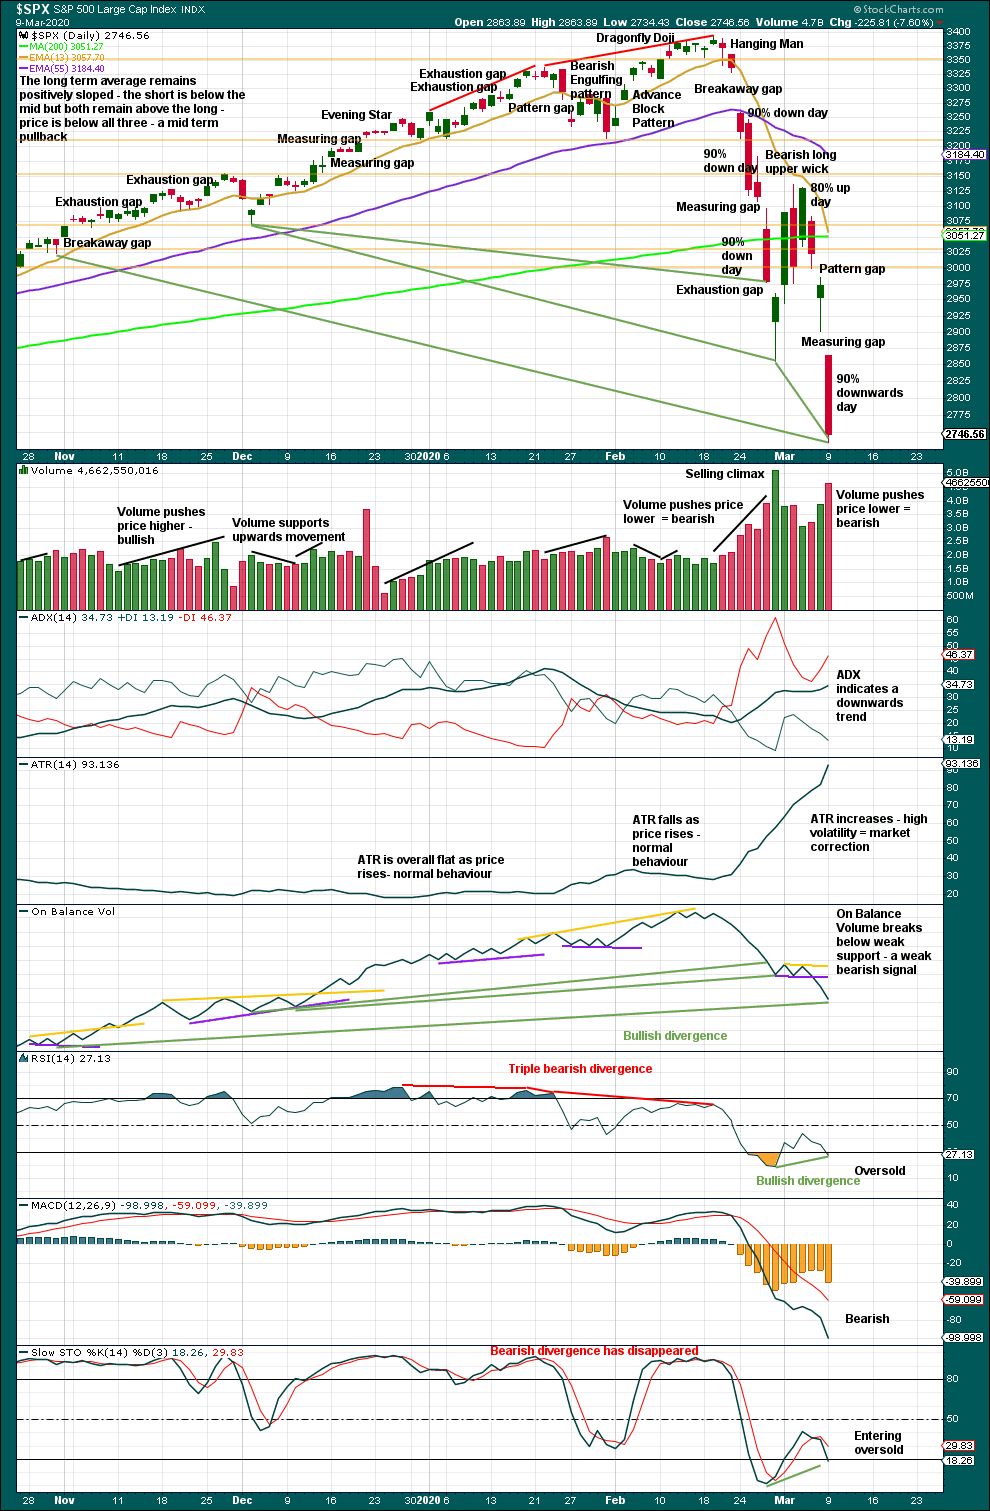
Click chart to enlarge. Chart courtesy of StockCharts.com.
There are now four 90% downwards days in this strong downwards movement.
The following indicators now suggest a low may be in place here or very soon indeed:
– RSI reached deeply oversold and now exhibits short-term bullish divergence with price.
– Stochastics reached oversold and now exhibits short-term bullish divergence with price.
– On Balance Volume continues to exhibit bullish divergence with price.
The following indications will be looked for to provide confidence that a low is in place:
– A 90% upwards day.
– Two back to back 80% upwards days.
– A bullish candlestick reversal pattern.
BREADTH – AD LINE
WEEKLY CHART
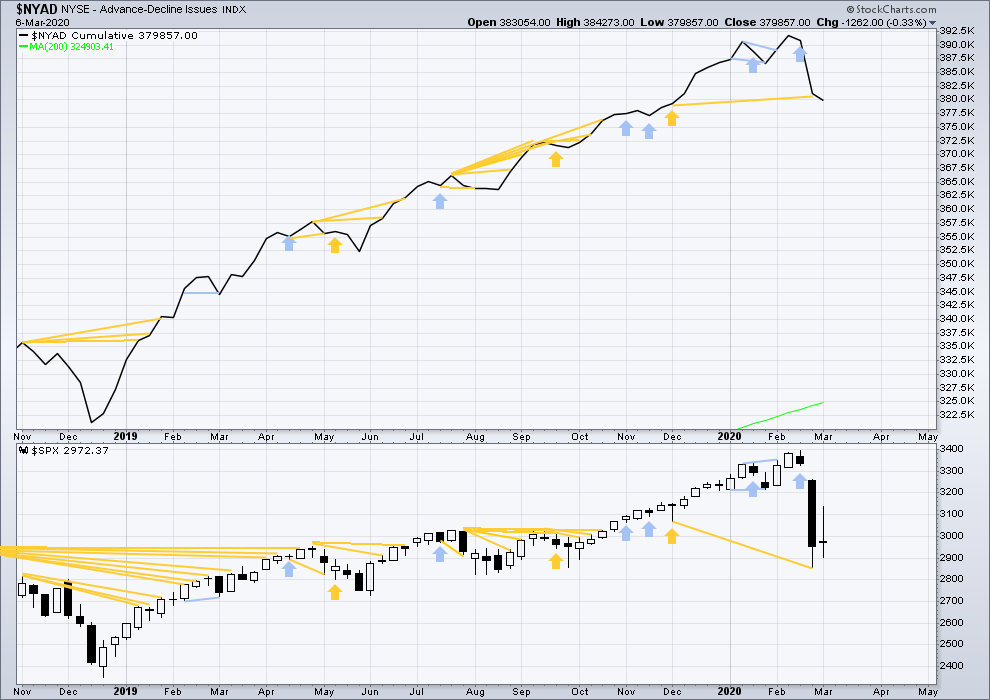
Click chart to enlarge. Chart courtesy of StockCharts.com. So that colour blind members are included, bearish signals
will be noted with blue and bullish signals with yellow.
Bear markets from the Great Depression and onwards have been preceded by an average minimum of 4 months divergence between price and the AD line with only two exceptions in 1946 and 1976. With the AD line making new all time highs with last all time highs from price, the end of this bull market and the start of a new bear market is very likely a minimum of 4 months away, which is mid June 2020.
In all bear markets in the last 90 years there is some positive correlation (0.6022) between the length of bearish divergence and the depth of the following bear market. No to little divergence is correlated with more shallow bear markets. Longer divergence is correlated with deeper bear markets.
If a bear market does develop here, it comes after no bearish divergence. It would therefore more likely be shallow.
Last week price has moved sideways and the AD line has slightly declined. This is very slight bearish divergence.
Large caps all time high: 3,393.52 on 19th February 2020.
Mid caps all time high: 2,109.43 on 20th February 2020.
Small caps all time high: 1,100.58 on 27th August 2018.
DAILY CHART
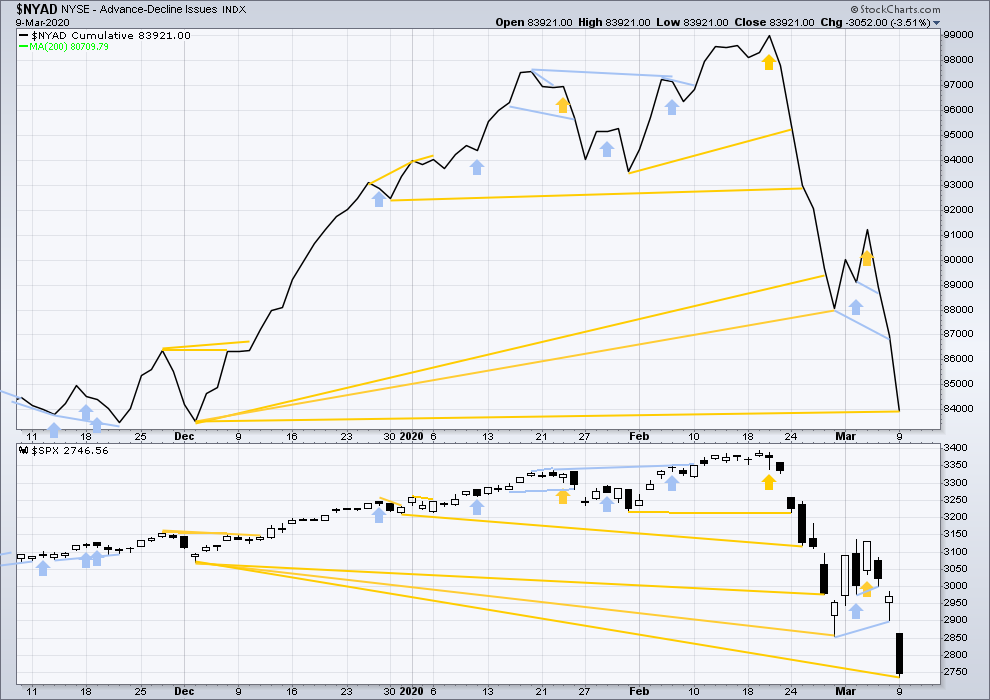
Click chart to enlarge. Chart courtesy of StockCharts.com. So that colour blind members are included, bearish signals
will be noted with blue and bullish signals with yellow.
Breadth should be read as a leading indicator.
Both price and the AD line have moved lower today. Price has made a new low below the prior low of the 3rd of December 2019, but the AD line has not. Price is falling faster than market breadth. This fall in price does not have support from a corresponding decline in breadth. This divergence is bullish and supports the idea that this pullback may end sooner rather than later now.
VOLATILITY – INVERTED VIX CHART
WEEKLY CHART
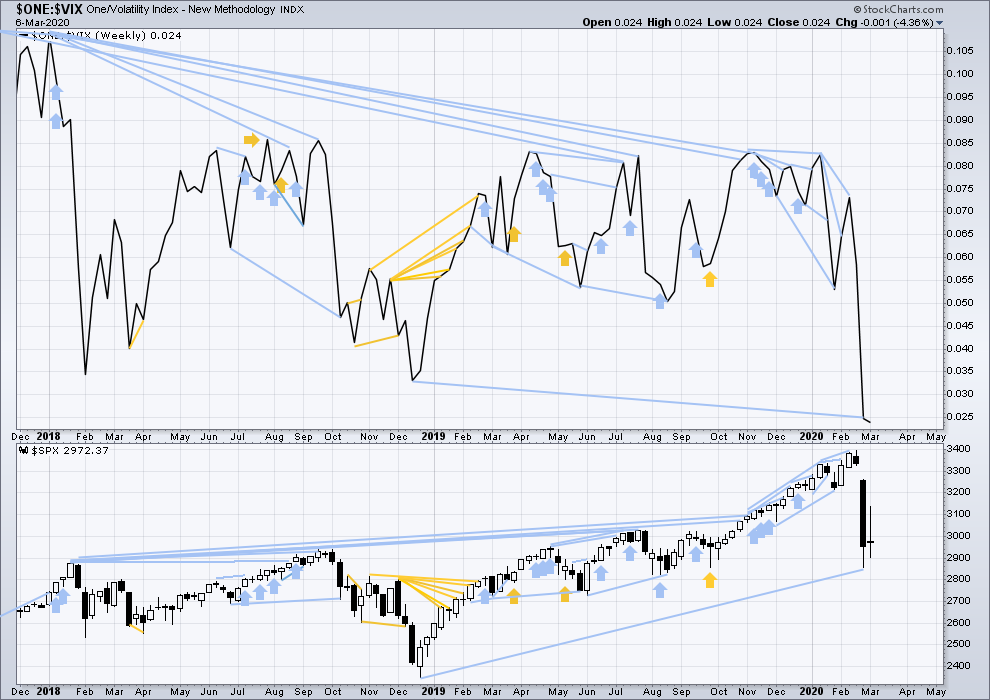
Click chart to enlarge. Chart courtesy of StockCharts.com. So that colour blind members are included, bearish signals
will be noted with blue and bullish signals with yellow.
The all time high for inverted VIX was on 30th October 2017. There is now over two years of bearish divergence between price and inverted VIX.
The rise in price is not coming with a normal corresponding decline in VIX; VIX remains elevated. This long-term divergence is bearish and may yet develop further as the bull market matures.
This divergence may be an early warning, a part of the process of a top developing that may take years. It is clearly not useful in timing a trend change from bull to a fully fledged bear market.
Last week price has moved sideways and inverted VIX has moved slightly lower. This divergence is bearish for the short term.
DAILY CHART
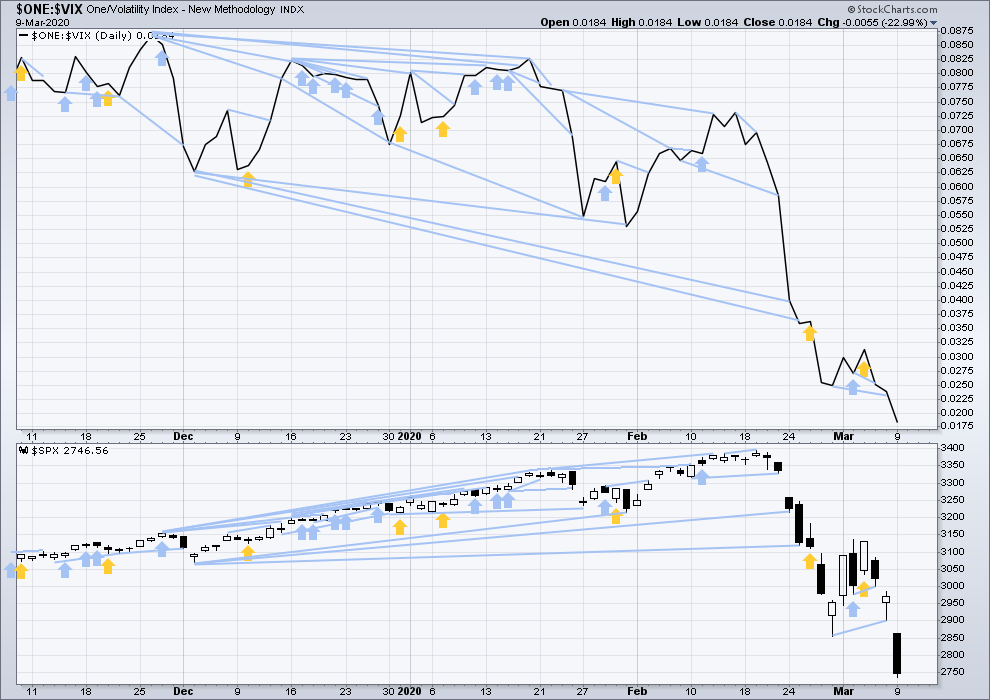
Click chart to enlarge. Chart courtesy of StockCharts.com. So that colour blind members are included, bearish signals
will be noted with blue and bullish signals with yellow.
Both price and inverted VIX have moved lower today. Downwards movement has support from a corresponding normal rise in VIX. There is no short-term divergence.
DOW THEORY
Dow Theory would confirm a bull market if the following highs are made:
DJIA: 26,951.81 – a close above this point has been made on the 3rd of July 2019.
DJT: 11,623.58 – to date DJT has failed to confirm an ongoing bull market.
S&P500: 2,940.91 – a close above this point was made on the 29th of April 2019.
Nasdaq: 8,133.30 – a close above this point was made on the 26th of April 2019.
Dow Theory would confirm a bear market if the following lows are made on a closing basis:
DJIA: 21,712.53
DJT: 8,636.79 – a close below this point has been made on March 9, 2020.
S&P500: 2,346.58
Nasdaq: 7,292.22
Published @ 06:58 p.m. EST.
—
Careful risk management protects your trading account(s).
Follow my two Golden Rules:
1. Always trade with stops.
2. Risk only 1-5% of equity on any one trade.
—
New updates to this analysis are in bold.
Chart of ES if low not in yet. On ES in contrast to SPX the market has gone below the equivalent of 2728.81 at 2757(June basis).
Also on the SPX open gaps at 2631, 2583, 2448 ……. would love to hear some thoughts about filling those…..
Those might be filled later on during recession:)
Good afternoon everybody.
This session looks like its going to close green with a long lower wick which looks very bullish.
SPX over 9-1 advance-decline right now. NYSE a bit over 3-1. Nasdaq actuals: 97-6 right now. Indicates more upward movement this week I’d say.
Lara’s count was right on the money. Stopped right above 2728 and now are back up. So are we going all the way to ATHs now?
So far retraced 61.8 from today’s highs and got stuck on ES. But will it have enough power to break through?
Now much better ZZ proportions on triangle…
If T.A. pattern is some kind of triangle (running?), looks like we are completing e leg so a break one way or the other should be just ahead….
Also, RUT just tagged the level at which the v wave down is the length of the iii wave down, and right on top of key Fibo levels at that. I’m suspicious it’s time for a move up now…but I’m by no means certain!
inverse head and shoulders look in SPX now.
But the weekend gap is just overhead. The battle lines are clear…
A few of you recognize that pattern… 🙂
I agree – they might flush everyone with that “fake” uptrend. We’ll see
Up-trend?
Hard to qualify even as a “fake” methinks…
It is one fine-looking snake… 🙂
Something new I learnt today. “Snake” pattern on an hourly – I can see it too now. However, do snake patterns always predict drop? I remember back in times when bitcoin was at lows last year, there was snake pattern too everyone talked about. After that, bitcoin recovered somewhat.
Enter from above , exit below … 80/20 rule maybe ?
Quite right in that it does not ALWAYS break in the expected direction, but probability is high.
Trigger will be impulsive break below 2719.38
One also does occasionally see a nasty head fake in the wrong direction before a reversal…
Trading the “Cobra Coil” can be fun…and profitable! 🙂
It’s totally posible that the low at 11:30 AM was a truncated 5th wave.
Long with a stop there…
Where do you put stop, Arnaud? Under that low at 11:30?
The main count allows for more drop above 2728, but breaking this morning’s low would require more subdivision of this leg down, and that would feel more than the alternate count.
So I’m long with a stop at 2735-ish holds. In current environment, a 1% clear stop is a good risk reward for me.
and now you have a series of lower-lows, so you can easily more your stops up
I see a nice uptrend channel on hourly /ES which is holding nicely so far. We’ll see if that is going to continue. My first uptrend channel was incorrectly drawn.
Does anyone think a full blow world wide recession, if it were to come, is priced into this market at this point?
I don’t think it’s even close myself…but interested to hear from those with more fundamental knowledge than I (very little). We’ve had these 20% corrections before, without recessions (Q4’18), merely on concerns about rate hikes. Shouldn’t/wouldn’t a REAL recession tank this market far lower?
Not saying a big recession is clearly coming, just asking IF it were to come…does this market go way way down in response as it develops? Or is a recession of significance priced in here? I just heard one pundit argue it IS priced in…I find that very hard to rationalize.
“Just so we are clear: A recession usually leads to a 30% to 40% fall in equities, a big recession usually has a 40% to 60% fall and a depression is 60% to 80%. We haven’t even priced in a recession yet. There is a long way to go.” – Raoul Pal
TY Peter!
John Carter has pointed to the behavior of bonds in 2007. Blow off top…in ADVANCE of (anticipating) the coming recession/bear market. I.e., the bond market here is telling us something significant…
I’ve sold a call spread for Mar 27 in TLT, 177.5/182.5.
Kevin.
I think that’s where the cues if anything a recession would come from. We all know printing since 08 has been nonstop. We can’t continue like this. Margin calls and I mean mortgages and credit cards will be called on.
Personally I don’t see it too far away. I enjoy reading your comments Kevin. Really educating for me at least. Keep it up
Thanks my friend. Gotta fill my free time somehow…3/4’s of trading sitting a round waiting!! And the danger if you don’t is donking off cash.
BTW, I rather like AMD right here and now. It’s got a decent base structure from Monday, which can be reasonably stopped under. A little move up could easily net 10% very quickly, while a stop under Monday’s low would be about -2.5%. And there opportunity for a run up quite a bit higher too. I’ve taken a small initial position and will double above 46.34 (monday’s high).
I don’t think we should be pricing in a full recession yet.
Apple sales fell 60% in China in Feb. Lets assume assume sales fall globally 60% for 4 months straight or 33% of year. Roughly speaking that gets you to (60% x 33%) 20% drop. I’m assuming that’s what the market is pricing, roughly 4 months of shut down then recover.
That’s not taking into account all of the stimulus that’s about to happen. So I like Laura’s main count very much. Although this Primary 4 should give us all concern about what’s about to happen at the end up Primary 5 / End of cycle, which is what I think Kevin if forecasting…the market does not have enough information to currently price that worst-case scenario in IMO
Recession is not priced in as SPX multiple is still at historic average of 16.5x. It just corrected to the mean being above 1 standard deviation historically speaking before. So fundamentally, we have just corrected to the mean (mean reversion). Now, if the earnings start to come more negative than expected (currently at $173 for 2020 SPX), then we would have more downside potential. Market didn’t adjust much of EPS on the downside (it went from $178 before coronavirus to $173 for SPX as of now) – not much of an adjustment yet. Earnings will show what is really happening.
I doubt we will have a recession. Everything is stimulatory at the moment: Very low energy prices (low transportation cost), lowest interest rates ever, and accommodative Fed… I honestly think once this Covid-19 news cycle runs its course (a few more weeks, maybe less), a V-shape stock market rebound is in the cards.
The SPX yield is more than twice the 30 year bond yield!
Ari, I wouldn’t be so certain. Yes, coronavirus in itself is probably not going to cause recession, but it might be the catalyst to start something bad. The reason being is that the system we are in is leveraged up to ears. Any external catalyst that shakes it even a little might cause instability in the system and slowly, but surely all the elements start falling as a domino effect. That’s the danger, not the coronavirus itself. The moment business are not able to pay their obligations even temporarily, all the connected pieces start falling apart. Again, this is just my take on it, but with high leverage there is always an issue. Nothing is free.
Well, I think CV is more than just a news cycle issue. It’s spread rate is going up, not down, and the kind of responses needed to get it under control indicate to me the strong potential for a “shut down” throughout the industrialized world. (BTW…will there even BE a GOP and Dem. conventions in the summer???). And with that, a broad and deep economic slowdown/recession. That’s what the bond market is signalling and what this initial super high momentum sell off from an ATH signals, in my humble view. That said…market action speaks. Today not NOT the strong bounce many expected, and is consistent with yesterday NOT being a climactic bottom. It looks like weak corrective upward action to me so far. I expect more up…but then I expected more up on Monday after Friday’s action, oops!!!! Lol. Humility is key; it’s not about being right, it’s about finding ways to make some money, whatever happens.
I’m definitely not certain. About anything honestly… just my 2 cents.
You’re completely right about the leverage problem, and most of it is entangled with Deutsche Bank. Many many financial institutions are tied to DB with their many leveraged products, and if DB goes under, then mayhem will pursue for sure… But its not time for that just yet 🙂
There is an increase of the perceived likelihood of a recession in 2020, based on data from this article:
https://qz.com/1815176/will-coronavirus-cause-a-us-recession-in-2020/
Y-axis is the % of respondents, and X-axis is the probability of a recession in 2020.
In January, 75% of respondents believed the probability of having a recession in 2020 was under 20%.
In March, 65% of respondents now believe the probability is above 30% (and 25% think it’s above 50%).
In all, this is a very large increase of the eperceived probability.
Thanks Lara
Great that you’re having an excellent time, and well deserved.
I’m just waiting for the low to form to go long, agree with the 2599 area, i have it going to the 2593 level, so i’ll look to see about scaling in at those levels/zone.
Enjoy your day
Thanks dewpoint.
Let’s see how this session closes… it looks like it’s going to be green. If it’s an 80% or a 90% up day that would be very bullish.
Could we possibly be in nested first and second waves…?
This is not the way VIX typically behaves at market bottoms….
My hot cakes would agree with you ..
Round number surrendered. Gap at 2789.30 next test….
The very low relative volume yesterday (compare it to 2/28 volume) doesn’t strongly suggest yesterday was a concluding low to me. No climax selling. Today’s upward action seems large and it is…but not relative to the action over the last three weeks. A relatively narrow range inside day, so far. Looking more like a gap and fill day than a gap and go day. The weekend gap isn’t even being tested yet, much less filled.
Also remember the propensity of markets to exhibit “three drives to a low” behavior; we’ve only see two drives so far.
BTW, RUT is clearly in bear market territory (though I find the 20% “bear market” definition rather arbitrary).
The data I see so far indicates to me this is a corrective move upward. So far.
Market looks to be printing yet another daily candle with a sizeable wick.
Buyers facing lots of selling pressure and imho this shows market weakness.
The arbitier of this contest will be VIX.
A green print today would suggest more downside ahead….
Can they hold the 2800 round number?
During the long bull run I noticed someting quite fascinating, and so did a lot of other traders. There were numerous instances where what used to be fairly reliable bearish reversal signals were violently negated as the bull run higher continued relentlessly.
It was truly amazing to see it happening repeatedly. The instances were many – long wicks, dojis. spinning tops, island reversals, bearish engulfing candles among others.
I had never seen anything quite like it.
While it is not clear to me how CB intervention in markets correlate with EW theory; that they do intervene is so far as I am concerned incontestable. I guess the question would be whether the fundamental tenet of EW theory, that price is fundamentally herd derived, could be interpreted to include the banksters. The persistent low volume on the long way up in my view also raises some interesting questions about true herd sentiment, vs liqudity driven outcomes so far as price action goes.
I am beginning to wonder if we just might see the same kind of reversal signal negation in a market down-trend. I have been seeing a few instances lately of what initially looked like a reversal point in the market getting run over by more downside price action. Two such instances were intra-day long candle tails, and last Friday posistive divergence at the lows with a violent down-draft on Monday as we all saw.
Food for thought…!
Where can we see if stocks had a 90% up day? Is there a site that shows the percentage of stocks that were up vs down? Thanks.
It’s not
What’s not?
it’s nowhere close to a 90% up day.
Thinkorswim shows the ratios under “marketwatch”, “index watch”, and select the index of your choice. NYSE right now at 1361 to 1571 (advance to decline).
Re loaded the spy puts at open …. good luck
Very dangerous for long puts today – we clearly broke the downtrend channel and just retested it from the top and are coming up now. We are in the uptrend channel now. I’m not saying that it’s a new major trend up now but we are definitely over the previous downtrend.
VIX hinting that the danger may well be on the bullish side…
Not sure if going short is a bad idea here. Market reversals (either lows or highs) typically don’t happen during overnight sessions… at the very least we need to retest the lows yesterday. Whether it comes this week or in 2-4 months? That’s the big question…
You guys are right. I have to take my words back – they tricked me – they reversed and went back down to downtrend channel. That was probably a head fake
not saying the retest is not a good idea to go long (specially if its happening during daytime hours, which is where we’re heading now), it may very well be, but anytime you have a 3% up or down session during night time, its very likely that it’ll fizzle out… and retest of highs or lows is in the cards…
The force is strong in this trend
Crazy strong.
ES broke 2728.75 (the June 2019 low on the front-month contract) by 1%, so the ending-diagonal count is not valid on the ES anymore. It remains valid on the SPX.
The main counts are for the cash and the future (since the low of December 2018):
SPX: in a wave 4 of an ending-diagonal, when this wave finishes (it may have finished yesterday at the close), we are expecting a wave 5 to new high, wave 5 to have an ABC structure.
ES: the high of February 2020 was the end of 1 of V. We may have finished 2 yesterday (overnight just after the close), and we are expecting waves 345 to new high.
The main count is expecting bull market resumption, ABC on the cash, 345 on the ES.
Since it’s 345 on the ES:
1) wave 4 will not enter wave 1, so that will give maximum retracement levels for the corresponding B on the SPX
2) because of the upside limit of the main count on the SPX, wave 3 of the ES will be shorter than wave 1, and wave 5 will be shorter than wave 3. That will give us likely target indications for A and C of SPX.
ES low in June was 2670ish something, so ES has not taken out it’s low yet, same as SPX..
But DJI has..
I stand by my post. The level you indicate is incorrect.
Sorry yes u r right.
I also agree with you that it was Feb-2020 high was 1 (3 waves) of V, and we either finished or are in 2 (3 waves) of V
But expecting cycle V to be the Ending Diagonal (mostly Contracting), so we have 3 4 & 5 (all in 3 waves) left of V… if it will be contracting each wave should take less time and create a wedge….
So not expecting the action for few months to be clean… either it will be up (with shallow pullbacks) or down (with shallow pullbacks) as we had in last 1 year or soo
RTY limit up.. wow limit down then next day limit up… it is historical times
We have broken the hourly downtrend channel too on the upside. So far it plays out exactly as Lara;s count shows.
But we have also stopped at 61.8 retracement from the previous swing high and 38.2 from the previous high of this downtrend. Will it keep breaking those on the upside?
Sure but looking at other indices and their count, like RUT, DJI etc
I would be more willing to count it as below
1) Cycle V is finishing as Ending Diagonal
2) the move from 2018 low to the ATH was just primary 1 in 3 waves, we completed (or continuing) Primary 2 in 3 waves…
3) so another P3 up in 3 waves (should take
Months), another severe drop in 3 waves of P4, then final wave P5 in 3 waves…
It could be contracting diagonal, so each waves will get smaller in a wedge… I would expect P3 to finish before summer then quick P4 & smallest P5
ES has broken the equivalent of SPX 2728.81 at below 2757 (basis June ES).
Can’t see SPX holding 2728.81 as, even though they are different markets, the count on ES would be too far off to make the whole thing viable.
Then next step is to hold 2346.58 on SPX and if so, we’re off to the races.
I sure you meant hold 2746. Sideways and up per Lara’s mode seems right here. It’s nature (impulsive trend day up vs. more sideways with wide swings) will be extremely informative!
But ANY overnight session could bring another 100 point drop.
Trend in my hierarchy of significance to my outlook is #1. Over Elliott wave. Over everything.
The current trend down is one of (possibly THE) strongest in history. Until I see this trend change…the trend remains, and the upward movement I will presume to be a correction before the next impulse down. If this thesis plays out, we would see “3 of 3” type action, of extreme price movement and momentum. My goal is to have some size on if that happens. It’s a very uncommon set up with very large profit potential, for me, not to be missed or screwed up, frankly.
I might (might) day trade long tomorrow if it really looks like a trend day up; I’ll keep it simple and a bit lower risk by just using UPRO though (vastly reduced cost vs use of options due way less to spread and commissions). But my more critical focus will be on properly building short options/option spread positions with minimal risk. And making sure I have some kind of position on for the next massive overnight price move down.
No I did mean 2346. If, as I expect, 2728.81 on SPX doesn’t hold because, I agree, the trend is down until proven otherwise, then it means we’re in the Alternate Count being Primary 2 of Cycle V which can’t go below the invalidation point at the start of primary 1 at 2346.58.
So we may still have a fair way to go down before that point.
Thank for clarifying. Makes sense.
Gap and FILL day? This “should” be a gap and go day to strongly support the bullish thesis. I see RUT is particularly weak (again).
Since 2018 low, RUT and DOW Transport was way disconnected compared to others. RUT has always been in flat correction and now it is close from over or it is already complete as i can count 5 ways down for C. If i can take RUT as a clue, i am going to go with Lara’s count that bottom is here. Hindsight, Everything makes sense and i should have paid a little bit more attention to RUT a month back. SPX uptrend since 2018 low looked like a forced count for me always especially the mid portion which looked corrective to me resulting in a 3 wave up. Good Luck everyone…
I’m in Boquette, Panama for a few days. It’s a really beautiful country.
If the lower edge of that teal channel is again going to be where price finds support then the pullback may end in another one to very few days, it may end this week.
If we see a 90% up day tomorrow I would fairly confidently call for a sustainable low.
Let’s see what happens.
Remember, lows in this market can be events while highs can be processes. The S&P fairly often forms sharp V bottoms.
Thank you for this. It can be challenging during the day when the market is volatile and subscribers are posting many different thoughts on the prevailing news, where the market might be heading and their own trades. It helps to have your guidance to know whether we should be sticking to what was said in the last update or if things have changed.
Lara, can you characterize what would elevate the bear market potential to being an alternate (“enough evidence”), and after that, what developments would elevate it to the primary count? I presume a breach of the bull market lower channel line is key (particularly a full daily bar below). What else would build the case? Thanks.
A breach of the teal channel and then a new low below 2,346.58.
If that happens then a big bear market would be the only wave count.
I would move the degree of labelling of primary 1 on the alternate up one degree, and label cycle v over.
TY!
First!
Second
Fashionably late.
Does that mean, “Turd(y)”? 🙂