
With price now above the upper edge of a multi-year channel, it is time to review monthly charts.
Summary: The next target is at 3,332 and thereafter 3,379.
It is again possible that minor wave 3 could be over. Some confidence in this view may be had with a new low below 3,298.66 and then a breach of the narrow orange channel on the alternate hourly chart. The risk of a larger pullback or consolidation beginning here or very soon is now high.
Three large pullbacks or consolidations (fourth waves) during the next 1-2 years are expected: for minor wave 4 (coming soon, possibly just begun), then intermediate (4), and then primary 4.
The biggest picture, Grand Super Cycle analysis, is here.
ELLIOTT WAVE COUNTS
FIRST WAVE COUNT
MONTHLY CHART
Click chart to enlarge.
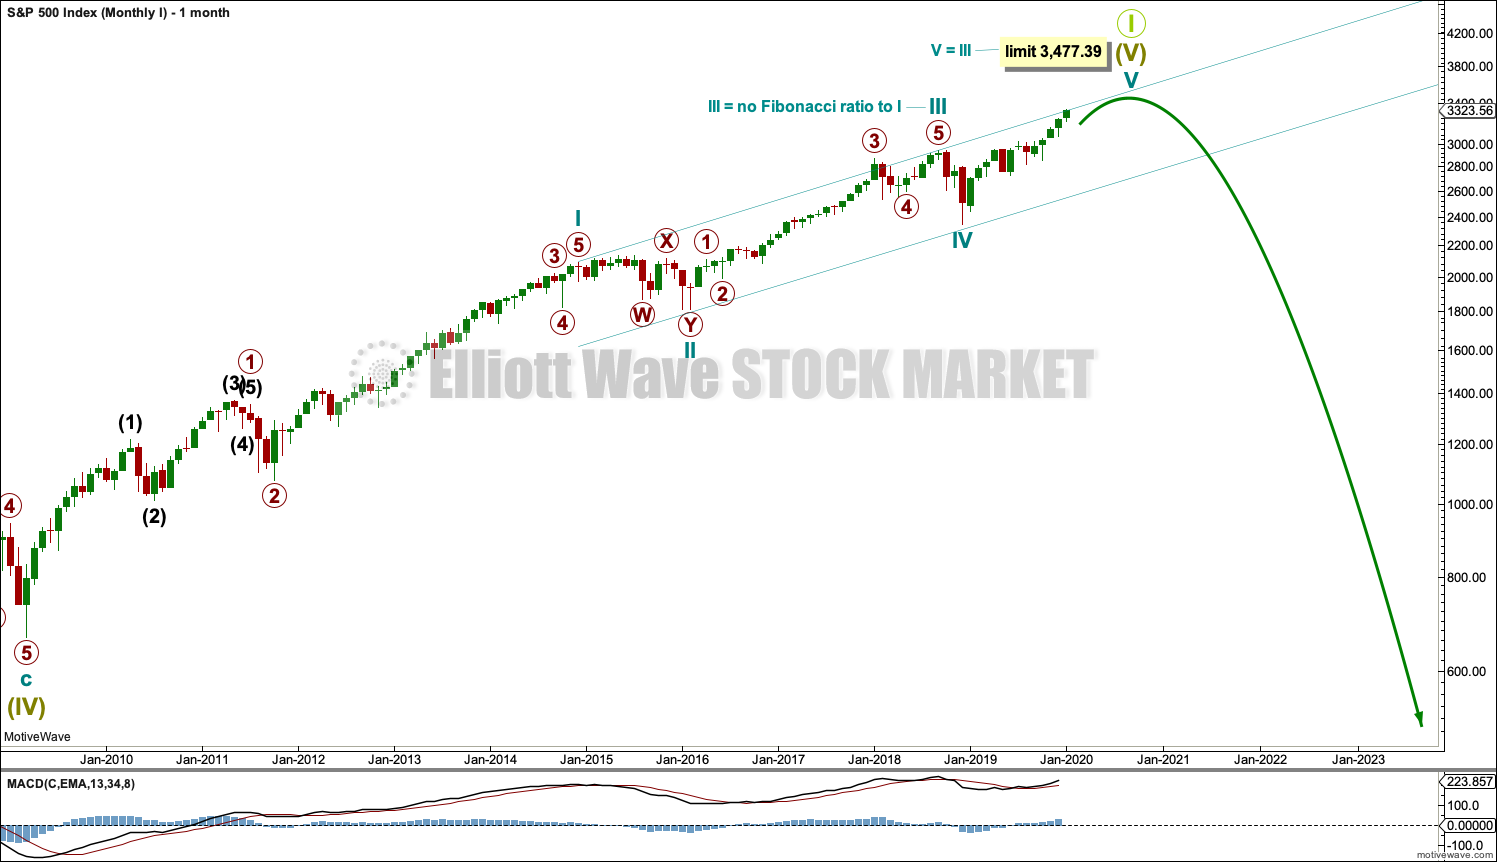
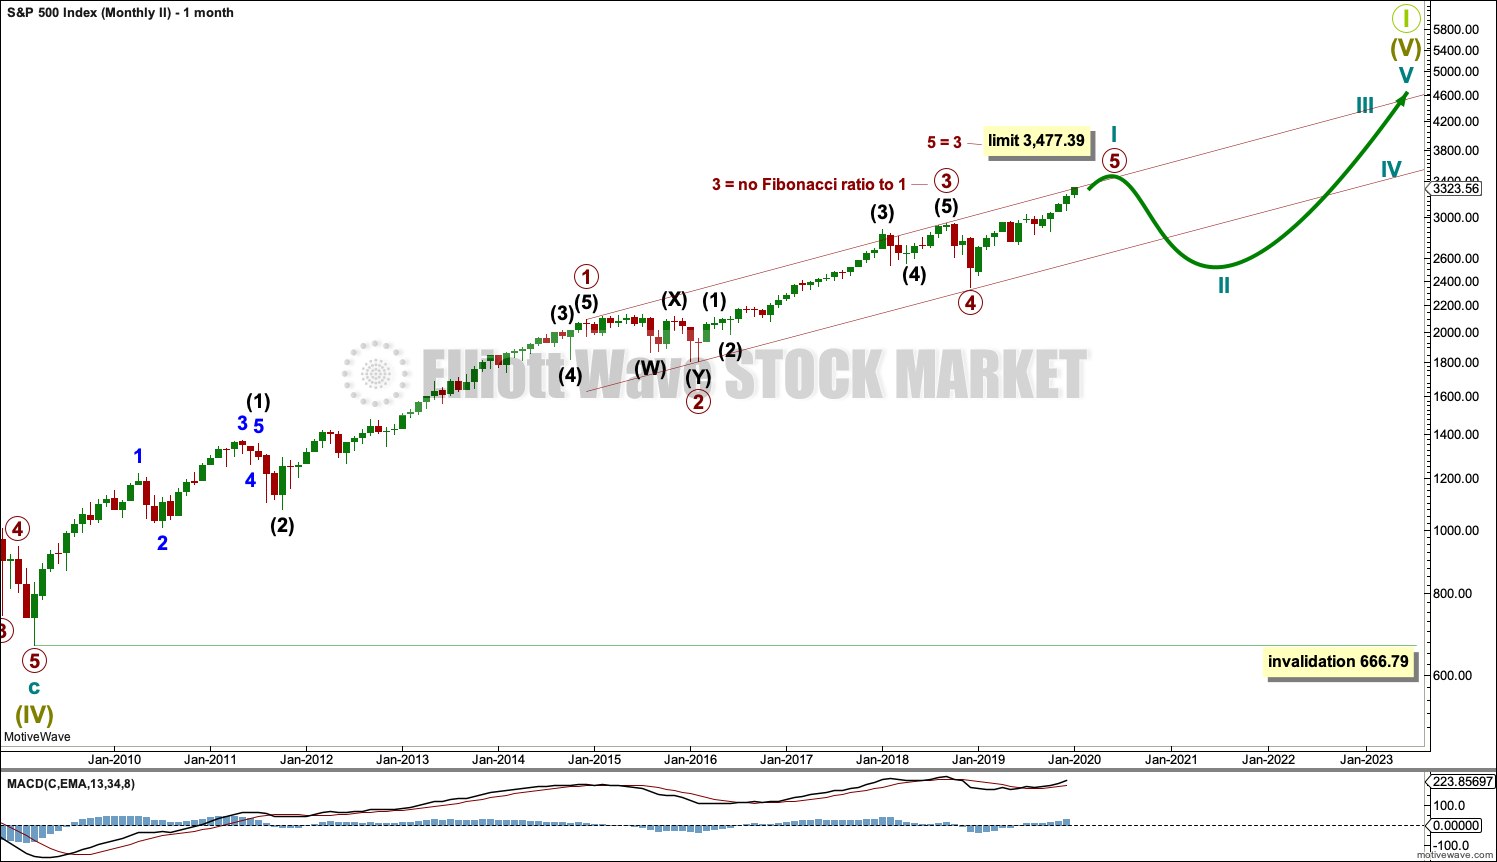
Super Cycle wave (IV) completed a 8.5 year correction. Thereafter, a bull market began for Super Cycle wave (V). The structure of Super Cycle wave (V) is incomplete. It is subdividing as an impulse.
A channel is drawn about the impulse of Super Cycle wave (V) using Elliott’s first technique. Draw this channel first from the high of 2,079.46 on the 5th of December 2014 to the high of 2,940.91 on the 21st of September 2018, then place a parallel copy on the low at 1,810.10 on the 11th of February 2016. Cycle wave IV found support about the lower edge.
There is perfect alternation between a shallow time consuming combination for cycle wave II and a deeper and more brief double zigzag for cycle wave IV. The speed and depth of cycle wave IV makes these two corrections look like they should be labelled the same degree. This wave count has the right look.
The middle of the third wave overshoots the upper edge of the Elliott channel drawn about this impulse. All remaining movement is contained within the channel. This has a typical look.
Within cycle wave V, no second wave correction may move beyond the start of its first wave below 2,346.58.
This wave count expects MACD to begin to exhibit divergence with price as price makes new highs. Cycle wave III may exhibit strongest momentum and cycle wave V may exhibit some weakness. Price is making new highs, but MACD has not. This remains the main wave count.
Within Super Cycle wave (V), cycle wave III may not be the shortest actionary wave. Because cycle wave III is shorter than cycle wave I, this limits cycle wave V to no longer than equality in length with cycle wave III at 3,477.39. A new high by any amount at any time frame above this point would invalidate this main wave count in favour of one of the two alternates below.
This wave count agrees with MACD. Cycle wave III exhibits strongest momentum, and primary wave 3 within cycle wave III exhibits the strongest histogram within MACD.
WEEKLY CHART
Click chart to enlarge.
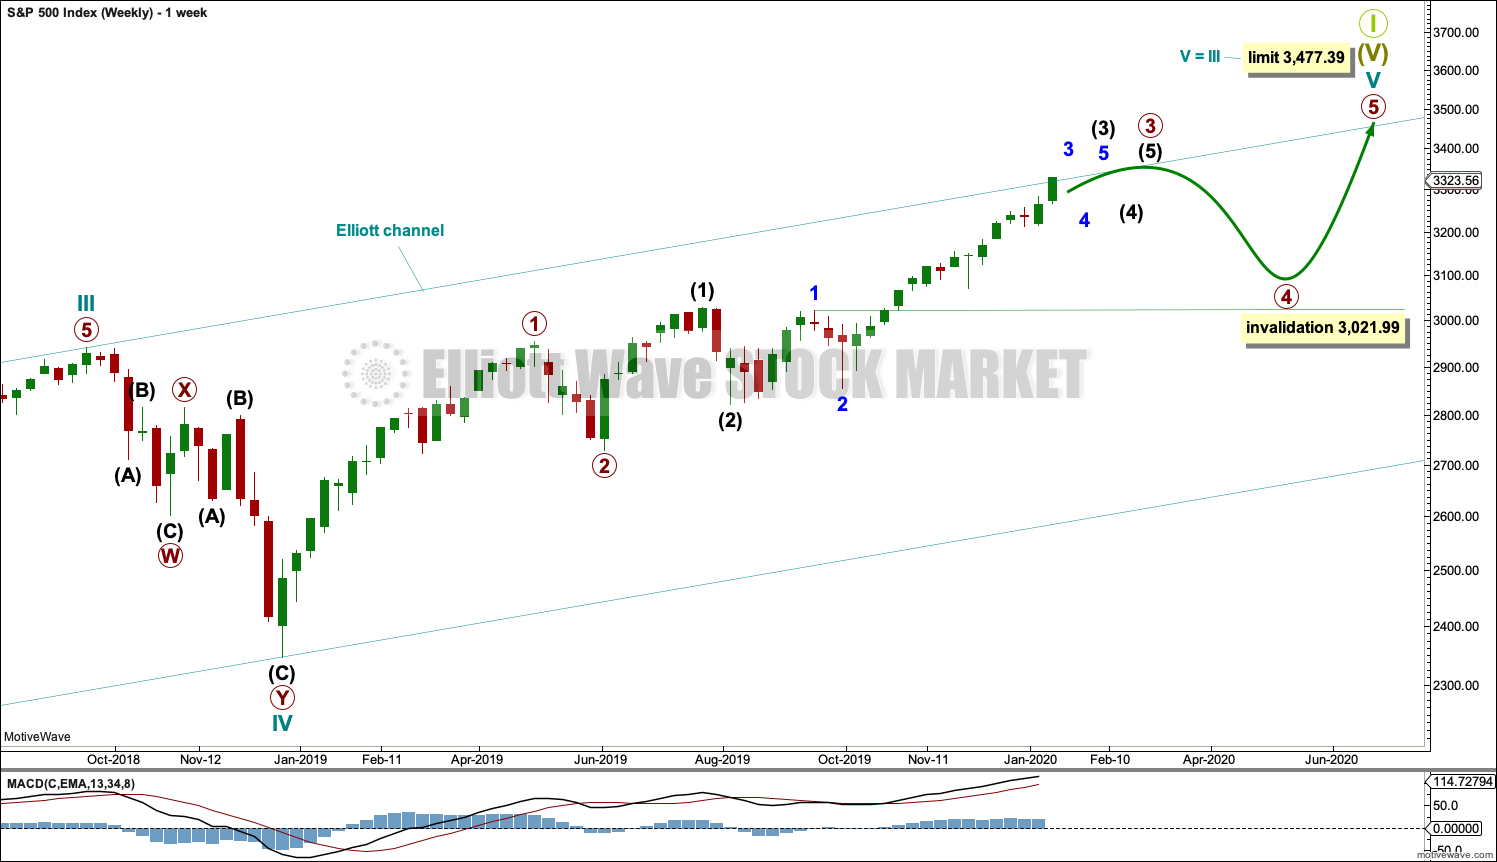
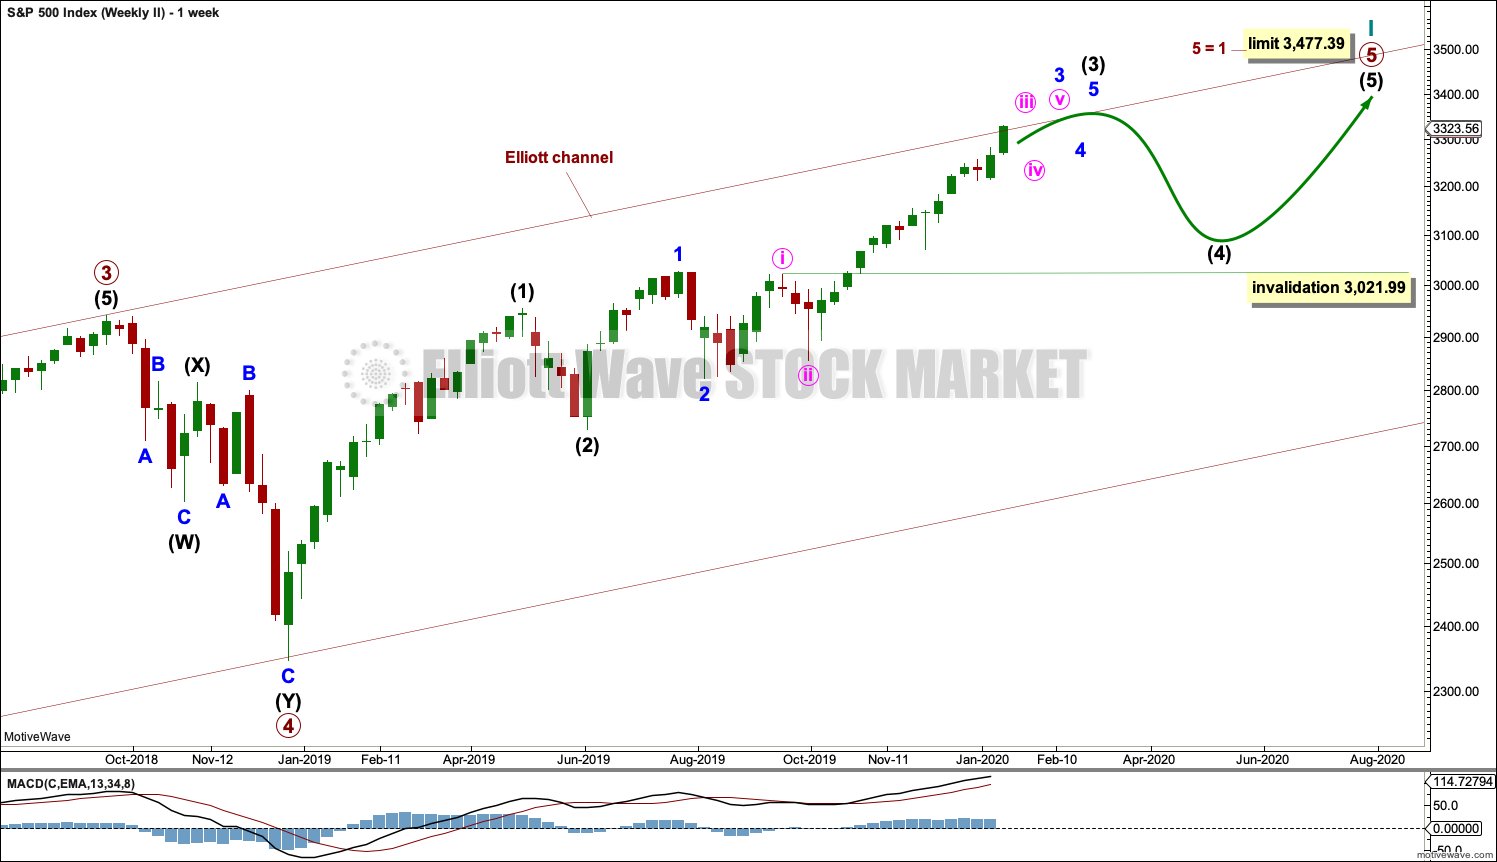
Cycle wave V may subdivide either as an impulse or an ending diagonal. Impulses are much more common, and it is clear at this stage that cycle wave V is an impulse and not a diagonal.
At this stage, cycle wave V may take another one to two or so years to complete.
The daily chart below will focus on movement from the end of intermediate wave (2) within primary wave 3.
Within cycle wave V, primary waves 1 and 2 may be complete. Within primary wave 3, intermediate waves (1) and (2) may be complete. Within the middle of intermediate wave (3), minor wave 4 may not move into minor wave 1 price territory below 3,021.99.
Within cycle wave V, the corrections of primary wave 2, intermediate wave (2) and minor wave 2 all show up clearly on the weekly chart. For cycle wave V to have the right look, the corresponding corrections of minor wave 4, intermediate wave (4) and primary wave 4 should also show up on the weekly chart. Three more large multi-week corrections are needed as cycle wave V continues higher, and for this wave count the whole structure must complete at or before 3,477.39.
DAILY CHART
Click chart to enlarge.
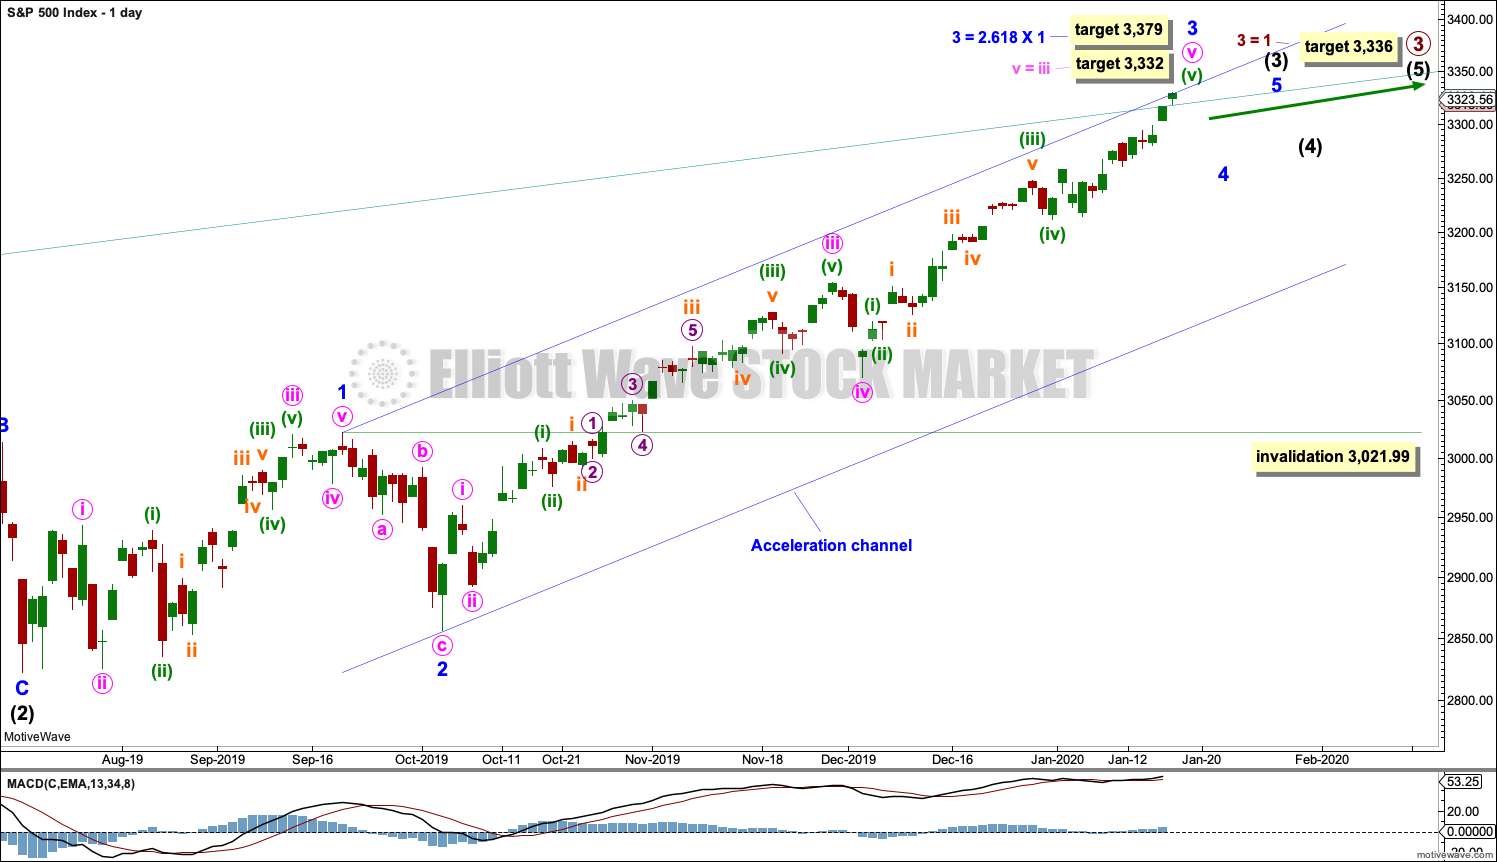
All of primary wave 3, intermediate wave (3) and minor wave 3 may only subdivide as impulses.
Minor wave 3 has passed 1.618 the length of minor wave 1, and within it minute wave v has passed equality in length with minute wave i. The next possible target for minor wave 3 may be at 3,332 where minute wave v would reach equality in length with minute wave iii.
If price reaches up to this next target and either the structure is incomplete or price keeps rising, then a next higher target may be at 3,379 where minor wave 3 would reach 2.618 the length of minor wave 1. This would require the target for primary wave 3 to also be recalculated.
When minor waves 3 and 4 may be complete, then a target will again be calculated for intermediate wave (3).
Minor wave 2 was a sharp deep pullback, so minor wave 4 may be expected to be a very shallow sideways consolidation to exhibit alternation. Minor wave 2 lasted 2 weeks. Minor wave 4 may be about the same duration, or it may be a longer lasting consolidation. Minor wave 4 may end within the price territory of the fourth wave of one lesser degree; minute wave iv has its range from 3,154.26 to 3,070.49. However, this target zone at this stage looks to be too low.
Minor wave 4 may not move into minor wave 1 price territory below 3,021.99.
Intermediate wave (3) has now moved far enough above the end of intermediate wave (1) to allow intermediate wave (4) to unfold and remain above intermediate wave (1) price territory.
Draw an acceleration channel now about intermediate wave (3): draw the first trend line from the end of minor wave 1 to the last high, then place a parallel copy on the end of minor wave 2. Keep redrawing the channel as price makes new highs. Minor wave 4 may find support at the lower edge of this channel if it is long lasting or deep enough.
Price is now above the upper edge of the wide teal channel copied over from monthly and weekly charts. A reaction downwards soon would be a reasonable expectation, but now that price has moved above the channel it may still continue higher for some time as a blow off top forms.
HOURLY CHART
Click chart to enlarge.
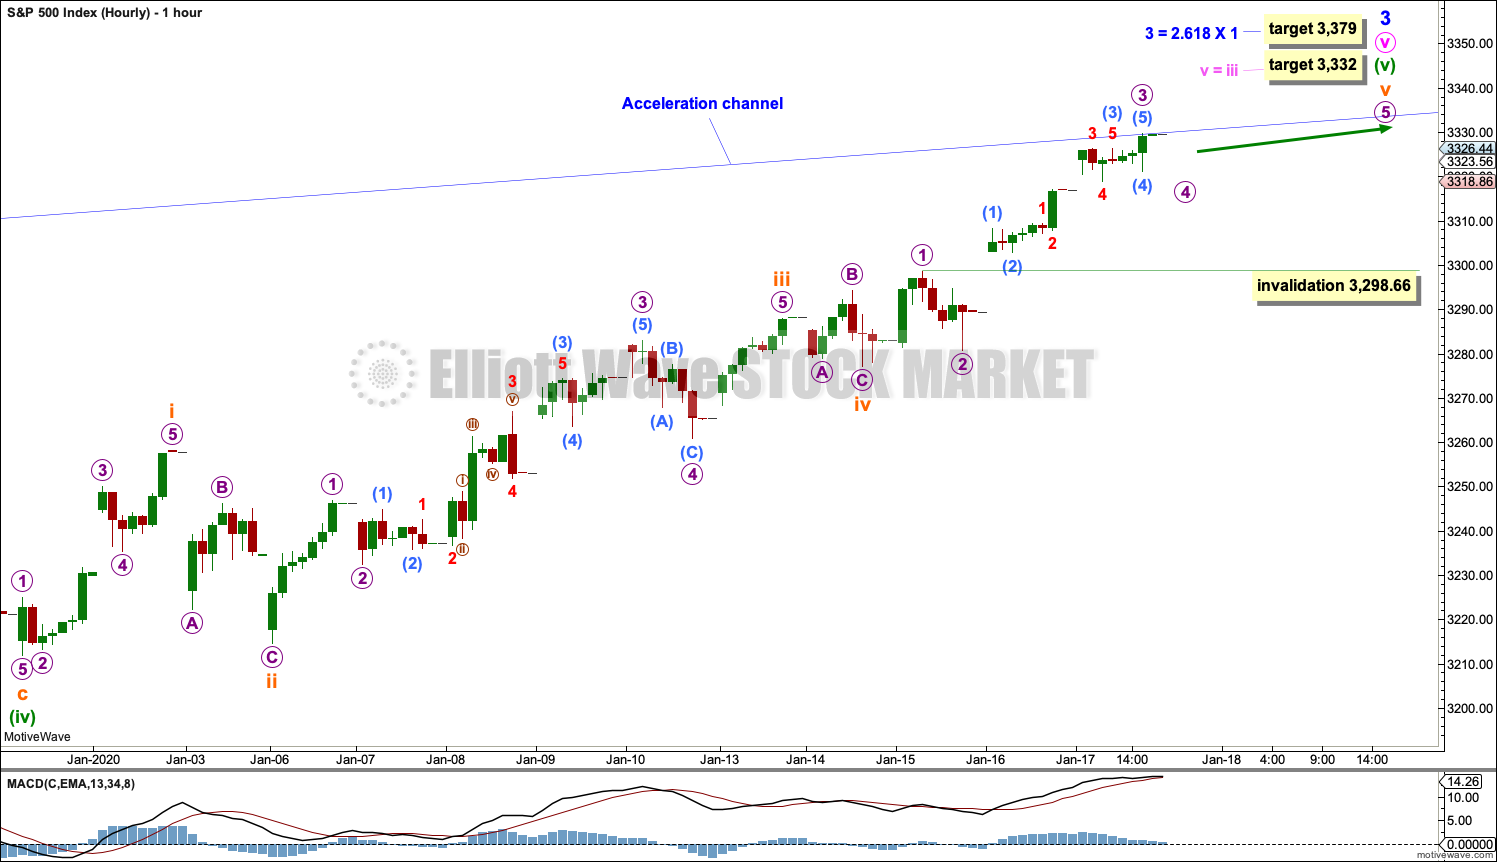
It is possible that minor wave 3 may be close to completion.
Subminuette wave v may be almost complete. Within subminuette wave v, micro wave 4 may not move into micro wave 1 price territory below 3,298.66.
ALTERNATE HOURLY CHART
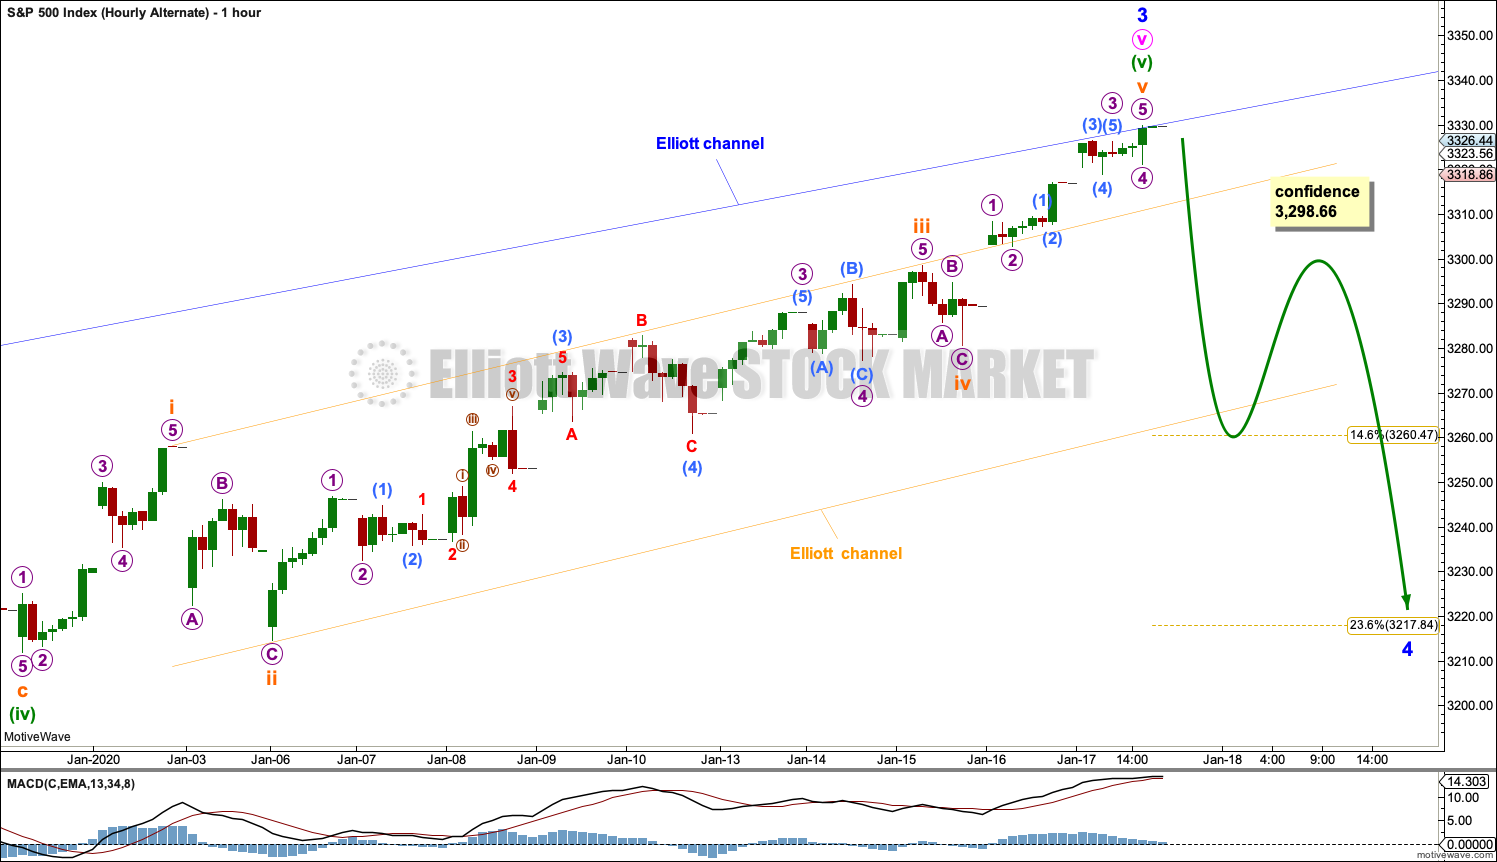
Click chart to enlarge.
If price breaks below 3,298.66, then assume minor wave 4 has arrived. At that stage, this alternate wave count would increase in probability, but would still not be a certainty.
A breach of the narrow orange channel, which is now drawn about minuette wave (v), would add reasonable confidence that minor wave 4 has arrived.
A correction to last about two weeks should begin with a five down on the hourly chart.
With price closing almost at the high for this session, no upper invalidation point can be set today for this alternate.
Minor wave 4 may end within the price territory of the fourth wave of one lesser degree. Minute wave iv has its range from 3,154.26 to 3,070.49. Within this range is the 0.382 Fibonacci ratio of minor wave 3 at 3,148.68. If this target range is wrong, then it may be too low.
SECOND WAVE COUNT
MONTHLY CHART
Click chart to enlarge.
This monthly chart sees all subdivisions from the end of the March 2009 low in almost the same way, with the sole difference being the degree of labelling.
If the degree of labelling for the entirety of this bull market is all moved down one degree, then only a first wave at cycle degree may be nearing an end.
When cycle wave I is complete, then cycle wave II should meet the technical definition of a bear market as it should retrace more than 20% of cycle wave I, but it may end about either the 0.382 or 0.618 Fibonacci Ratios of cycle wave I. Cycle wave II may end close to the low of primary wave II within cycle wave I, which is at 1,810.10. It is also possible that cycle wave II could be fairly shallow and only barely meet the definition of a bear market.
Thereafter, a new bull market for cycle wave III may begin. It should have support from volume and fundamentals.
The end of Grand Super Cycle wave I may be about 10 years or so away.
WEEKLY CHART
Click chart to enlarge.
The impulse is still viewed as nearing an end; a fifth wave is still seen as needing to complete higher. This wave count labels it primary wave 5. Primary wave 5 may still need another year to two or so to complete, depending upon how time consuming the corrections within it may be.
Primary wave 5 may be subdividing as an impulse, in the same way that cycle wave V is seen for the first weekly chart.
ALTERNATE WAVE COUNT I
MONTHLY CHART
Click chart to enlarge.
If the degree of labelling is moved down within cycle wave III, then it is possible that the last high was only primary wave 1. Cycle wave III may be extending.
Only two actionary waves within an impulse may extend. Cycle wave I was extended. If cycle wave III also extends, then cycle wave V may not extend.
A target is calculated for cycle wave III to end. If price gets up to this target and the structure is incomplete, or if price keeps rising through the target, then a new higher target would then be calculated.
Within cycle wave III, primary wave 4 may not move into primary wave 1 price territory below 2,913.98.
This wave count expects MACD to indicate stronger momentum as price makes a new all time high. If that happens, then this may be switched to be the main wave count.
The channel drawn here is an acceleration channel. The channel should be redrawn as price makes new highs. When cycle wave III may be complete, then this channel would be an Elliott channel and may show where cycle wave IV may find support.
This wave count has no limit on upwards movement.
ALTERNATE WAVE COUNT II
MONTHLY CHART
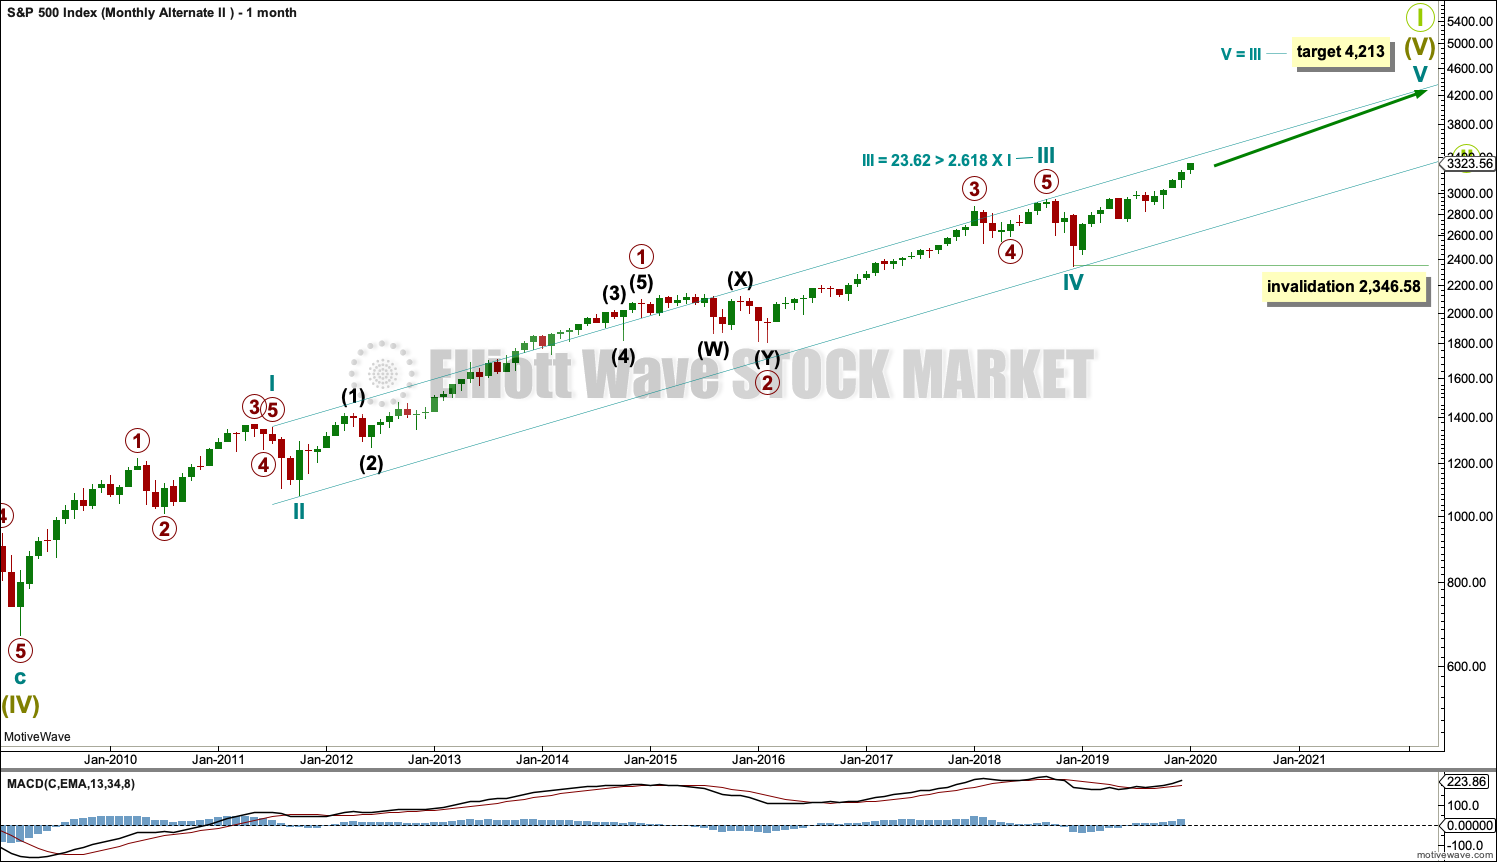
Click chart to enlarge.
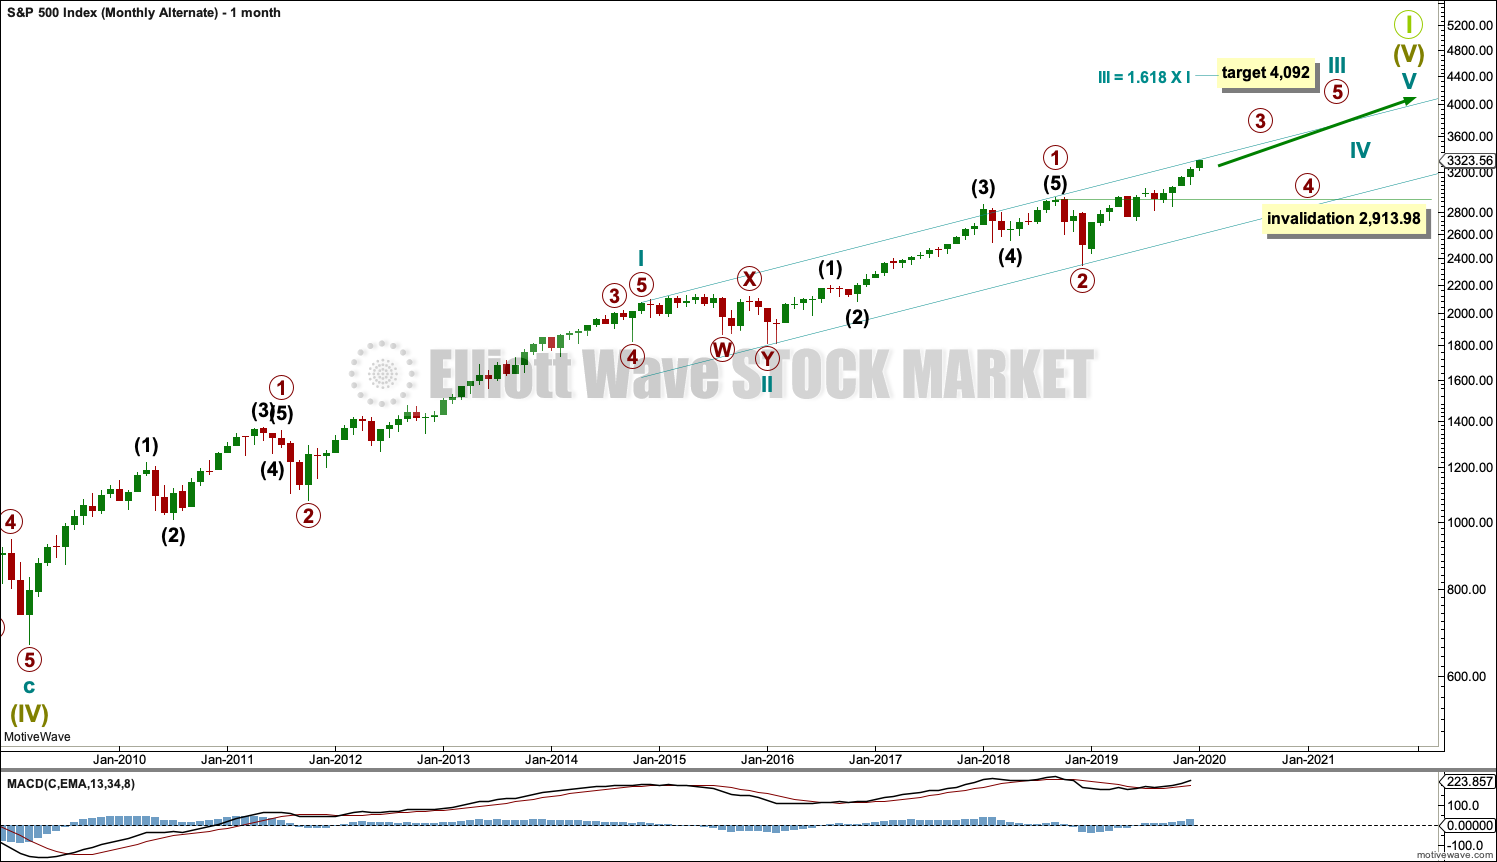
It is also possible that cycle wave I was over earlier and did not extend. Cycle wave III may have extended and exhibits a Fibonacci ratio to cycle wave I.
Within cycle wave III, both primary waves 2 and 4 are more time consuming than cycle waves II and IV. This is possible and does occasionally happen when waves extend as they do so both in price and time, but it does give the wave count an odd look.
The channel is drawn using Elliott’s first technique. It shows where cycle wave IV found support. However, the upper edge of the channel is breached by much of cycle wave III and not just the strongest portion of it. This does not have a typical look.
This wave count still agrees with MACD. Cycle wave III exhibits strongest momentum, and primary wave 3 within cycle wave III exhibits the strongest histogram within MACD.
This wave count has no limit on upwards movement.
Cycle wave V has now passed equality in length with cycle wave I. The next likely Fibonacci ratio for cycle wave V is used to calculate a target.
TECHNICAL ANALYSIS
MONTHLY CHART
Click chart to enlarge. Chart courtesy of StockCharts.com.
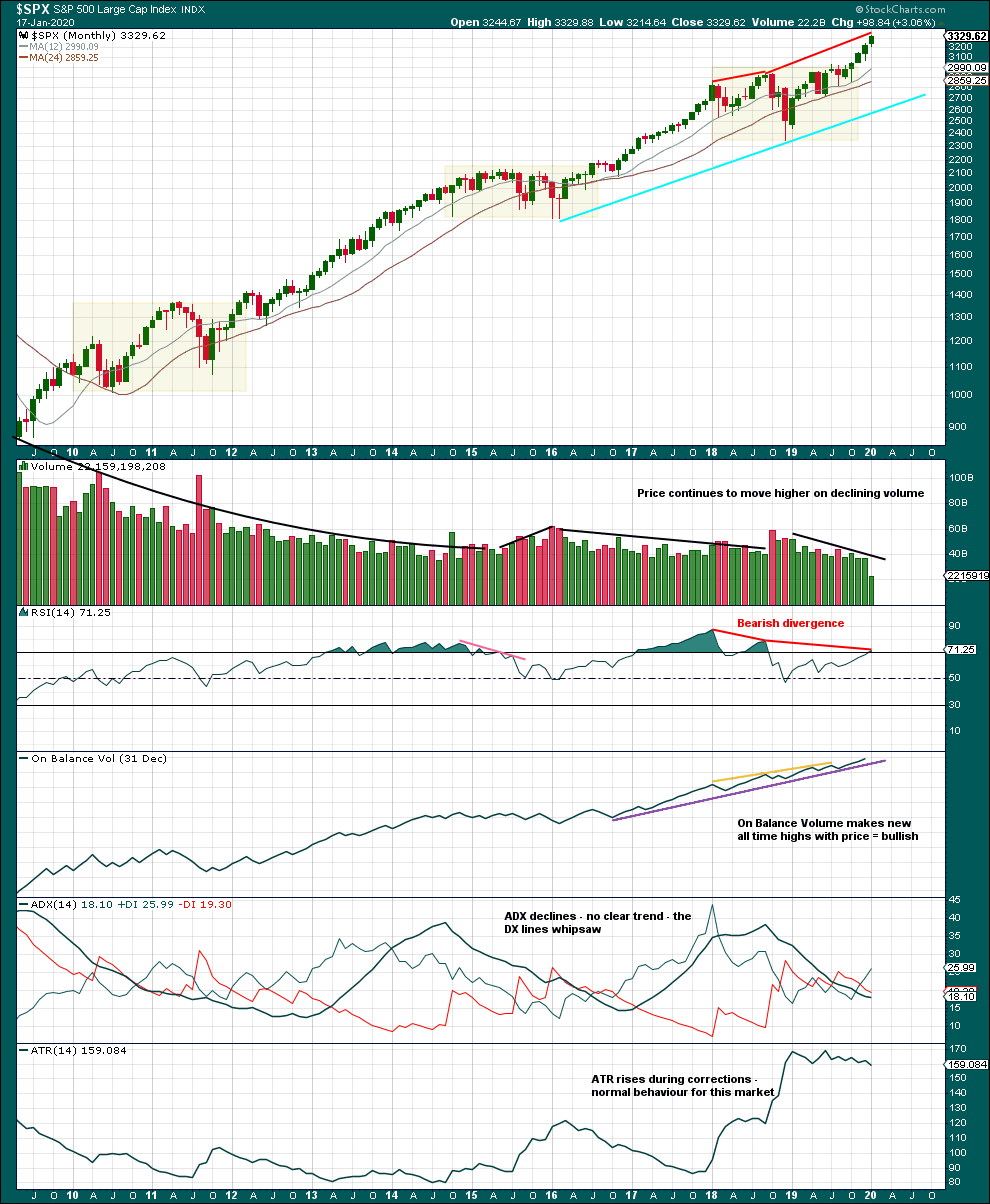
There are three large consolidations noted on this chart, in shaded areas. After a breakout from a multi-month consolidation, it is reasonable to expect a multi month bullish move may result.
Note that in each of the first two cases a pullback saw price re-enter the consolidation zone after the breakout, before price then moved up and away. It is possible that may happen again after the last breakout from a consolidation.
This chart very clearly exhibits rising price on declining volume has now persisted for several years. A decline in volume last month, in current market conditions, is not of concern.
On Balance Volume supports the Elliott wave count.
WEEKLY CHART
Click chart to enlarge. Chart courtesy of StockCharts.com.
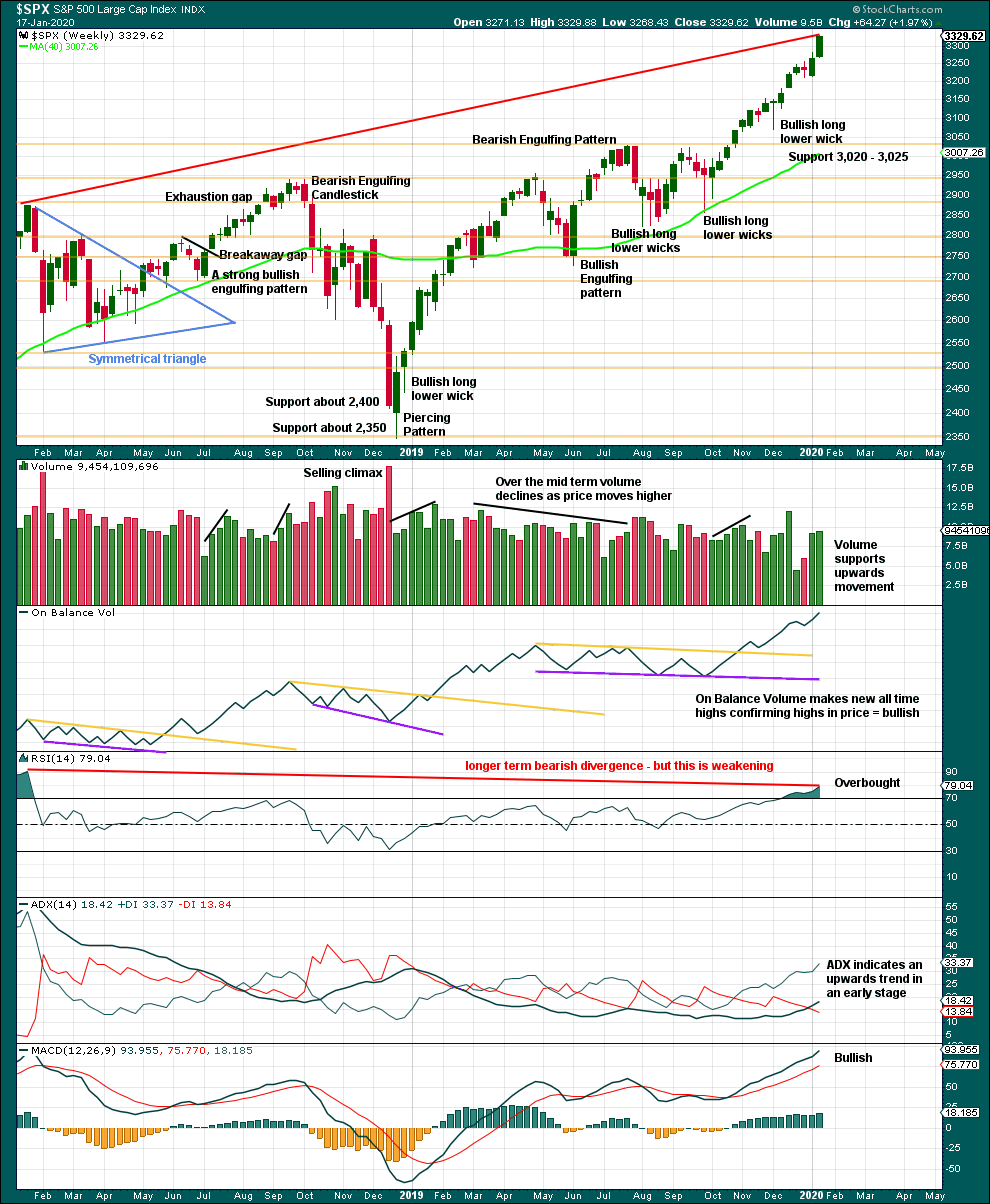
It is very clear that the S&P is in an upwards trend and the bull market is continuing. Price does not move in straight lines; there will be pullbacks and consolidations along the way.
This chart is overall bullish. There are no signs of short-term weakness in upwards movement.
RSI is now overbought. That does not mean upwards movement must end here, because it can continue for several weeks while RSI reaches more extreme. RSI reaching overbought is a warning that conditions are now becoming extreme. A pullback or consolidation will follow and the longer conditions are extreme the closer this will be. However, assume the trend remains the same until proven otherwise. This warning should be heeded by careful attention to risk management.
This week again completes a strong bullish candlestick with some support from volume. The trend remains upwards, for now.
DAILY CHART
Click chart to enlarge. Chart courtesy of StockCharts.com.
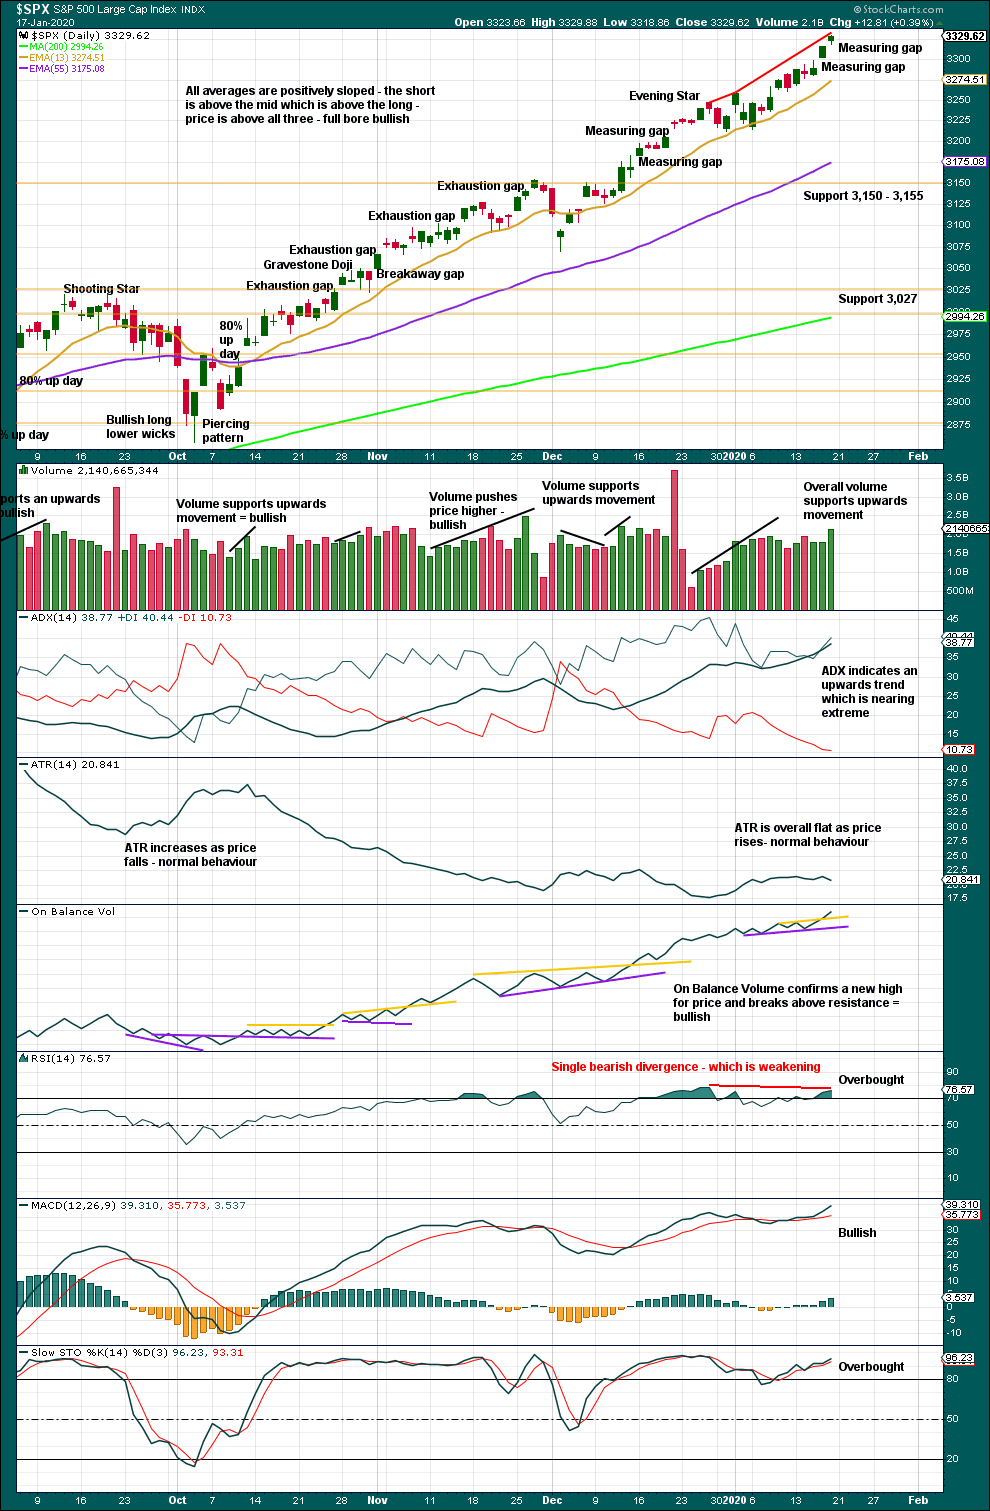
There is an upwards trend in place. There will be corrections along the way.
Like the weekly chart, this chart is bullish.
RSI now exhibits only single bearish divergence where up until today it had exhibited double bearish divergence. Divergence is weakening; it is possible that it may disappear. With the data in hand today, there is still some weakness exhibited by this divergence and while conditions are extreme this may be an indication that a pullback may arrive here or very soon.
Corrections for this market can sometimes arrive with very little warning. Extreme conditions warrant more careful attention to risk management. Upwards movement could continue yet for a reasonable distance and time, but the risk of a consolidation or pullback is increasing.
A target from the gap yesterday is at 3,386.85. Closure of this gap would indicate it would be an exhaustion gap. At that stage, a consolidation or pullback may be expected to have just begun.
Another gap today gives a closer target at 3,333.
BREADTH – AD LINE
WEEKLY CHART
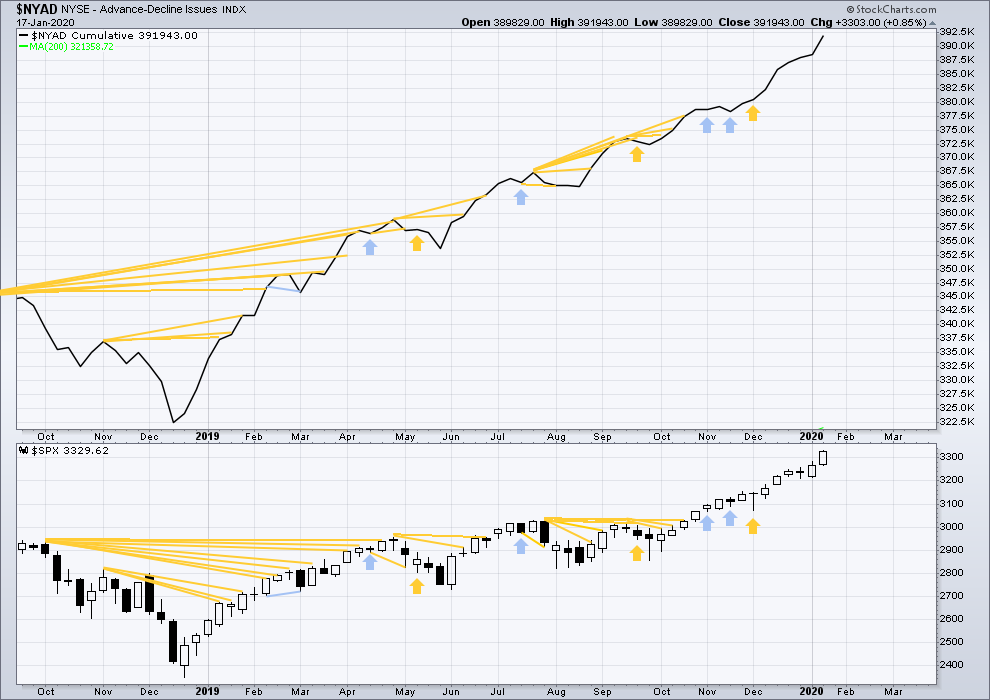
Click chart to enlarge. Chart courtesy of StockCharts.com. So that colour blind members are included, bearish signals
will be noted with blue and bullish signals with yellow.
Bear markets from the Great Depression and onwards have been preceded by an average minimum of 4 months divergence between price and the AD line with only two exceptions in 1946 and 1976. With the AD line making new all time highs this week, the end of this bull market and the start of a new bear market is very likely a minimum of 4 months away, which is mid May 2020.
In all bear markets in the last 90 years there is some positive correlation (0.6022) between the length of bearish divergence and the depth of the following bear market. No to little divergence is correlated with more shallow bear markets. Longer divergence is correlated with deeper bear markets.
If a bear market does develop here, it comes after no bearish divergence. It would therefore more likely be shallow.
Again both price and the AD line have made new all time highs. There is no divergence. Upwards movement has support from rising market breadth.
Large caps all time high: 3,329.88 on 17th January 2020.
Mid caps all time high: 2,106.30 on 17th January 2020.
Small caps all time high: 1,100.58 on 27th August 2018.
Current upwards movement is driven by large caps, which is a feature of an aged bull market.
DAILY CHART
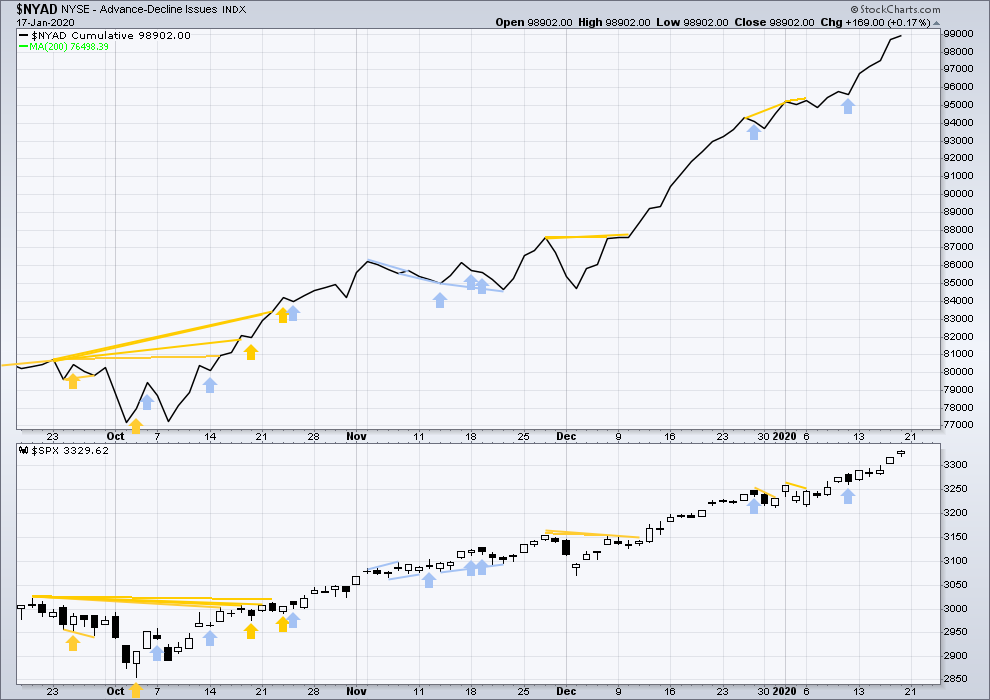
Click chart to enlarge. Chart courtesy of StockCharts.com. So that colour blind members are included, bearish signals
will be noted with blue and bullish signals with yellow.
Breadth should be read as a leading indicator.
Upwards movement continues to see new all time highs in both price and the AD line. Upwards movement has support from rising market breadth. This is bullish.
VOLATILITY – INVERTED VIX CHART
WEEKLY CHART
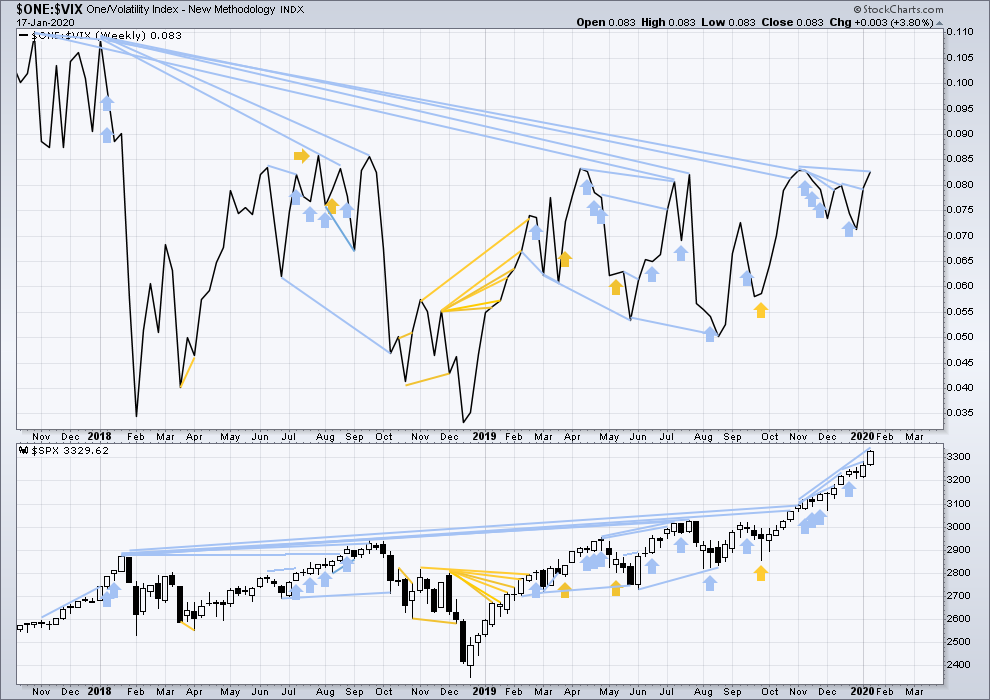
Click chart to enlarge. Chart courtesy of StockCharts.com. So that colour blind members are included, bearish signals
will be noted with blue and bullish signals with yellow.
The all time high for inverted VIX was on 30th October 2017. There is now over two years of bearish divergence between price and inverted VIX.
The rise in price is not coming with a normal corresponding decline in VIX; VIX remains elevated. This long-term divergence is bearish and may yet develop further as the bull market matures.
This divergence may be an early warning, a part of the process of a top developing that may take years. It may is clearly not useful in timing a trend change from bull to a fully fledged bear market.
This week price and inverted VIX have both moved higher. Price is making new highs, but there remains all of short, mid and long-term bearish divergence with inverted VIX. Short-term divergence is weakened this week.
DAILY CHART
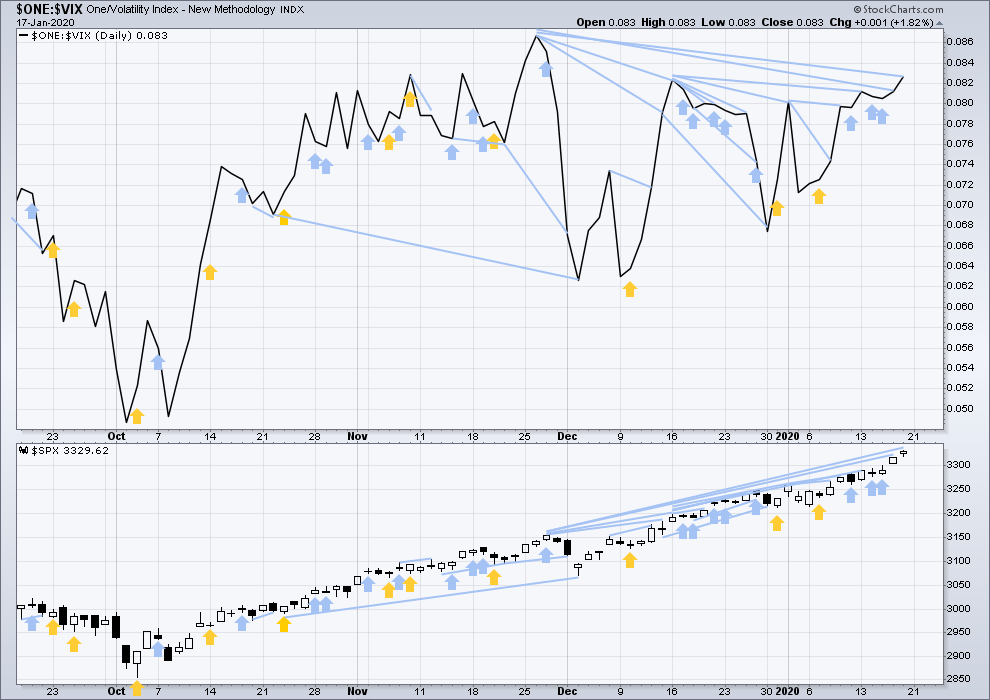
Click chart to enlarge. Chart courtesy of StockCharts.com. So that colour blind members are included, bearish signals
will be noted with blue and bullish signals with yellow.
Both price and inverted VIX have moved higher today. Price has made new highs, but inverted VIX still exhibits mid and long-term bearish divergence.
DOW THEORY
Dow Theory confirmed a bear market in December 2018. This does not necessarily mean a bear market at Grand Super Cycle degree though; Dow Theory makes no comment on Elliott wave counts. On the 25th of August 2015 Dow Theory also confirmed a bear market. The Elliott wave count sees that as part of cycle wave II. After Dow Theory confirmation of a bear market in August 2015, price went on to make new all time highs and the bull market continued.
DJIA: 23,344.52 – a close on the 19th of December at 23,284.97 confirms a bear market.
DJT: 9,806.79 – price has closed below this point on the 13th of December.
S&P500: 2,532.69 – a close on the 19th of December at 2,506.96 provides support to a bear market conclusion.
Nasdaq: 6,630.67 – a close on the 19th of December at 6,618.86 provides support to a bear market conclusion.
With all the indices having moved higher following a Dow Theory bear market confirmation, Dow Theory would confirm a bull market if the following highs are made:
DJIA: 26,951.81 – a close above this point has been made on the 3rd of July 2019.
DJT: 11,623.58 – to date DJT has failed to confirm an ongoing bull market.
S&P500: 2,940.91 – a close above this point was made on the 29th of April 2019.
Nasdaq: 8,133.30 – a close above this point was made on the 26th of April 2019.
Published @ 11:08 p.m. EST.
—
Careful risk management protects your trading account(s).
Follow my two Golden Rules:
1. Always trade with stops.
2. Risk only 1-5% of equity on any one trade.
—
New updates to this analysis are in bold.
Hourly main chart updated:
Micro waves 2 and 4 look nicely alternated.
/ES hourly with overnight data. Some key levels for possible support and renewal of the very strong up trend are marked. I’ll start thinking about a minor 3 only when I see the lower trend line broken. Until this, this is an opportunity to make money on the long side for me by getting in line (more) with this beast.
Bonds are moving up sharply in overnight action.
More evidence of at least some kind of correction getting rolling here. Gold is also poised to continue impulsive action upward, which would be consistent for a large risk-off day.
I have closed out just about all my long equity positions (after the really big ones expiring last Friday). Hunkering down a little here. A time for caution and patience. Still hold long TLT, long GDX and GLD, and a long term (one year out!) fly in SPX, and a long spread in ZEN which just looks too bullish to bail on.
New York is closed today for Martin Luther King day, and so there is no data to analyse.
Instead of analysis today, I’ll just leave you another pic of my beautiful country. We surfed here yesterday, Maungamaunu. It’s a beautiful world class long right hand point break. The mountains in the background make it spectacular. The water is a bit grey from sediment carried down from glaciers.
This is Cesar very happy after a great surfing session.
Your country is certainly beautiful. But, boy oh boy, the names of places are quite difficult for me to pronounce! Maungamaunu
The vowels in Maori are pronounced exactly the same as in Spanish. That might help with the pronounciation
Nice!! How about an action shot of Lara in the curl?
I’m working on getting myself back out. Soon…except here in Jan the surf tends to be on the too big too paddle out and you wouldn’t want to make it out anyway because you’d be too scared to paddle in size! But the next small sunny weekday, time to hit Pacifica with my longboard and get the power glide going, yup.
Here is an interesting article…
https://www.theguardian.com/business/2020/jan/17/head-of-imf-says-global-economy-risks-return-of-great-depression
Following is a quote from the article which is a speech delivered by the new IMF boss, Kristalina Georgieva :
————————————————————————————————–
“America faces an epic choice…
… in the coming year, and the results will define the country for a generation. These are perilous times. Over the last three years, much of what the Guardian holds dear has been threatened – democracy, civility, truth. This US administration is establishing new norms of behaviour. Anger and cruelty disfigure public discourse and lying is commonplace. Truth is being chased away. But with your help we can continue to put it center stage.”
————————————————————————————————
This is typical globalist talk. Globalism has been destroyed over the past 4 years beginning with Brexit. Ms. Georgieva, working for the IMF, is a pure globalist. That is why she gives a negative statement regarding populism and by that she means national populism. She would not like me at all! She will not like the results of the next USA national election either. National populism is sweeping the globe and will continue to do so for decades to come.
Rodney – I am fully expecting a second term for the incumbent president. Let’s see how impeachment hearings go.
I support the values of democracy, civil discourse, and truth. And all three are not just threatened, they are under active attack. And no, I am not a populist, a nationalist, nor a globalist, nor can any such label be applied to me based on my support of these values. I am merely a citizen…who supports democracy, civil discourse, and truth.
The McClellan Oscillator turned down yesterday in the face of a rising SPX. This indicates weakness. It is certainly not an indicator or signal. Rather it is just a sign of weakness which is something we have not seen a lot over the last many weeks and several months.
Rodney – do you mind sharing the instrument that you typically use for S&P trading?
I don’t mind sharing anything, Rishi. I have been trading / investing with a long term point to view lately. For that, I use a large cap or SPX index fund available where I have that money. Sometimes I choose mid or small cap stocks. But lately I’ve been using SPX 500 only because they tend to do relatively better near the end of bull markets. However, if the wave count changes as per the Alternate Monthly, I will buy at least 25% small cap stocks.
For short term trading (to me this is days instead of weeks or months), I use leveraged ETF like UPRO or SPXU etc.
I hope that provides some help.
Much appreciated Rodney!
Lara,
It looks to me like MACD for SPX has made a new weekly high above that of January 26, 2018. The monthly MACD for January 2020 has not yet closed. But currently it looks to have exceeded the MACD of September 2018.
January 26, 2018 Weekly MACD 12,26 @ 92.48 – Weekly Exp. Mov. Ave. 9 @ 72.97
January 17, 2019 Weekly MACD 12,26 @ 93.96 – Weekly Exp. Mov. Ave. 9 @ 75.77
September 28, 2018 Monthly MACD 12,26 @ 174.04 – Monthly EMA 9 @ 160.79
Current unclosed Monthly MACD 12,26 @ 174.16 – Monthly EMA 9 @ 143.69
You are the pro at reading these numbers. But it looks to my amateur eyes, that we have new highs on MACD at the weekly time frame and soon to be at the monthly time frame.
Thoughts and comments appreciated.
I’m looking at the monthly MACD for the overall wave count at this time frame. I’m not looking at numbers, I’m just expanding MACD like this to better see the peaks. Sometimes I take a horizontal line to put across the highest peak to compare them.
I’m just doing it this way because it’s quicker.
You’re right, at the weekly time frame MACD is making new highs. But I don’t think that’ the right time frame to look at a wave that’s over 10 years.
In this weeks video if I outlined how MACD supports the wave count at the weekly, not monthly level, then that may be a source of confusion and for that I apologise.
Thanks for the reply. I understand. Just something to watch. Have a great day
That monthly macd crossover is more than a little super strongly bullish, per that chart! Ciovacco shown the longer term data; it’s always a strongly signal (there might be once it didn’t produce a multi-year move).
Lake Pukaki with Aoraki in the background (barely visible, really big mountain) can be first this weekend.
Nice. Really nice.
Spectacular. The Misty Mountains!!
“Far Over, The Misty Mountains Cold…”