
Last analysis expected for very short-term movement to move at least slightly below 2,977.24 before an upwards swing began. Price did move lower reaching 2,901.55 and from there bounced up to end the session green.
Summary: There is no evidence to suggest the larger bull market is over. The current pullback is very deep and not likely to be finished yet. At its conclusion, it may present a good buying opportunity.
For the short term, a bounce or sideways consolidation may continue for wave B. A target zone for it to end next week is now at 3,182 to 3,188.
A new low below 2,728.81 would indicate a deeper correction that may end at the lower edge of the teal multi-year trend channel.
The biggest picture, Grand Super Cycle analysis, is here.
Last monthly charts analysis is here with video here.
ELLIOTT WAVE COUNTS
FIRST WAVE COUNT
WEEKLY CHART
Click chart to enlarge.
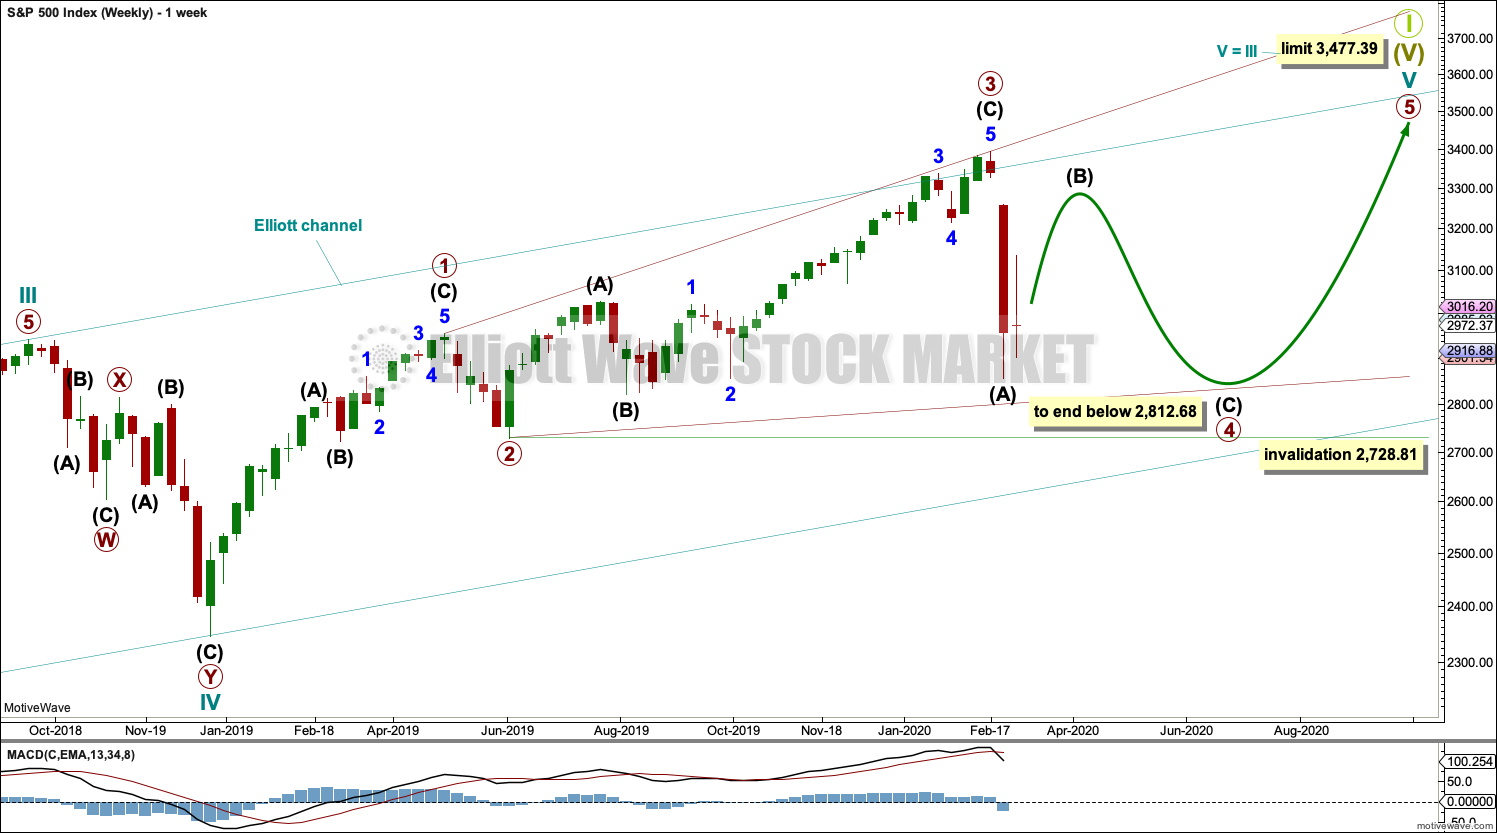
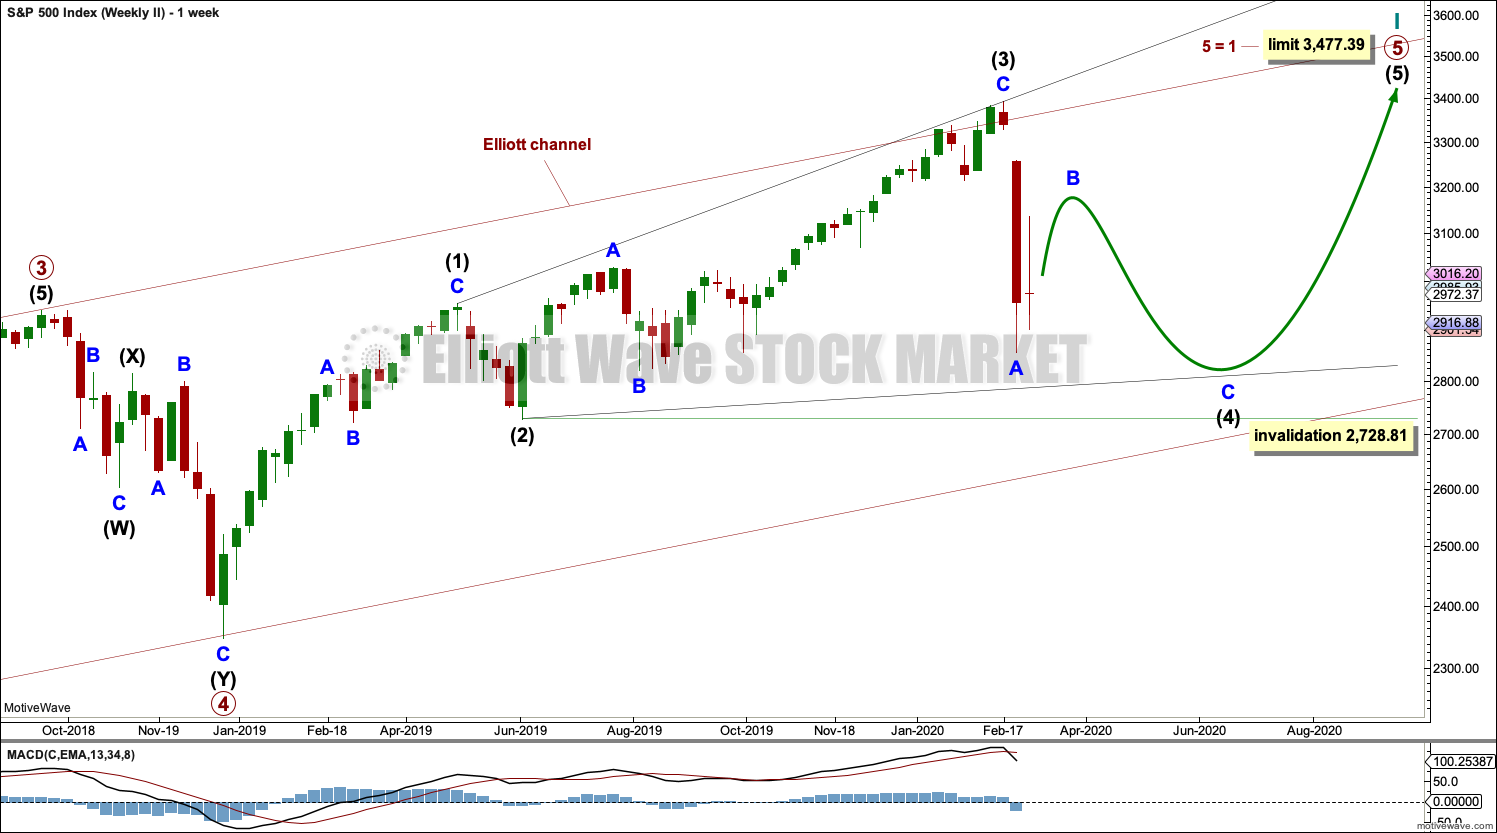
Cycle wave V may subdivide either as an impulse or an ending diagonal. This wave count considers a diagonal. The alternate considers an impulse.
A channel is drawn about the impulse of Super Cycle wave (V) using Elliott’s first technique. Draw this channel first from the high of 2,079.46 on the 5th of December 2014 to the high of 2,940.91 on the 21st of September 2018, then place a parallel copy on the low at 1,810.10 on the 11th of February 2016. Cycle wave IV found support about the lower edge.
The middle of the third wave overshoots the upper edge of the Elliott channel drawn about this impulse. All remaining movement is contained within the channel. This has a typical look.
Within Super Cycle wave (V), cycle wave III may not be the shortest actionary wave. Because cycle wave III is shorter than cycle wave I, this limits cycle wave V to no longer than equality in length with cycle wave III at 3,477.39. A new high by any amount at any time frame above this point would invalidate this main wave count in favour of one of the two alternate monthly charts which may be seen in last published monthly analysis.
At this stage, cycle wave V may end within this year or possibly into next year.
The daily chart below will focus on movement from the end of intermediate wave (B) within primary wave 3.
Ending diagonals require all sub-waves to subdivide as zigzags. Primary wave 4 of a diagonal must overlap primary wave 2. This rule is now met. Primary wave 4 may not move below the end of primary wave 2 below 2,728.81.
This ending diagonal would be expanding. Primary wave 3 is longer than primary wave 1, and primary wave 4 so far is longer than primary wave 2. Primary wave 5 would need to be longer than primary wave 3 for all rules regarding wave lengths of expanding diagonals to be met.
Fourth and second waves of diagonals most commonly end somewhere between 0.66 to 0.81 of the prior wave. This gives a target zone for primary wave 4 from 2,954.81 to 2,855.10. However, this diagonal is expanding and primary wave 5 needs to be longer in length than primary wave 3, which was 664.71 points for this rule to be met. This rule needs to be met prior to the upper limit for cycle wave V at 3,477.39, so primary wave 5 would need to begin below 2,812.68.
DAILY CHART
Click chart to enlarge.
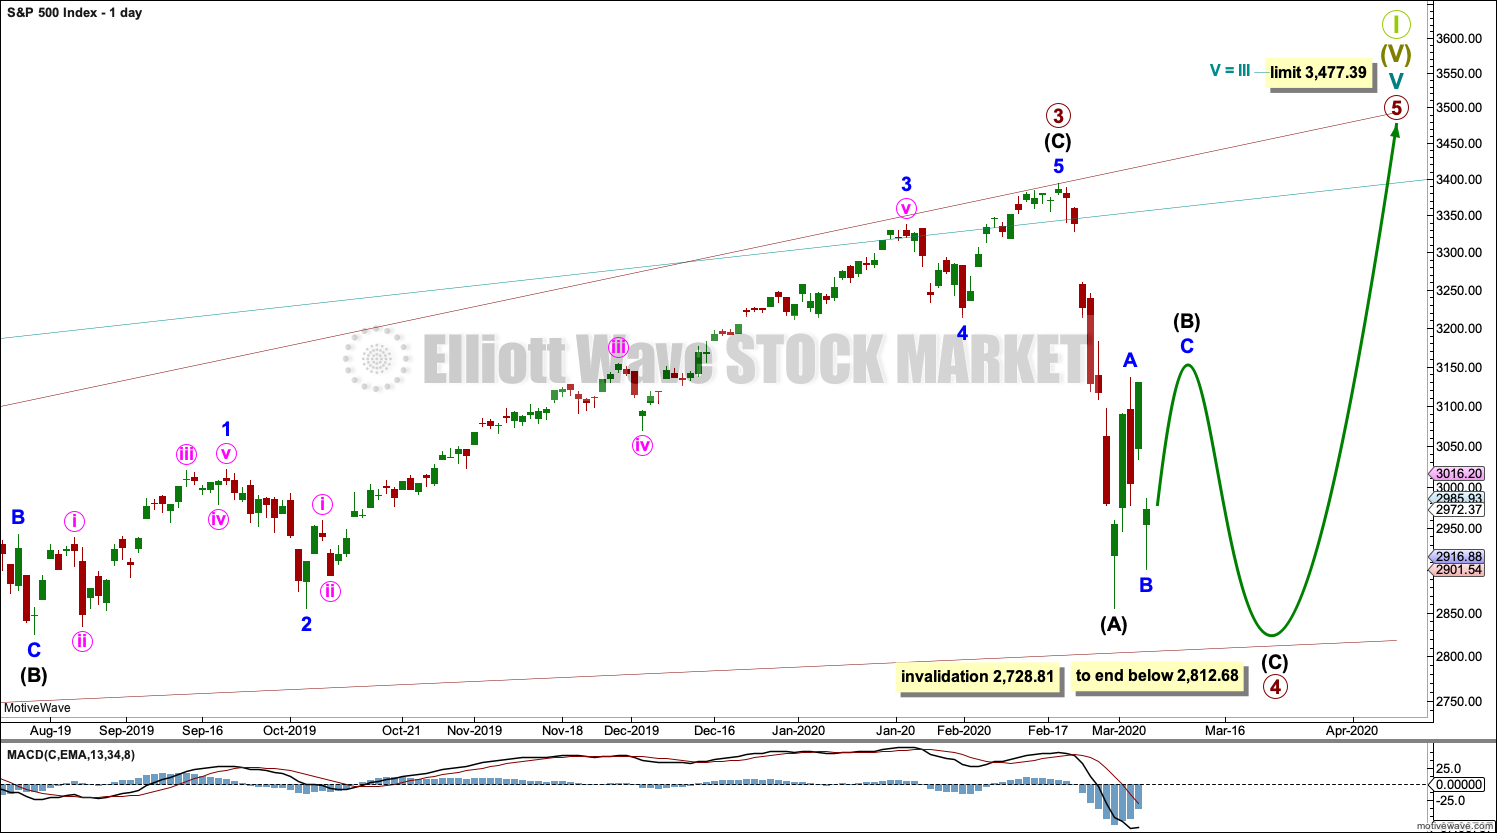
All sub-waves of an ending diagonal must subdivide as zigzags. This is the only Elliott wave structure where a third wave sub-divides as anything other than an impulse.
Primary wave 4 must subdivide as a zigzag. Within the zigzag, a sharp bounce or a time consuming sideways consolidation for intermediate wave (B) may be underway. It may now end next week.
Diagonals normally adhere very well to their trend lines, which may be tested within the sub-waves. The upper 1-3 trend line is tested at the end of minor wave 3 within intermediate wave (C) within primary wave 3.
Primary wave 4 may not move beyond the end of primary wave 2 below 2,728.81.
HOURLY CHART
Click chart to enlarge.
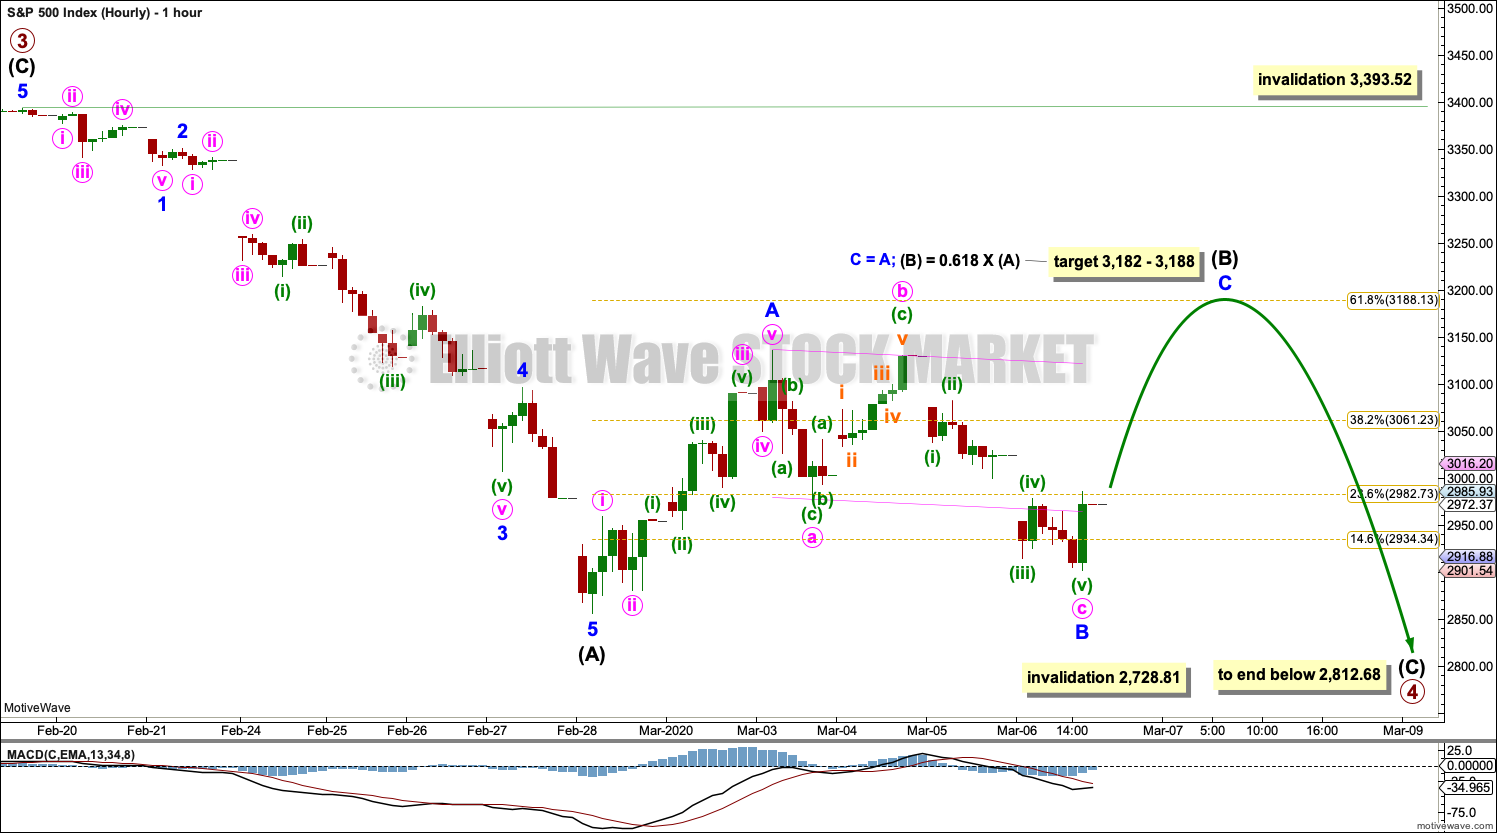
Primary wave 4 within a diagonal must subdivide as a zigzag. Within the zigzag, intermediate wave (B) now shows up on the daily and weekly charts giving the wave count the right look.
Intermediate wave (B) may not move beyond the start of intermediate wave (A) above 3,393.52.
This first hourly chart looks at the possibility that intermediate wave (B) may be unfolding as a zigzag. This is the most common Elliott wave corrective structure, so this wave count has a higher probability than the alternate hourly chart below.
Within the zigzag, minor wave B may be a complete regular flat correction. Within the regular flat, both minute waves a and b subdivide well as three wave structures. Minute wave b is a 0.96 length of minute wave a. Minute wave c has made a new low below the end of minute wave a at 2,977.24 avoiding a truncation.
A five wave upwards structure for minor wave C may complete a zigzag for intermediate wave (B). Minor wave C would be very likely to make at least a slight new high above the end of minor wave A at 3,136.39 to avoid a truncation.
ALTERNATE HOURLY CHART
Click chart to enlarge.
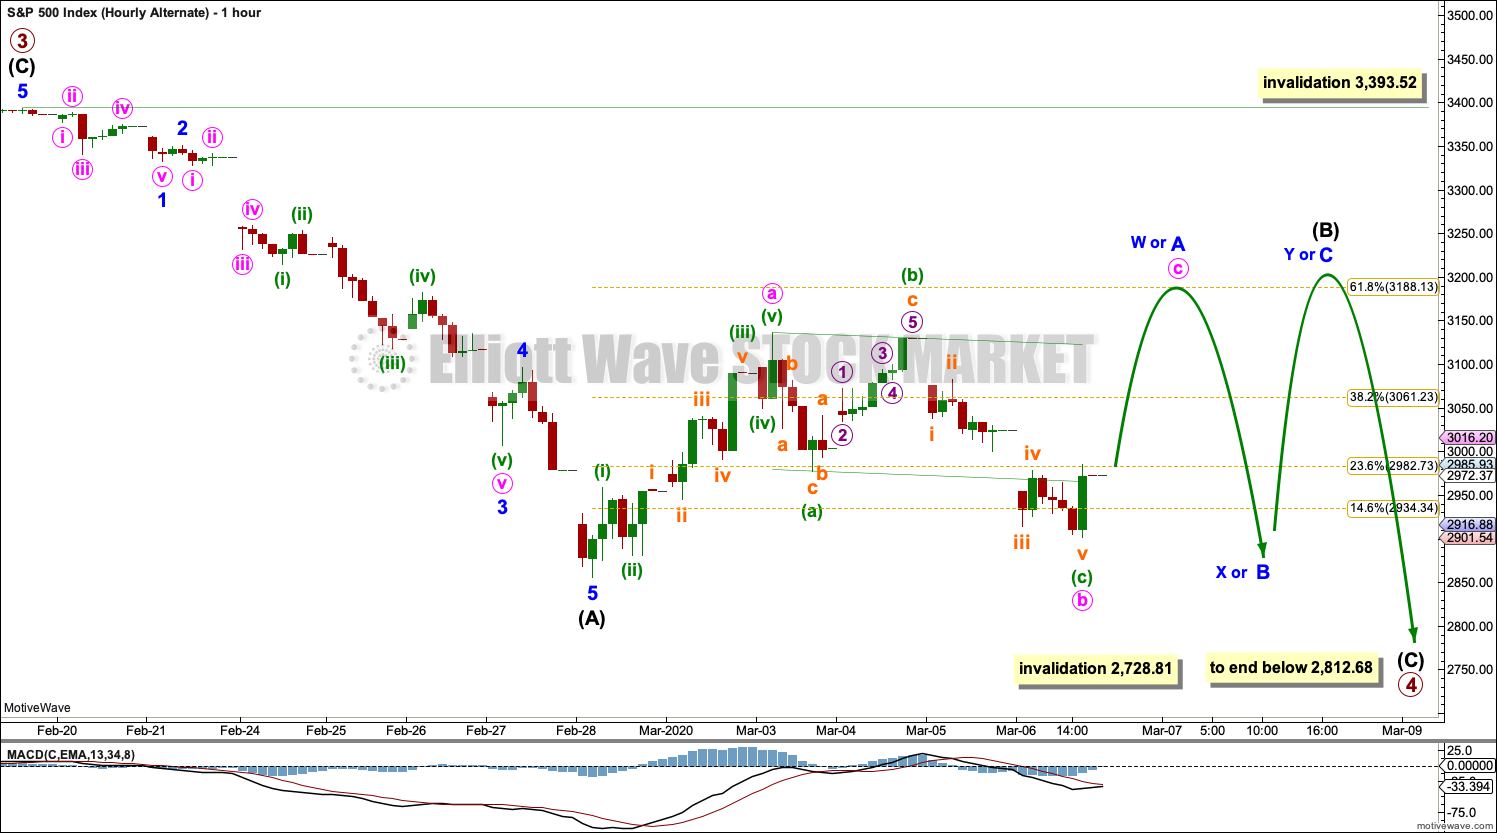
It is also possible to move the degree of labelling within intermediate wave (B) down one degree. Intermediate wave (B) may be unfolding sideways as a flat, combination or triangle. All of these structures begin with a three wave structure, or minor wave A or W, that may be an incomplete zigzag.
When minor wave A or W may be complete, then minor wave B or X may be a deep pullback.
SECOND WAVE COUNT
WEEKLY CHART
Click chart to enlarge.
This second wave count sees all subdivisions from the end of the March 2009 low in almost the same way, with the sole difference being the degree of labelling.
If the degree of labelling for the entirety of this bull market is all moved down one degree, then only a first wave at cycle degree may be nearing an end.
When cycle wave I is complete, then cycle wave II should meet the technical definition of a bear market as it should retrace more than 20% of cycle wave I, but it may end about either the 0.382 or 0.618 Fibonacci Ratios of cycle wave I. Cycle wave II may end close to the low of primary wave II within cycle wave I, which is at 1,810.10. It is also possible that cycle wave II could be fairly shallow and only barely meet the definition of a bear market.
An ending expanding diagonal is still viewed as nearing an end. This wave count labels it primary wave 5. Primary wave 5 may still need another year to two or so to complete, depending upon how time consuming the corrections within it may be.
Primary wave 5 may be subdividing as a diagonal, in the same way that cycle wave V is seen for the first weekly chart.
ALTERNATE WAVE COUNT
WEEKLY CHART
Click chart to enlarge.
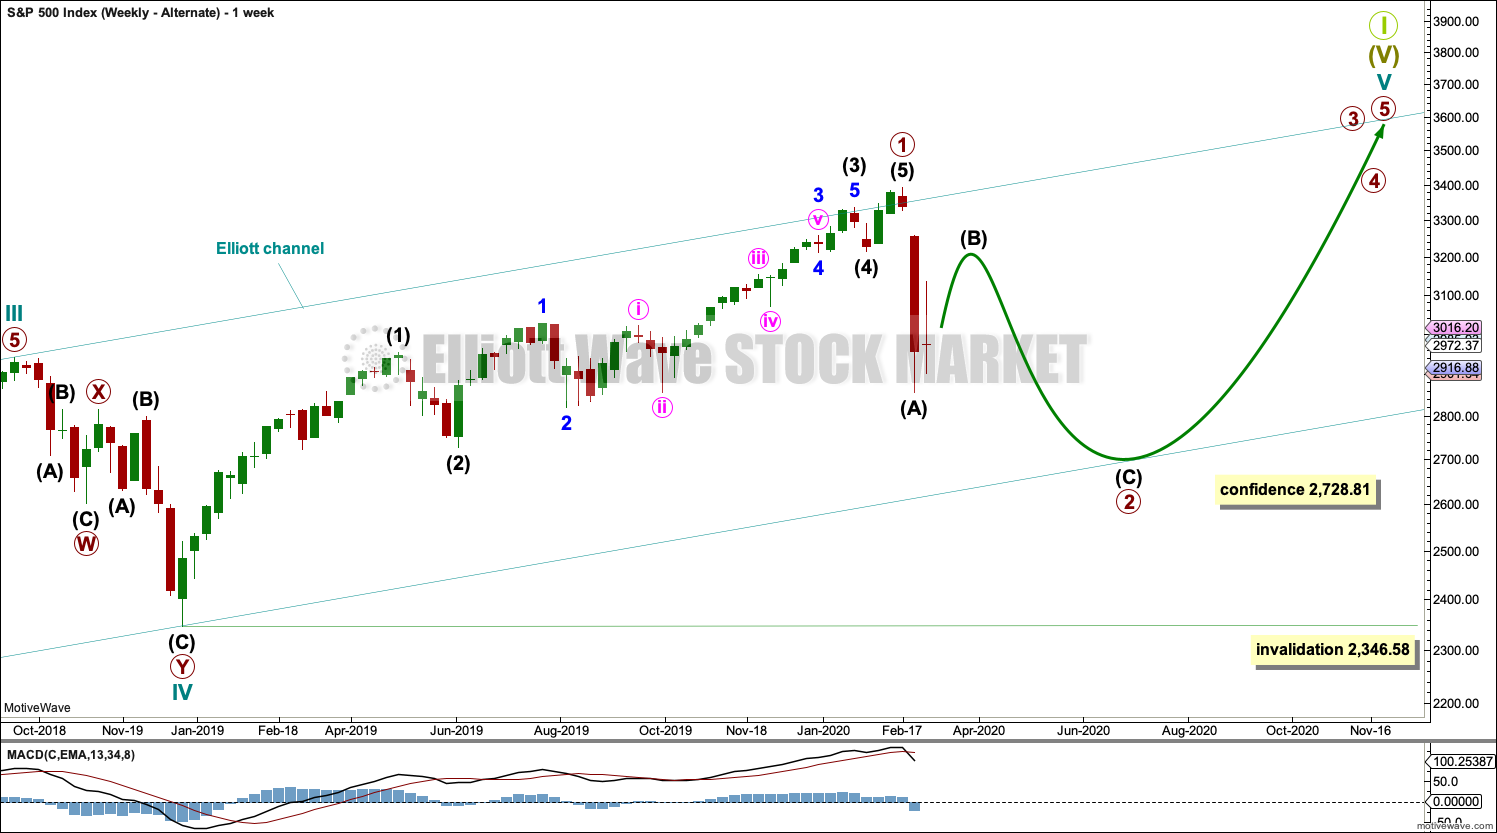
It is also possible that cycle wave V may still be unfolding as an impulse. Within the impulse, only primary wave 1 may be over at the last high.
Primary wave 1 is seen as an impulse. Within primary wave 1, there is poor proportion between the corrections of intermediate waves (2) and (4) and minor waves 2 and 4. This gives the wave count a forced look, but it is valid.
Primary wave 2 may be unfolding as a zigzag. It may find strong support about the lower edge of the multi-year teal trend channel.
Primary wave 2 may not move beyond the start of primary wave 1 below 2,346.58.
If the main wave count is invalidated with a new low below 2,728.81, then this alternate would then be used.
The limit is removed from this alternate. If only primary wave 1 is over at the last all time high, then more room would be required for the structure of cycle wave V to complete than the limit would allow. This alternate may fit with one of the alternate monthly charts.
TECHNICAL ANALYSIS
WEEKLY CHART
Click chart to enlarge. Chart courtesy of StockCharts.com.
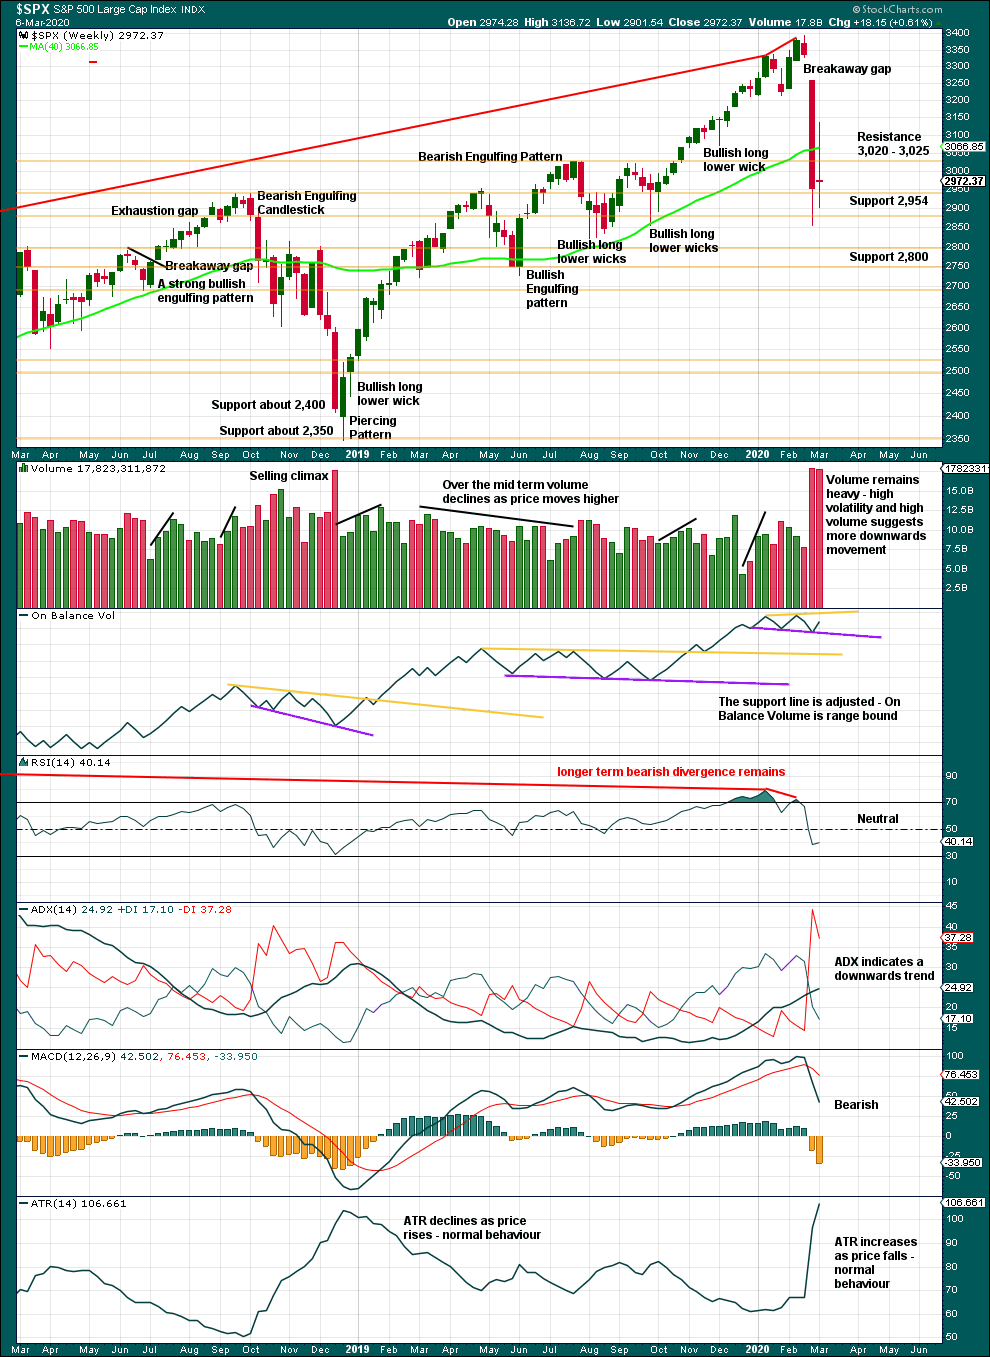
A 15.8% drop in price (high to low) so far has precedent within the larger bull market. It does not necessarily mean the secular bull market must be over.
At the weekly chart level, conditions are not yet oversold; this pullback may be expected to continue further.
A long legged doji this week represents a pause, a balance of bulls and bears. This is not a reversal pattern; doji appear within trends or consolidations.
DAILY CHART
Click chart to enlarge. Chart courtesy of StockCharts.com.
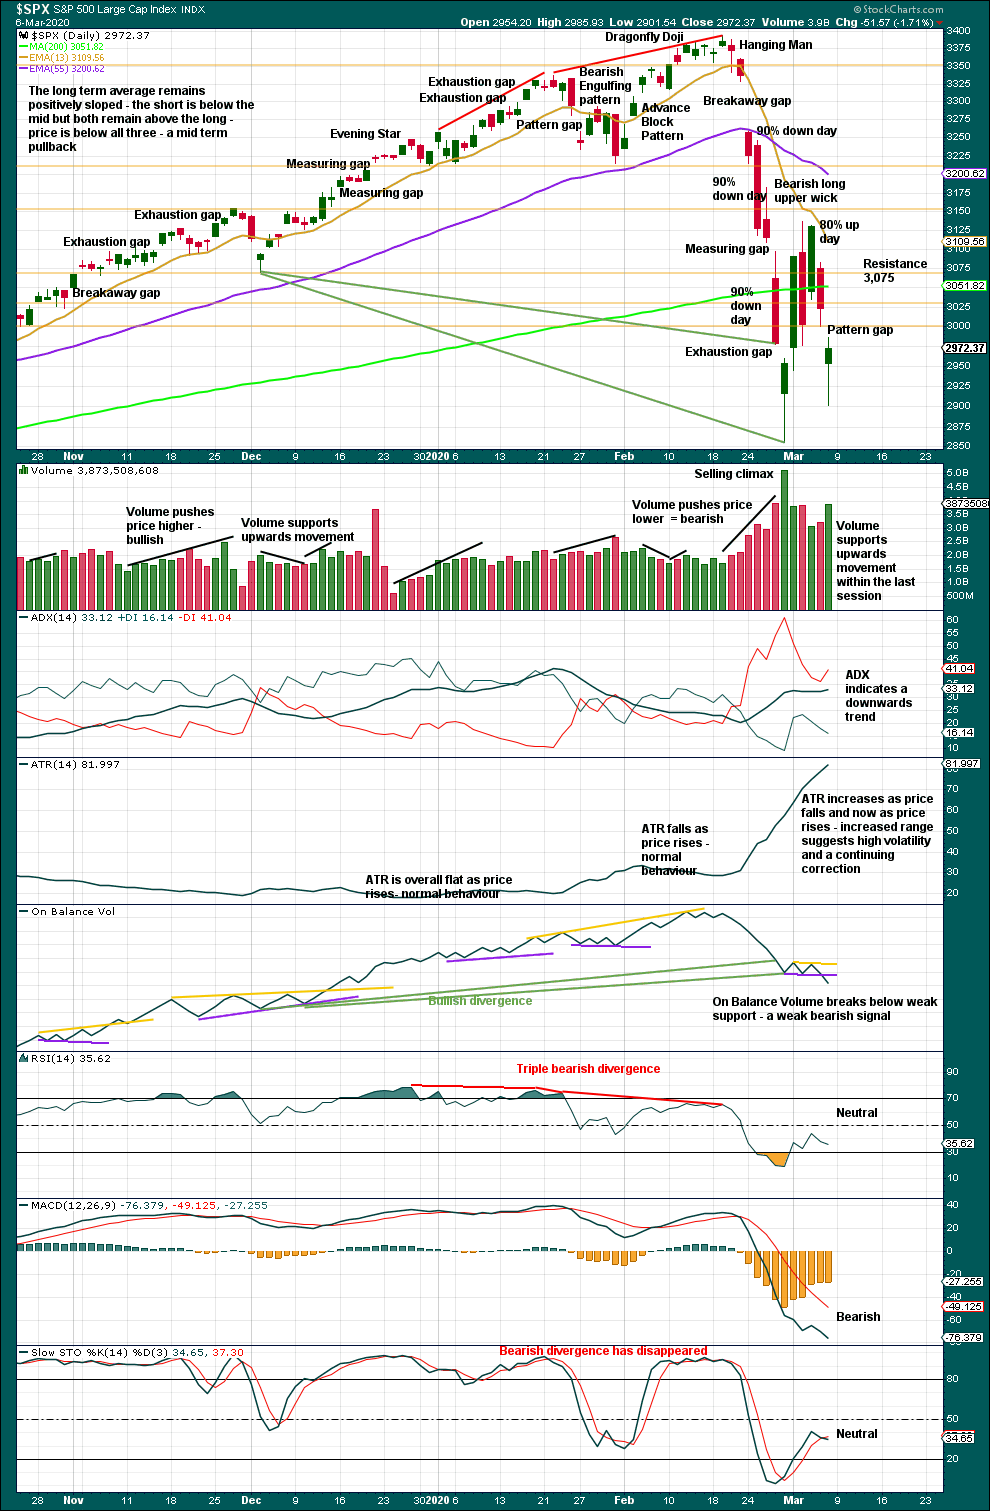
There are now three 90% downwards days in this strong downwards movement.
In the absence of a 90% upwards day or two back to back 80% upwards days, there is no evidence here of strong buying needed to signal a sustainable low in place. The correction may be reasonably expected to continue sideways and / or lower.
For the very short term, a bullish long lower wick and a strong close to Friday’s session may suggest a little more upwards movement when markets open next week.
BREADTH – AD LINE
WEEKLY CHART
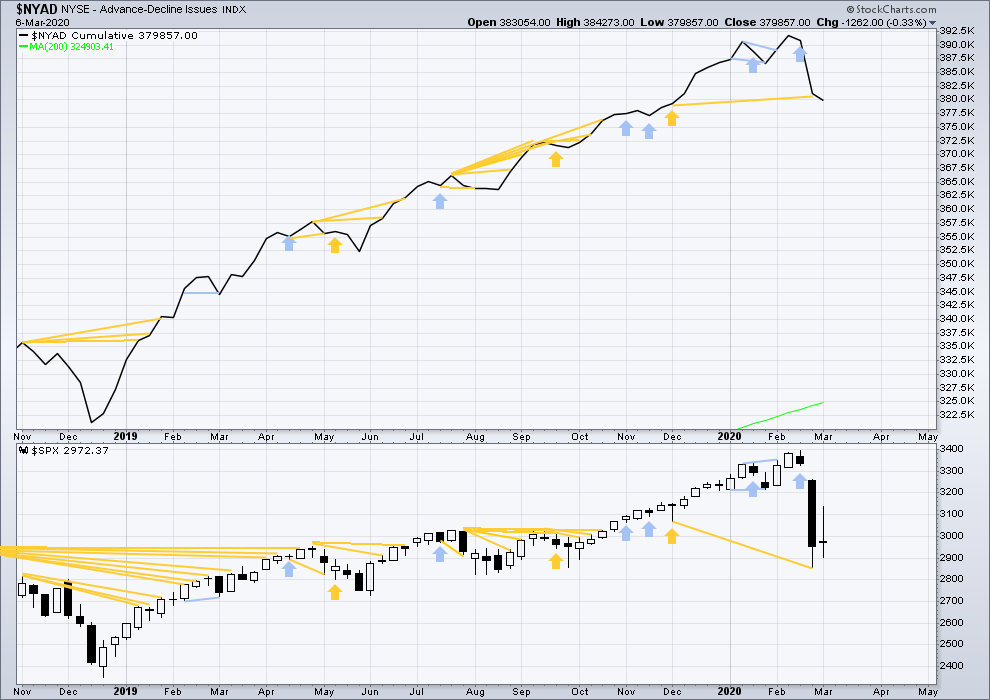
Click chart to enlarge. Chart courtesy of StockCharts.com. So that colour blind members are included, bearish signals
will be noted with blue and bullish signals with yellow.
Bear markets from the Great Depression and onwards have been preceded by an average minimum of 4 months divergence between price and the AD line with only two exceptions in 1946 and 1976. With the AD line making new all time highs with last all time highs from price, the end of this bull market and the start of a new bear market is very likely a minimum of 4 months away, which is mid June 2020.
In all bear markets in the last 90 years there is some positive correlation (0.6022) between the length of bearish divergence and the depth of the following bear market. No to little divergence is correlated with more shallow bear markets. Longer divergence is correlated with deeper bear markets.
If a bear market does develop here, it comes after no bearish divergence. It would therefore more likely be shallow.
This week price has moved sideways and the AD line has slightly declined. This is very slight bearish divergence.
Large caps all time high: 3,393.52 on 19th February 2020.
Mid caps all time high: 2,109.43 on 20th February 2020.
Small caps all time high: 1,100.58 on 27th August 2018.
DAILY CHART
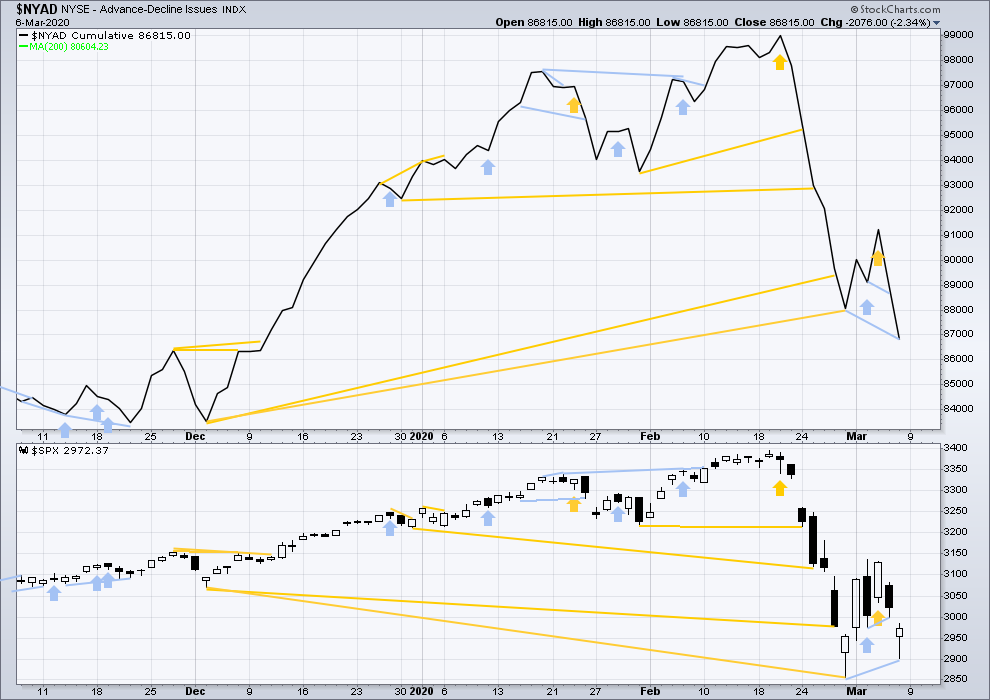
Click chart to enlarge. Chart courtesy of StockCharts.com. So that colour blind members are included, bearish signals
will be noted with blue and bullish signals with yellow.
Breadth should be read as a leading indicator.
The AD line has made a new short-term low below the prior low of the 28th of February, but price has not. This divergence is bearish and supports the view that the pullback is not over.
VOLATILITY – INVERTED VIX CHART
WEEKLY CHART
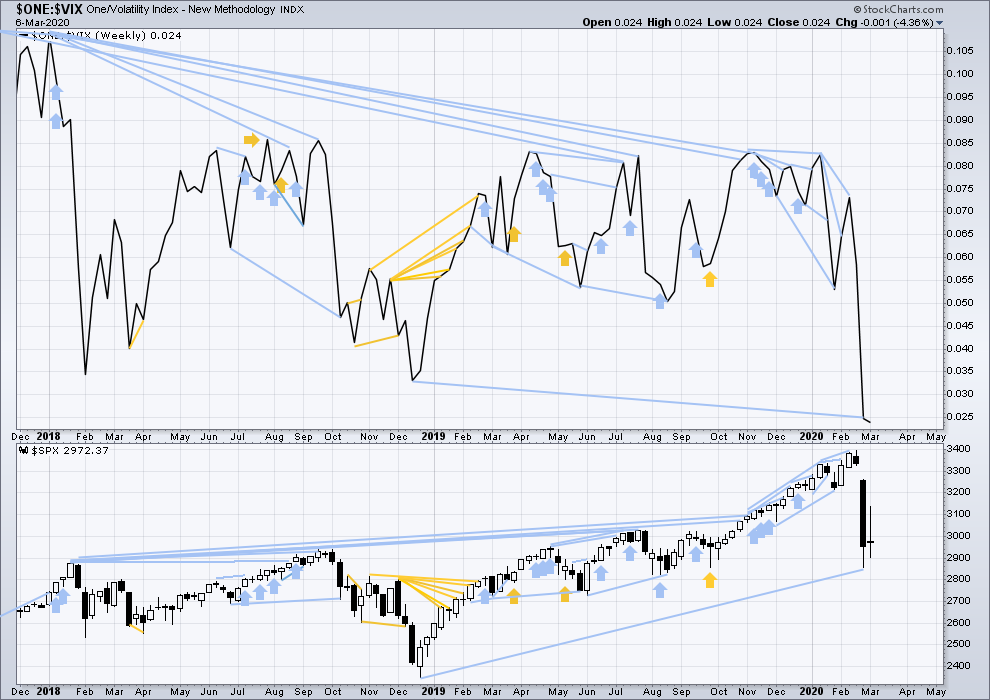
Click chart to enlarge. Chart courtesy of StockCharts.com. So that colour blind members are included, bearish signals
will be noted with blue and bullish signals with yellow.
The all time high for inverted VIX was on 30th October 2017. There is now over two years of bearish divergence between price and inverted VIX.
The rise in price is not coming with a normal corresponding decline in VIX; VIX remains elevated. This long-term divergence is bearish and may yet develop further as the bull market matures.
This divergence may be an early warning, a part of the process of a top developing that may take years. It is clearly not useful in timing a trend change from bull to a fully fledged bear market.
This week price has moved sideways and inverted VIX has moved slightly lower. This divergence is bearish for the short term.
DAILY CHART
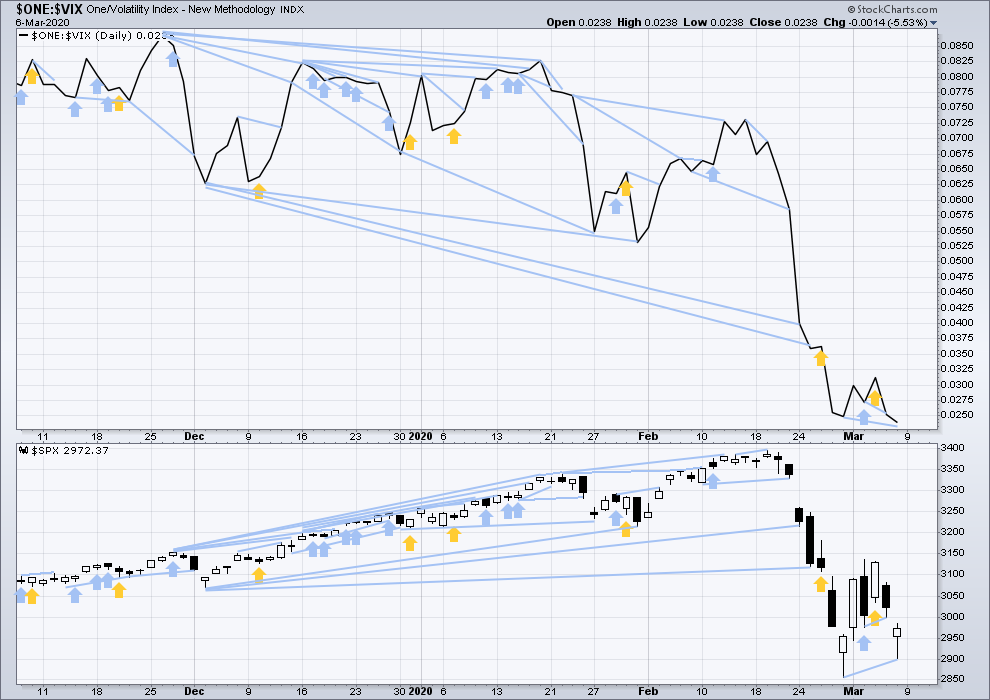
Click chart to enlarge. Chart courtesy of StockCharts.com. So that colour blind members are included, bearish signals
will be noted with blue and bullish signals with yellow.
Inverted VIX has made a new low below the prior short-term low of the 28th of February, but price has not. This divergence is bearish and supports the view that the pullback is not over.
DOW THEORY
Dow Theory would confirm a bull market if the following highs are made:
DJIA: 26,951.81 – a close above this point has been made on the 3rd of July 2019.
DJT: 11,623.58 – to date DJT has failed to confirm an ongoing bull market.
S&P500: 2,940.91 – a close above this point was made on the 29th of April 2019.
Nasdaq: 8,133.30 – a close above this point was made on the 26th of April 2019.
Dow Theory would confirm a bear market if the following lows are made on a closing basis:
DJIA: 21,712.53
DJT: 8,636.79
S&P500: 2,346.58
Nasdaq: 7,292.22
Published @ 07:03 p.m. EST.
—
Careful risk management protects your trading account(s).
Follow my two Golden Rules:
1. Always trade with stops.
2. Risk only 1-5% of equity on any one trade.
—
New updates to this analysis are in bold.
After hours, the future went well below the invalidation level of the main count (2695).
I have RUT in wave v down of an impulsive A of a Y down. (Can a Y be a zigzag….???). Well regardless of larger structure, in a v of an impulse down. Could be done, could finish around 1300, or could go to the lower Fibonacci levels around 1250 to complete.
Managed to close out nice profits after entering the morning flat, and have some positions for deeper prices in the days ahead. Will load up more on a correction up.
Hi, Is anyone here going long based on the path that Lara set out or is that no longer a valid count? Thanks Appreciate your comments
No
No
Up into the breach we go. Watch for a turn back down at one of these Fibo levels.
Are we turning back down though? Big question
Little double top under the 38% and back down we go, it appears. I’m good with that! Put on SPY and RUT and IWM shorts over the course of the first 30 minutes, all a bit longer term plays (days to weeks). Fall mountain…just don’t fall on me!
RUT falling the hardest. Done over 9% total now. I think this second leg might reach the 1.27% extension of the first leg, which would be 1303. Riding a put ratio backspread down on that.
Ok so far so good, sold half of my puts for a good morning….
Verne what’s your target ?
Well played Peter! Sadly, I cashed out of my shorts on Friday close to the lows, feeling happy about that late day rally and rather expecting some more this week.
BTW, EWI just published their updated EW count: 1 down, 2 up, and (implied) 3 down now launched. No surprise there. Nothing about this overall price action off the ATH now looks, feels, smells or tastes like corrective action to me. And the world is headed toward deeper and broader quarantines it would appear, ala Italy.
Hi Kevin,
you might be right, but we are still at 61.8% levels from 2018 lows, so so far we are still in corrective wave unless go below 78.6% levels (2575s).
The EWI count is what I am tracking as one possibility. It portends much, much lower prices. I think the probabilities favor a low will not be seen until a month or two from now.
Usually we are happy with our advisers etc when they help us make money. This past two weeks is certainly one of those times we should be wildly happy with all the losses our advisers helped us to avoid. So thanks to Lara and all those who post here.
I am sitting on hands in cash waiting to find opportune times to go long. It could be a ten year low like 2009.
Yes, sometime in the future a fantastic long opportunity is going to arise.
But as for me, I’m letting the CV crisis get to the “down hill” side first, because as long as it’s the uphill side, the economic hit is only increasing. While the market may at some point “over price” it in, I suspect we are a far ways from that still.
BTW the lows today are tagging my Fibonacci fitted target #1. I’m pretty darn confident that will get blown away over the next few weeks at most, days likely, and who knows, may be even today! The next one is waaaay down there at 2298.
But of course ANYTHING is possible. Wild times.
Rodney, I am so impressed with your discipline. I can only wonder where my account would now be had I simply chose to “sit on my hands”…a few more times than not. Best wishes to you.
I don’t know how to do emojis so here is a smiley face! Thanks for the compliment. Patience has not always been my standard operation procedure. But I guess I have suffered enough over the years to have learned a bit more patience.
Very well said Rodney! Happy that you choose to stay out and watch from sidelines indeed as these are tough times.
Unless you are willing to embrace the short side, in which case, these are awesome times. Though I acknowledge that the gains of those shorting comes with the pain of the common investor who listens to the Wall Street propaganda of “never sell; buy and hold, you can’t time the market”. People seem to think it’s a cardinal sin and Really Really Big Deal to go to cash. When in fact it’s the press of a button and just a few dollars in commissions…
*thumbs up
SPX needs to close above 2825 to hold multi-year support of the uptrend. If below, it might be the beginning of the bear market. At least based on the trend lines.
ES went further down but SPX seems to have held above 2728 for now
Talk about a rigged market.
I bet they don’t stop trading when it’s going up,
It’s a good thing. Helps keep the markets from going into a selling frenzy feedback loop.
Agree, it is a panic when it suits their requirements..
My understanding:
Market now shut for 15 minutes total because 7% circuit breaker hit.
If it then reaches -13%, down another 15 minutes.
If it hits total of -20%, down for day.
So it’s going to be back on in about 5-10 minutes…for a bit…
Meanwhile, TNX (bonds interest rates) down another 40%.
Oil down 21%.
GLD however is only up 0.3% per my reporting.
The world is on fire.
What is VIX at?
Gold last night was kissing $1,700 (up $22) now it is being sold as well down $5. Imminent Recession signs per market reaction.
I cannot trade – futures have been shut down and I cannot get hold of my broker
Think that will be the case with many brokers on what is likely to be another Black Monday. Would not be surprised if the markets are halted for days like after 9/11 just to stop fear setting in further and the markets collapsing.
Not necessarily a brokerage issue, the market itself is shutting down due to their circuit breaker rules.
See my post earlier re CME hours when 5% mark hit.
Futures should reopen after 830 am.
Practically, if we go below 2714, that would be officially a bear market (-20% for the top). That falls around where Lara’s bottom of wave C (invalidation lies). I guess we’ll know soon if we go in bear market or not.
And ES stopped right at 2715 so far:) Ironic:)
A view of the Fibonacci landscape underneath. Also with a 1000 day (200 week) moving average in red, and a projection of the Q4’18 correction. Note how much higher momentum this move is so far compared to that! I’ve marked what I view as the key potential pivot levels based on this. Where it eventually bottoms and renews (restarts) a bull market can’t be known, since the future is not deterministic or “pre-determined”, and hence cannot be predicted.
Screams impulsive move to the downside to me and the new leg starting up is a THREE down. I could be wrong, often am.
Here’s one more: I’ve added the “swing completion” levels that I can produce by fitting a Fibonacci structure over the price action to date since the ATH. These are the 3 blue dashed horizontal lines show, around the following levels:
– 2734
– 2295
– 1968
Each really represents a “zone” around that price level; it’s not a highly precise methodology, but my basic thesis is that every swing must demonstrate Fibonacci structure as defined ultimately by it’s concluding pivot price. This, these levels are (in my opinion) rather high potential “end of swing” levels. But I acknowledge these are being projected off pretty limited data so far. I work with what I’ve got, no more, no less.
ps: my article on Fibonacci fitting is now getting readied for publication in the May 2020 TASC magazine, just finished providing final copy edits back to them.
On interesting “validating” feature of these Fibo fitted projections: note how closely they align with the Fibo retracement and Fibo extension projections. Fibo magic at work!
Thank you kevin ….
One more comment: as Peter mentioned, there’s the potential symmetry of C down with A down. That’s pointing right at the 200 week MA around 2615 also.
I would be surprised zero to see 2615 tomorrow. And if this IS a 3 of a 5 wave impulse down, that would be a fine place for a lower degree ii up of the 4 down to initiate.
Fast times at Ridgemont High!!!!
Jeff Cooper’s call is if SPX breaks below 2860 (done!), then the expected bottom becomes 2346.
Futures are stuck at 2819 because 5% max limit is applied to any single futures session. So how does it work if market wants to go lower? We are stuck here till Tuesday then?:)
Only for the overnight session and the last hour during the day.
From CME website:
5% up-and-down limits are effective 5:00 p.m. – 8:30 a.m. CT. Sundays through Fridays; and 3:00 p.m. – 4:00 p.m. CT, Mondays through Fridays. Between 3:00 p.m. – 4:00 p.m. the 5% price limit will not be allowed to breech the 20% daily limit.
And this all before the world is REALLY in the grip of this virus folks. Now maybe that won’t happen…or maybe northern Italy is the canary in the coal mine (the second: Wuhan was the first). If lots of major industrial countries move to large scale quarantines…I believe a market crash to 1800 is possible. Remember, the market discounts only out about 9-12 months. So if it will be “much better a year from now…that doesn’t matter much. It’s the results companies are expected to put up in April, July, October and January that matter to the market, and if those are going to absolute hell…well, you get the idea. There is real potential for an epic wipe out here.
Let’s see if that teal line on the weekly holds it over the course of this week, or not.
If we are going full blown bear market now, then what count should it be? That means that we are passed 5 primary already. But then what did Lara miss in her count that we are already in multi-year correction?
She doesn’t and didn’t miss anything. If indeed this is an impulsive and motive wave down and the start of a bear market, it’s just the “much lower probability” potential becoming real. She doesn’t bother with the super low probability counts, for good reason. But there are ALWAYS very low probability high bearish (and high bullish) counts possible and “countable” within the rules. EW doesn’t predict the future; our counts are just the most likely roadmaps of the path of future price action. Sometimes surprises happen. Like an outbreak of coronavirus.
Anyone has VIX quote?
This is very worrisome as the central bank lost the hold on markets.
I’d guess the bulk of the futures activity in overnight markets in the last 2 weeks, and at this very moment, is central bank hedging of their large portfolios.
I’ve never been much of a believe that CB’s “control the market”. It’s too big for them to control. They can support certain stocks with buy campaigns, but all big money players do that. But when the devil wind starts blowing, they are as much at its mercy as the retail trader is.
Target 2600, see you there
Why 2600? How did you get yo this number? Is it the bottom of the multi-year support trend Lara refers to?
A=C….. ish,…. assuming this is C
Possible for sure.
Potentially A is just the “1”, and the “B” was the 2. And the 3 might be far larger than the “1”, as it nominally is…
And that’s likely to only be a way-station!!
As I said, that little double top at the 50% retrace level told me most all I needed to know about the B wave. The C is ROLLIN’ ROLLIN’ ROLLIN’ now!!! It’s an incredible opportunity. As long as the financial system doesn’t break…
I was skeptical of continuing wave B right at the time when ES broke uptrend channel down and never came back up while SPX still didn’t. It was already a sign.
ES – yikes!
Unless ES recovers that gap of 100 points over night, I don’t see how wave B is still in. Lower low lower high- we are most probably in wave C now. What do you guys think?
Exactly bear markets are brutal and we might have just seen one start…
Appears OPEC has collapsed. Report S.A. will be maxing production and vastly discounting their oil. Talking heads saying “$20 oil in 2020”, which is right around Lara’s target.
Hard to see how equities will rise next week in the face of further and sharper falls in oil prices. Let’s see what the overnight session brings.
Meanwhile CV now in majority of US states, northern Italy is under massive quarantine.
I’m going to start planting some deep low spreads and/or butterflies as lower risk means of dramatically capitalizing on what I think is coming. Down to 2600-2700 (the teal line) seems virtually certain to me.
Notice to members for the next week:
I am travelling in Panama on an orientation tour this week. I will probably not be able to provide updated hourly charts prior to session close during this week.
If on any day this week I am able to provide end of session updates I will do so.
I thank you for your patience and understanding. Normal bonus updates shall resume next week.
Famous quotes from history:
“We will not have any more crashes in our time.” – John Maynard Keynes, leading economist, in 1927
“I don’t believe that we will never, ever see another financial crisis in our lifetimes.” – Janet Yellen, former Fed Chair, 2017
Did Frau Yellen actually employ the double negative…??!! 🙂
https://www.google.dk/amp/s/www.foxbusiness.com/markets/yellen-i-dont-believe-well-see-another-financial-crisis-in-our-lifetime.amp
FIRST
ah, well done
THANKS,, WHATS MY PRIZE
howzabout a nice carrot, Doc?
Prize, PRIZE?? There’s no stenkin’ PRIZE!!
Just bragging rights 🙂
Or how about…a BEAR MARKET???