
A strong bounce to start the week has unfolded as last analysis expected.
Summary: There is no evidence to suggest the larger bull market is over. The current pullback is very deep and not likely to be finished yet. At its conclusion, it may present a good buying opportunity.
For the short term, a bounce or sideways consolidation may continue for wave B. Resistance may be found about 3,188. Thereafter, wave C may end below 2,812.68.
A new low below 2,728.81 would indicate a deeper correction that may end at the lower edge of the teal multi-year trend channel.
The biggest picture, Grand Super Cycle analysis, is here.
Last monthly charts analysis is here with video here.
ELLIOTT WAVE COUNTS
FIRST WAVE COUNT
WEEKLY CHART
Click chart to enlarge.
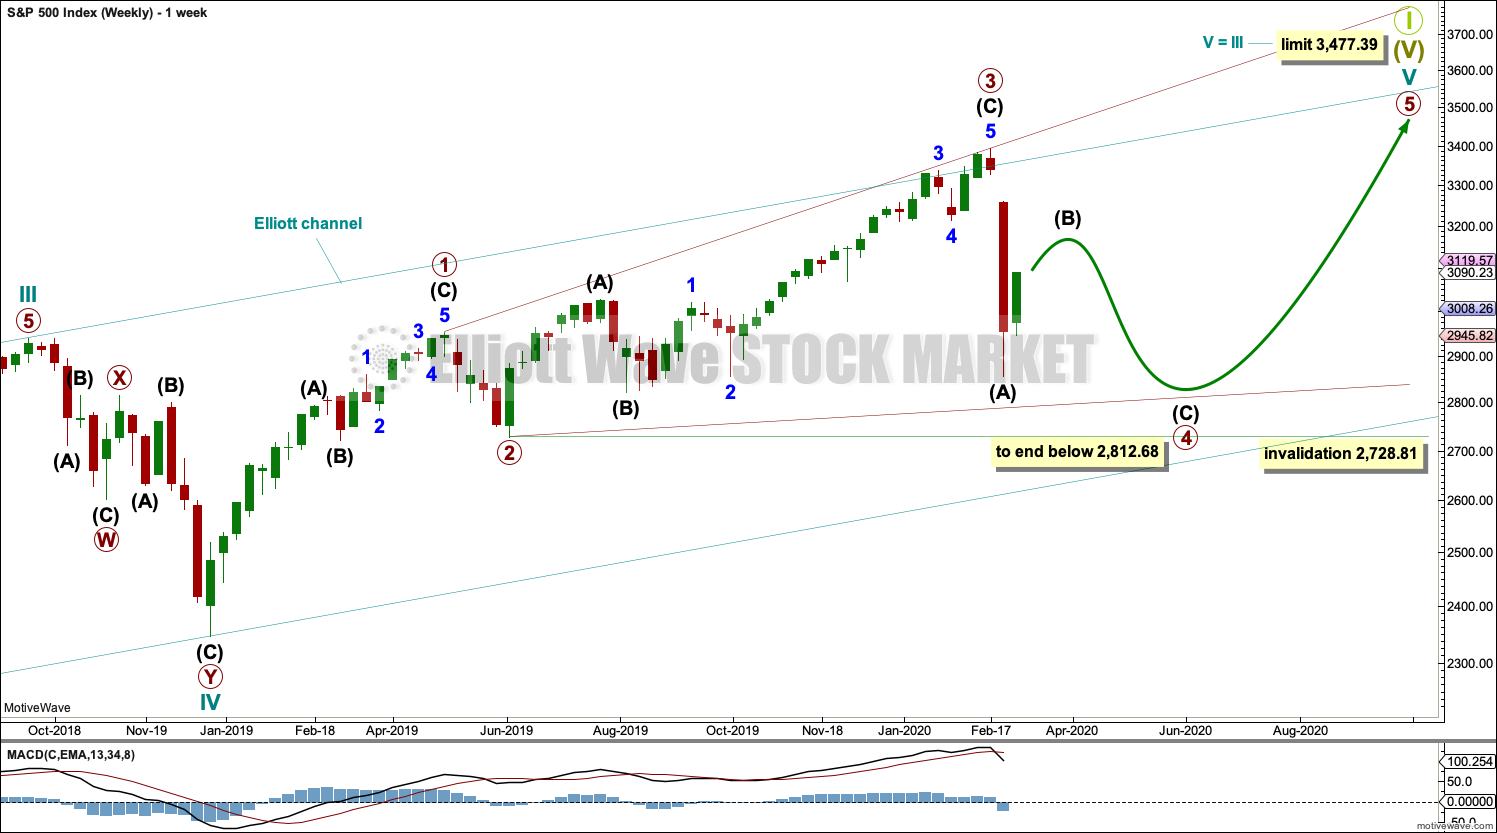
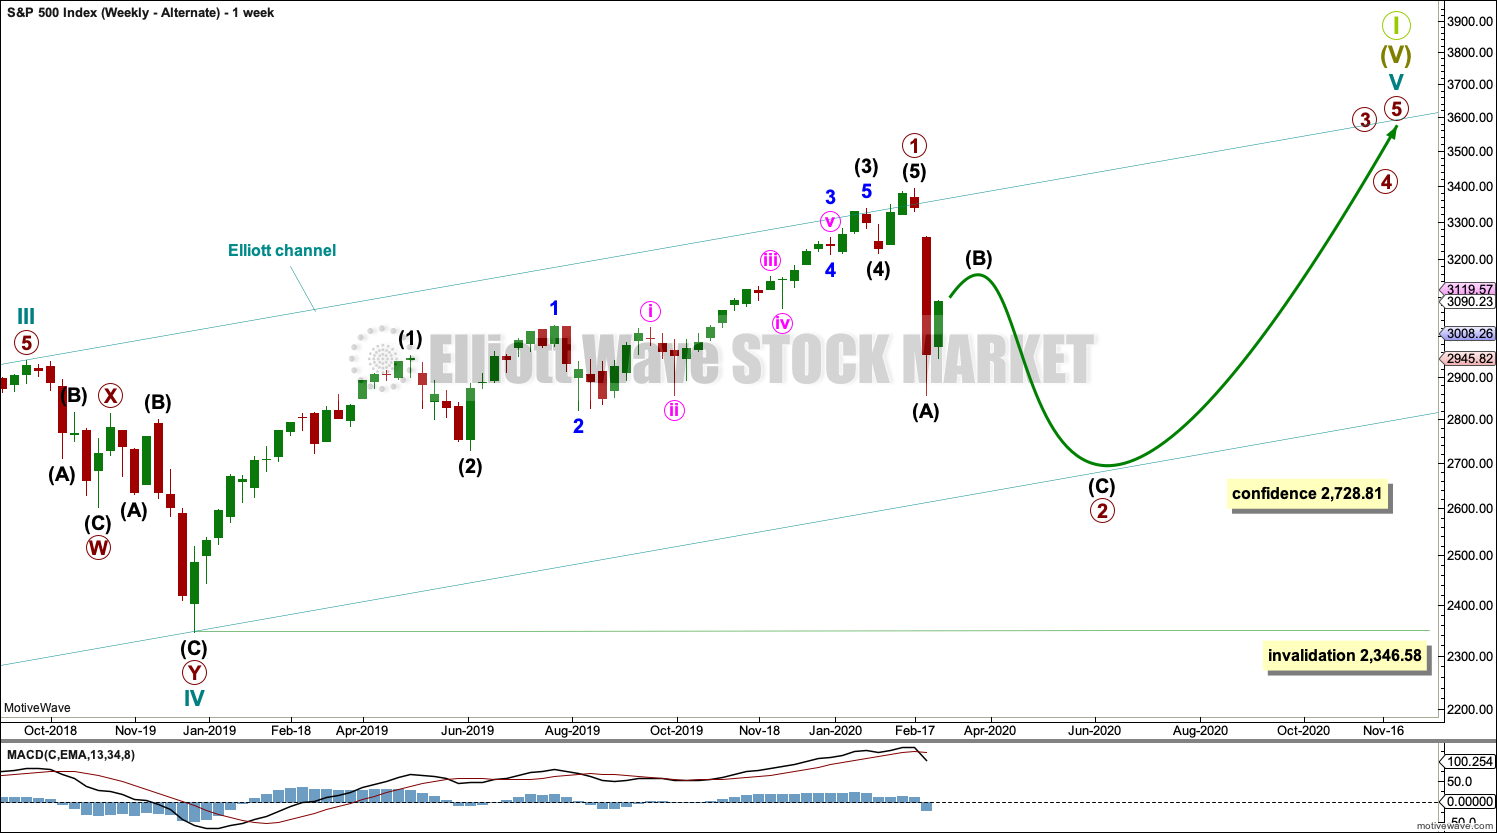
Cycle wave V may subdivide either as an impulse or an ending diagonal. This wave count considers a diagonal.
A channel is drawn about the impulse of Super Cycle wave (V) using Elliott’s first technique. Draw this channel first from the high of 2,079.46 on the 5th of December 2014 to the high of 2,940.91 on the 21st of September 2018, then place a parallel copy on the low at 1,810.10 on the 11th of February 2016. Cycle wave IV found support about the lower edge.
The middle of the third wave overshoots the upper edge of the Elliott channel drawn about this impulse. All remaining movement is contained within the channel. This has a typical look.
Within Super Cycle wave (V), cycle wave III may not be the shortest actionary wave. Because cycle wave III is shorter than cycle wave I, this limits cycle wave V to no longer than equality in length with cycle wave III at 3,477.39. A new high by any amount at any time frame above this point would invalidate this main wave count in favour of one of the two alternate monthly charts which may be seen in last published monthly analysis.
At this stage, cycle wave V may end within this year or possibly into next year.
The daily chart below will focus on movement from the end of intermediate wave (B) within primary wave 3.
Ending diagonals require all sub-waves to subdivide as zigzags. Primary wave 4 of a diagonal must overlap primary wave 2. This rule is now met. Primary wave 4 may not move below the end of primary wave 2 below 2,728.81.
This ending diagonal would be expanding. Primary wave 3 is longer than primary wave 1, and primary wave 4 so far is longer than primary wave 2. Primary wave 5 would need to be longer than primary wave 3 for all rules regarding wave lengths of expanding diagonals to be met.
Fourth and second waves of diagonals most commonly end somewhere between 0.66 to 0.81 of the prior wave. This gives a target zone for primary wave 4 from 2,954.81 to 2,855.10. However, this diagonal is expanding and primary wave 5 needs to be longer in length than primary wave 3, which was 664.71 points for this rule to be met. This rule needs to be met prior to the upper limit for cycle wave V at 3,477.39, so primary wave 5 would need to begin below 2,812.68.
DAILY CHART
Click chart to enlarge.
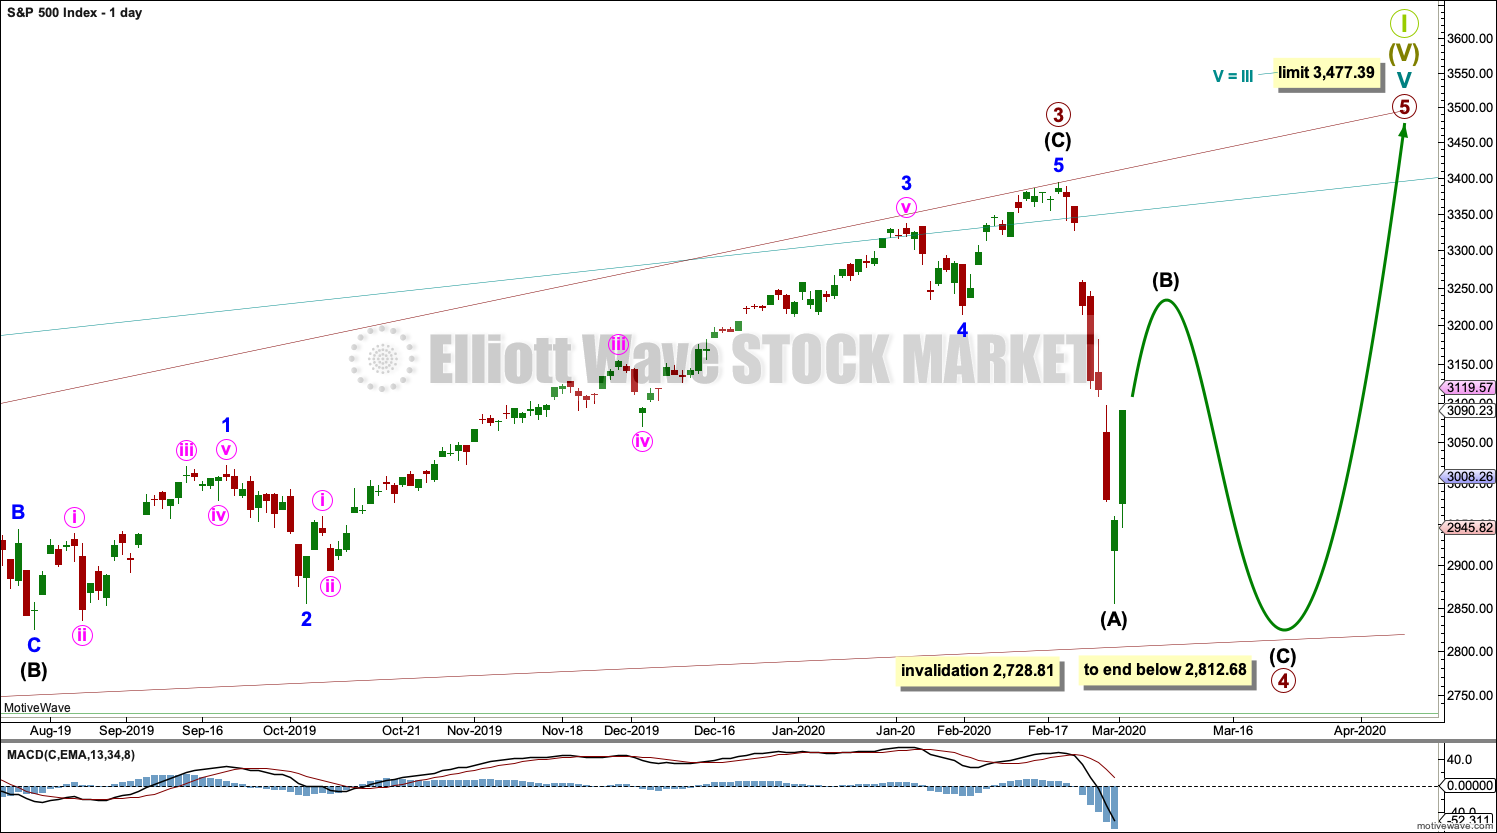
All sub-waves of an ending diagonal must subdivide as zigzags. This is the only Elliott wave structure where a third wave sub-divides as anything other than an impulse.
Primary wave 4 must subdivide as a zigzag. Within the zigzag, a sharp bounce or a time consuming sideways consolidation for intermediate wave (B) may have just begun.
Diagonals normally adhere very well to their trend lines, which may be tested within the sub-waves. The upper 1-3 trend line is tested at the end of minor wave 3 within intermediate wave (C) within primary wave 3.
Primary wave 4 may not move beyond the end of primary wave 2 below 2,728.81.
HOURLY CHART
Click chart to enlarge.
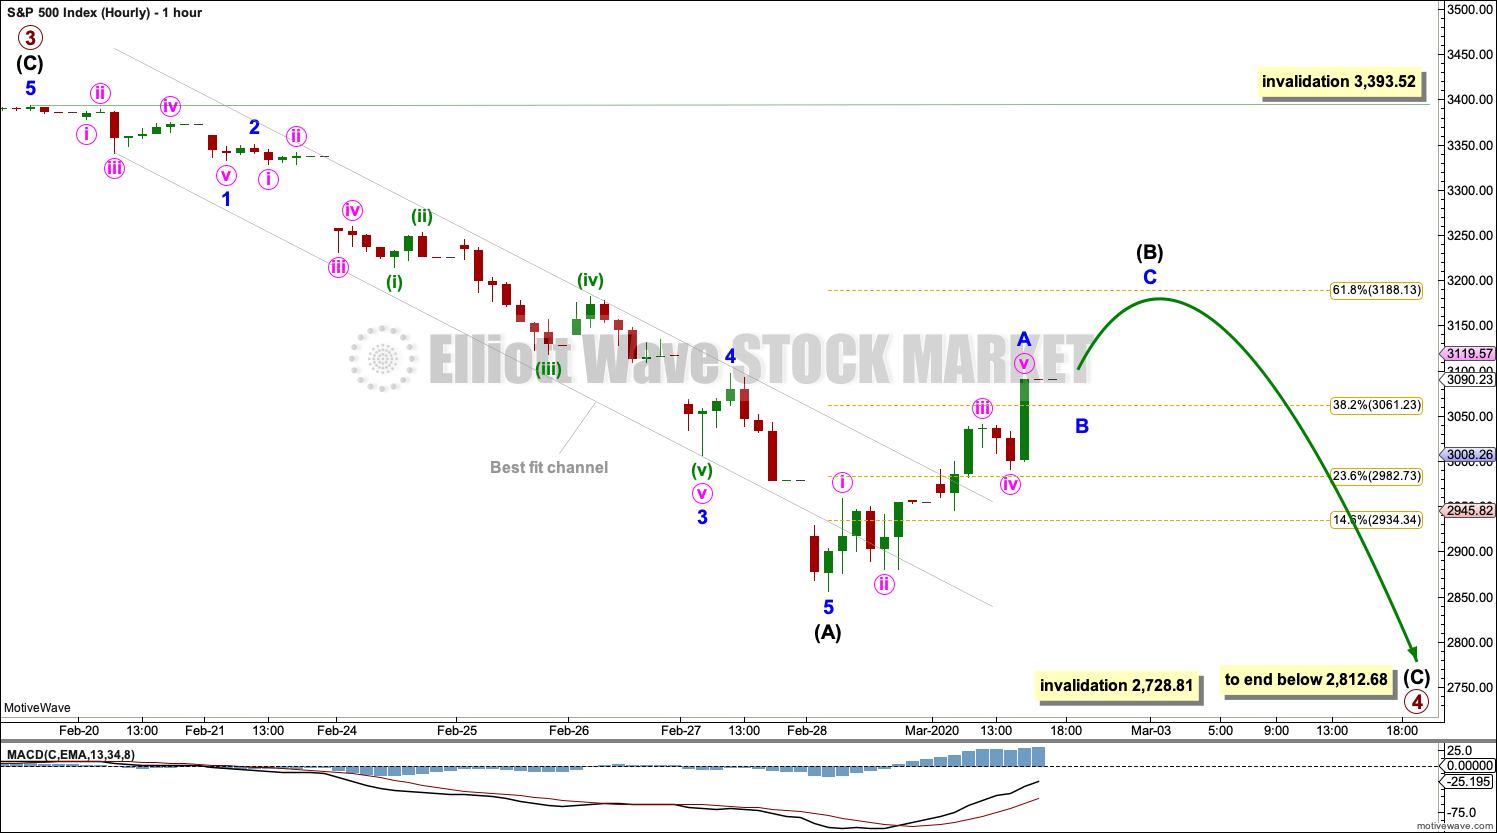
Primary wave 4 within a diagonal must subdivide as a zigzag. Within the zigzag, intermediate wave (B) would very likely show on the daily and weekly chart for primary wave 4 to have the right look. Intermediate wave (B) now shows up on the daily chart.
Intermediate wave (B) may not move beyond the start of intermediate wave (A) above 3,393.52.
Intermediate wave (B) may subdivide as any Elliott wave corrective structure. It may be a quick sharp bounce as in a single or multiple zigzag, or it may equally as likely be a time consuming consolidation as in a flat, combination or triangle. Multiple wave counts at the hourly chart level will be required over the next one to two weeks as intermediate wave (B) unfolds.
At this stage, it looks like a five wave structure upwards may be complete. This is labelled minor wave A. Subdivisions for minor wave A fit well on the five minute chart.
SECOND WAVE COUNT
WEEKLY CHART
Click chart to enlarge.
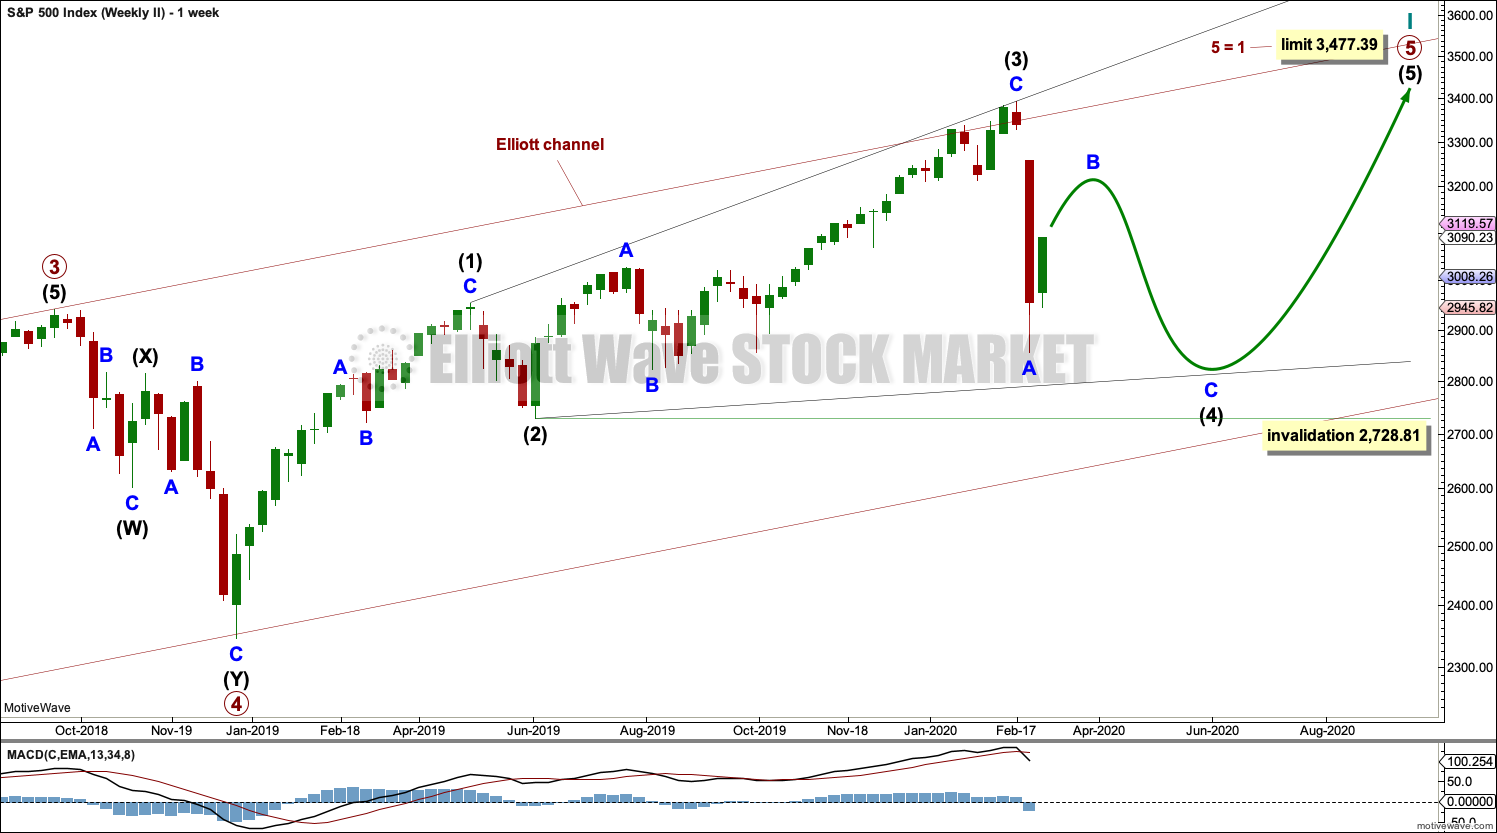
This second wave count sees all subdivisions from the end of the March 2009 low in almost the same way, with the sole difference being the degree of labelling.
If the degree of labelling for the entirety of this bull market is all moved down one degree, then only a first wave at cycle degree may be nearing an end.
When cycle wave I is complete, then cycle wave II should meet the technical definition of a bear market as it should retrace more than 20% of cycle wave I, but it may end about either the 0.382 or 0.618 Fibonacci Ratios of cycle wave I. Cycle wave II may end close to the low of primary wave II within cycle wave I, which is at 1,810.10. It is also possible that cycle wave II could be fairly shallow and only barely meet the definition of a bear market.
An ending expanding diagonal is still viewed as nearing an end. This wave count labels it primary wave 5. Primary wave 5 may still need another year to two or so to complete, depending upon how time consuming the corrections within it may be.
Primary wave 5 may be subdividing as a diagonal, in the same way that cycle wave V is seen for the first weekly chart.
ALTERNATE WAVE COUNT
WEEKLY CHART
Click chart to enlarge.
It is also possible that cycle wave V may still be unfolding as an impulse. Within the impulse, only primary wave 1 may be over at the last high.
Primary wave 1 is seen as an impulse. Within primary wave 1, there is poor proportion between the corrections of intermediate waves (2) and (4) and minor waves 2 and 4. This gives the wave count a forced look, but it is valid.
Primary wave 2 may be unfolding as a zigzag. It may find strong support about the lower edge of the multi-year teal trend channel.
Primary wave 2 may not move beyond the start of primary wave 1 below 2,346.58.
If the main wave count is invalidated with a new low below 2,728.81, then this alternate would then be used.
TECHNICAL ANALYSIS
WEEKLY CHART
Click chart to enlarge. Chart courtesy of StockCharts.com.
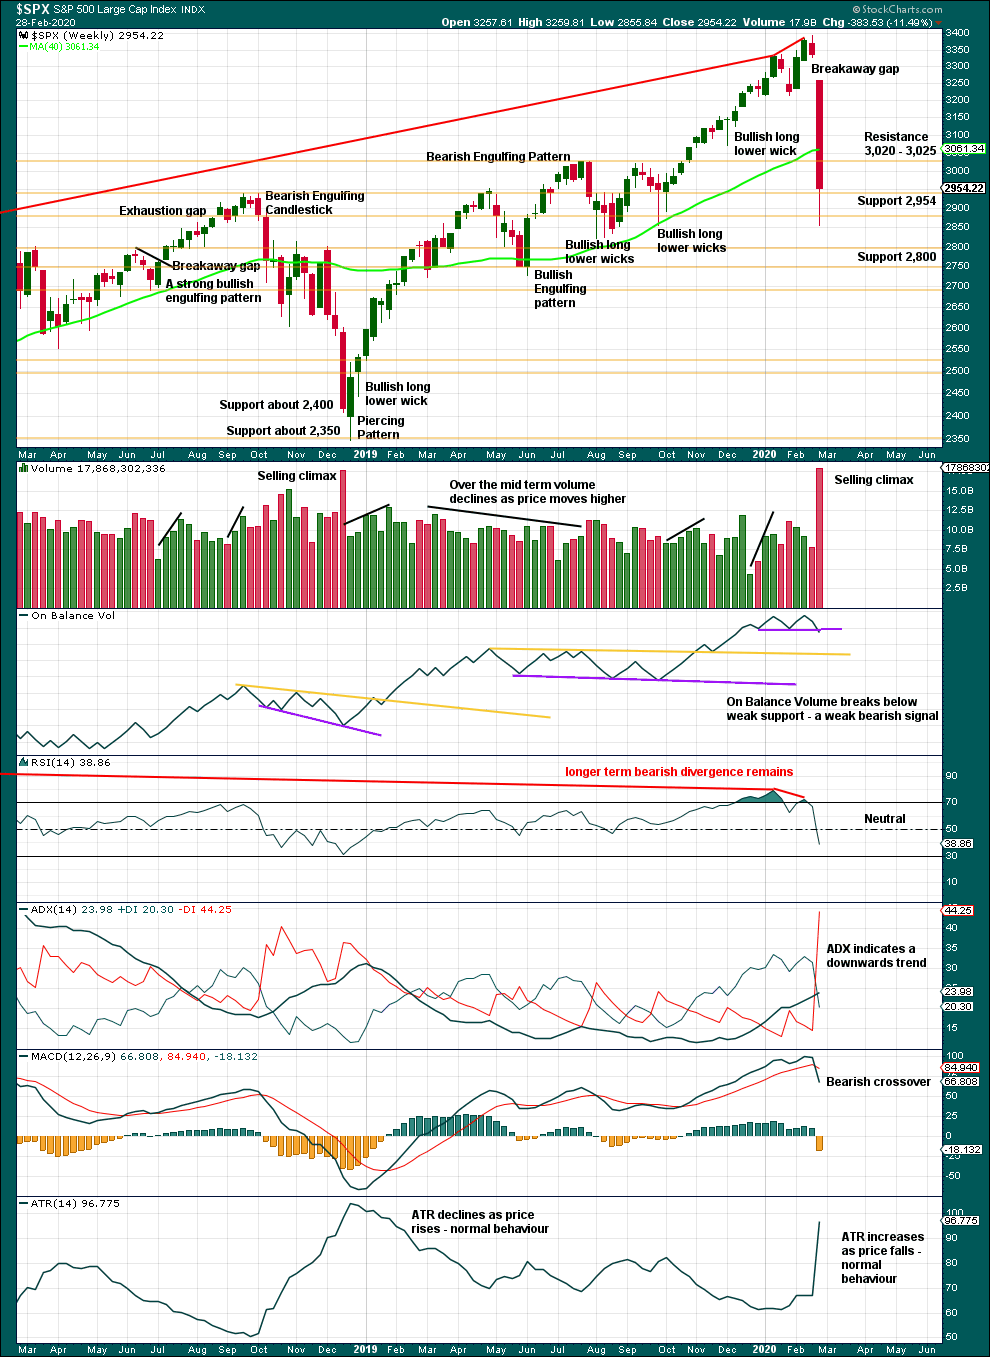
Risk of a pullback identified has been followed by a 15.8% drop in price (high to low) so far. This dramatic drop in price has precedent within the larger bull market. It does not necessarily mean the secular bull market must be over.
At the weekly chart level, conditions are not yet oversold; this pullback may be expected to continue further.
For the short term, the volume spike last week may be a selling climax. In conjunction with a bullish long lower wick on this weekly candlestick, a bounce may be expected about here.
DAILY CHART
Click chart to enlarge. Chart courtesy of StockCharts.com.
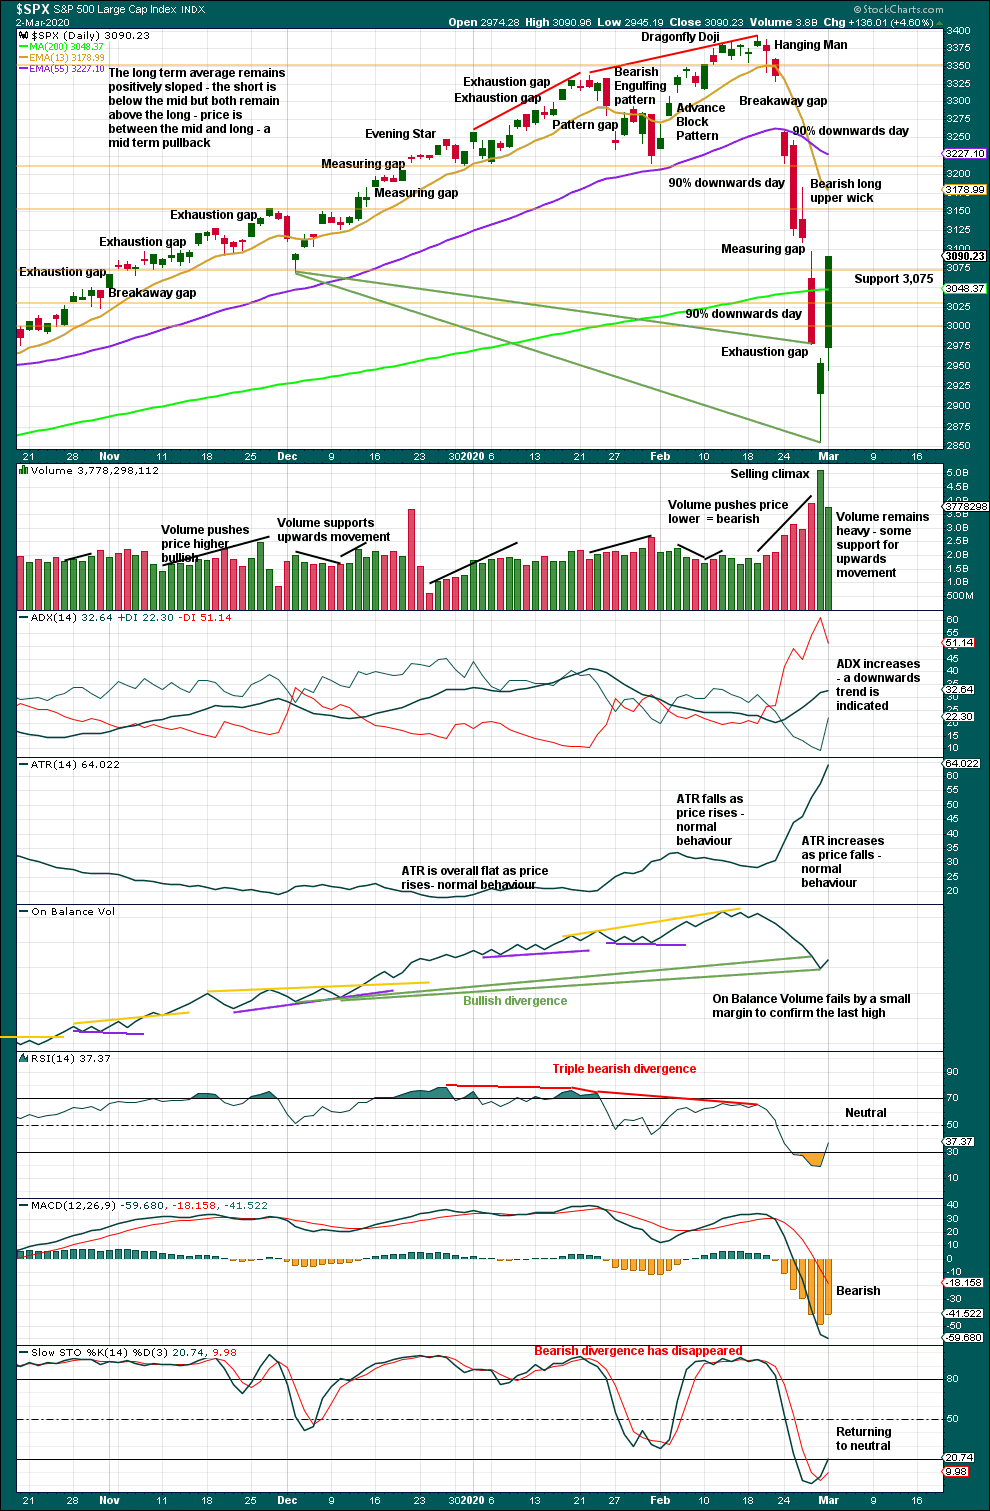
There are now three 90% downwards days in this strong downwards movement.
Following a 90% downwards day, either a 90% upwards day or two back to back 80% upwards days within 3 sessions would be required to indicate a 180°reversal in sentiment and indicate a sustainable low may be in place.
Friday’s gap is closed. It is renamed an exhaustion gap.
Price is falling faster than On Balance Volume. This divergence is bullish and suggests this pullback may be an interruption to the secular bull market.
Monday does not meet the definition of an 80% or a 90% up day. A strong close at highs for the session suggests more upwards movement tomorrow.
BREADTH – AD LINE
WEEKLY CHART

Click chart to enlarge. Chart courtesy of StockCharts.com. So that colour blind members are included, bearish signals
will be noted with blue and bullish signals with yellow.
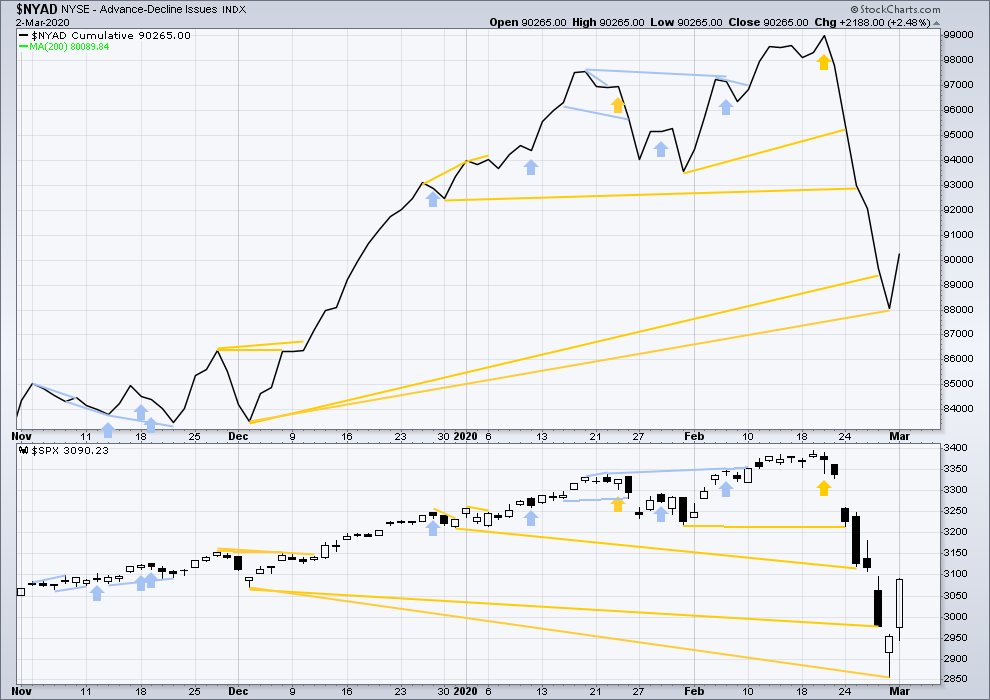
Bear markets from the Great Depression and onwards have been preceded by an average minimum of 4 months divergence between price and the AD line with only two exceptions in 1946 and 1976. With the AD line making new all time highs with last all time highs from price, the end of this bull market and the start of a new bear market is very likely a minimum of 4 months away, which is mid June 2020.
In all bear markets in the last 90 years there is some positive correlation (0.6022) between the length of bearish divergence and the depth of the following bear market. No to little divergence is correlated with more shallow bear markets. Longer divergence is correlated with deeper bear markets.
If a bear market does develop here, it comes after no bearish divergence. It would therefore more likely be shallow.
Last week price and the AD line have both moved lower. Price has made new lows below the prior swing low of the week beginning 2nd December 2019, but the AD line has not. Price is falling faster than market breadth; breadth does not support this fall in price. This divergence is bullish and fairly strong, and it supports the new Elliott wave count.
Large caps all time high: 3,393.52 on 19th February 2020.
Mid caps all time high: 2,109.43 on 20th February 2020.
Small caps all time high: 1,100.58 on 27th August 2018.
DAILY CHART
Click chart to enlarge. Chart courtesy of StockCharts.com. So that colour blind members are included, bearish signals
will be noted with blue and bullish signals with yellow.
Breadth should be read as a leading indicator.
Bullish divergence has been followed by a strong upwards day. Today both price and the AD line have moved higher. There is no new divergence.
VOLATILITY – INVERTED VIX CHART
WEEKLY CHART
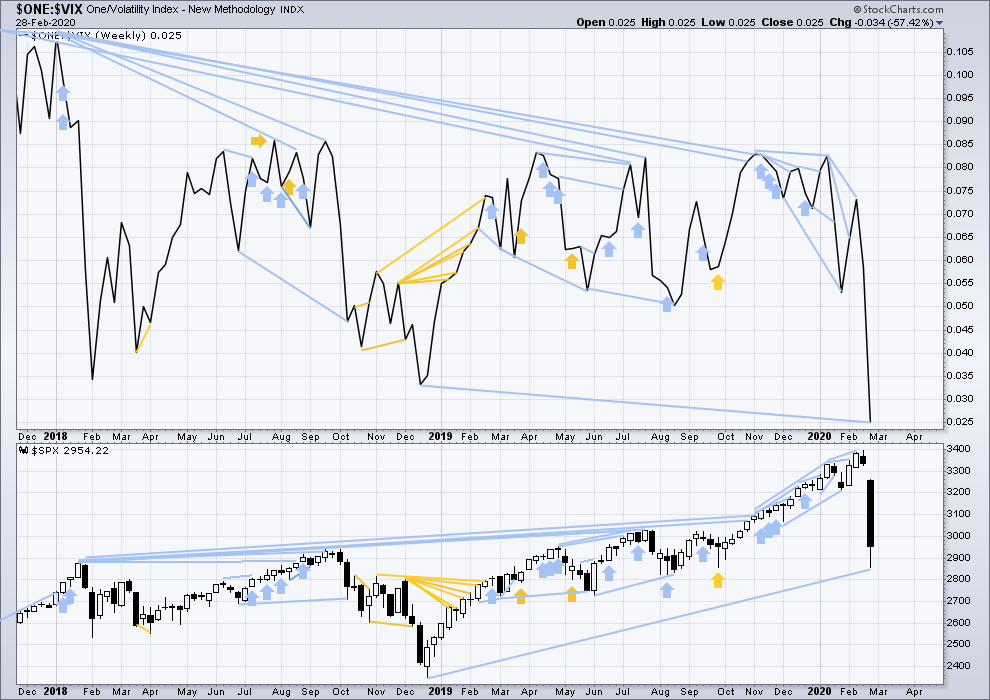
Click chart to enlarge. Chart courtesy of StockCharts.com. So that colour blind members are included, bearish signals
will be noted with blue and bullish signals with yellow.
The all time high for inverted VIX was on 30th October 2017. There is now over two years of bearish divergence between price and inverted VIX.
The rise in price is not coming with a normal corresponding decline in VIX; VIX remains elevated. This long-term divergence is bearish and may yet develop further as the bull market matures.
This divergence may be an early warning, a part of the process of a top developing that may take years. It is clearly not useful in timing a trend change from bull to a fully fledged bear market.
Last week both price and inverted VIX have moved lower. Inverted VIX has made new lows below prior lows of weeks beginning 17th / 24th December, but price has not. Inverted VIX is falling faster than price. This divergence is bearish. Because this disagrees with the AD line, it shall not be given weight in this analysis.
DAILY CHART
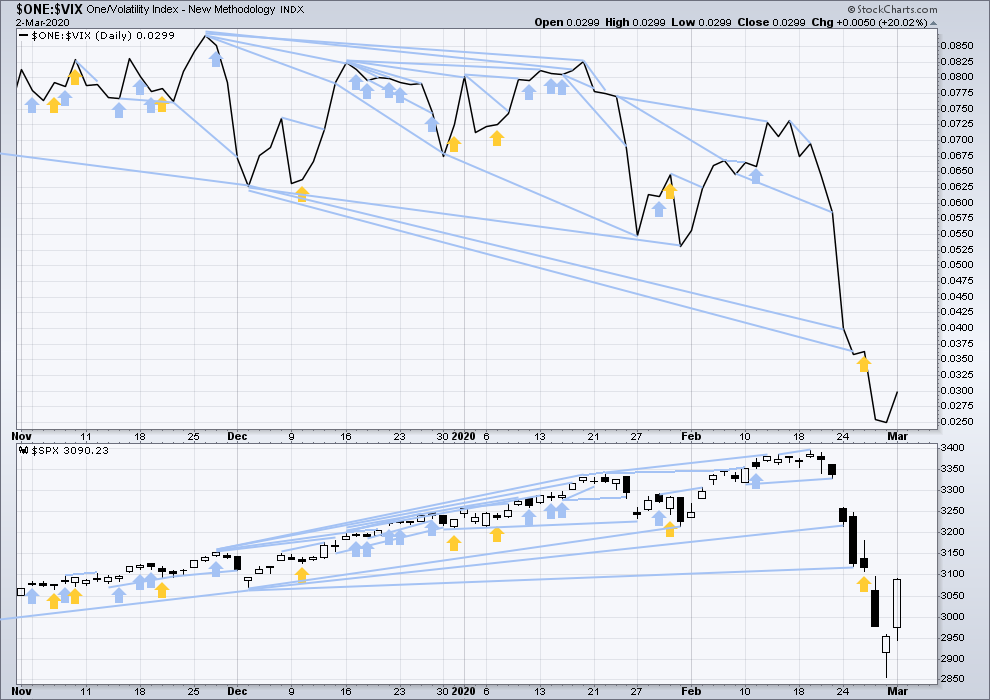
Click chart to enlarge. Chart courtesy of StockCharts.com. So that colour blind members are included, bearish signals
will be noted with blue and bullish signals with yellow.
Both price and inverted VIX have moved higher today. There is no new divergence.
DOW THEORY
Dow Theory would confirm a bull market if the following highs are made:
DJIA: 26,951.81 – a close above this point has been made on the 3rd of July 2019.
DJT: 11,623.58 – to date DJT has failed to confirm an ongoing bull market.
S&P500: 2,940.91 – a close above this point was made on the 29th of April 2019.
Nasdaq: 8,133.30 – a close above this point was made on the 26th of April 2019.
Dow Theory would confirm a bear market if the following lows are made on a closing basis:
DJIA: 21,712.53
DJT: 8,636.79
S&P500: 2,346.58
Nasdaq: 7,292.22
Published @ 07:13 p.m. EST.
—
Careful risk management protects your trading account(s).
Follow my two Golden Rules:
1. Always trade with stops.
2. Risk only 1-5% of equity on any one trade.
—
New updates to this analysis are in bold.
what group of capable, market moving buyers would actually be willing to go long right now. as covid test kits go out, the news will only get worse before it gets better. let’s say you believe In the rate cut, you believe that covid will pass. still no reason to put your money to work today or even tomorrow. -Rishi no last minute fed injection at the close? are you counting on them at tomorrow’s open? I think Vernes trickster bankers are ready to gobble up any money the fed wants to inject. I also like Kevin’s idea that they will force hands in the overnight market and we are certainly looking at a gap open one way or the other as it seems they find so much pleasure in trapping traders on one side or the other. a lot of main street Joe’s n Jane’s were paralyzed by the market action and are waking up to take moves and I think those moves will be fear driven. I think when you get out of the daily traders circle and into the main streets, the idea to hold on to what you have is more powerful than the greed of wanting more. Im short overnight and sweating the hell out of it because Lara is usually right.
If you are short this market and not leveraged, don’t sweat it.
Something happened today that was epochal.
The banksters all slithered out of their pits and loudly announced that they were “ready” to do whatever was needed to keep this bubble from bursting.
Mr Market responded with stentorian voice that every trader paying attention heard loud and clear: ” Your days of market manipulation are OVER!!”
You just watch what happens next….!
Back over 3K. Right on schedule!
Now let’s get that final wave up to scatter the cubbies, and then….and THEN…AND THEN…!!!
Well, you know what…
See ya in the trenches. And wash those hands people!
Also, lots of viatamin D and Zinc lozenges will help you ward off infection.
I am not a doctor of medicine but I have a few friends who are…’bye for now…! 🙂
p.s. … and one more thing. We should see VIX bearish divergence on the last move up, so pay attention!
All indications show a massive sell off in the futures with the Asian open. Could be wrong
That will be slap in the face for FED action today….possible head fake ahead of massive squeeze being setup…maybe
Possibly but ES has B as an expanding flat as in SPX. Either ended or ending.
If so then wave C of (B) up to come.
Did you guys see that eager beaver that tried to hammer VIX this morning and had his wings promptly clipped??!! Dummy! Lol!
The pattern would be absolutely PERFECT with a C up….
Whatever happens, all roads lead to the “dark side”…
O.K.
Expect a good old fashioned dog-fight complete with flying fur for re-capture of 3000.00.
If the bulls fail….
“Farewell and Adieu, to You Spanish Ladies…!”
Even if it closes above 3K today, the price action penetrated through the trend channel and didn’t stop there. It doesn’t seem like a fake break. I might be wrong, but it doesn’t look good so far.
The market is bouncing between 23.6 and 50 fib levels, but definitely shows bias downwards.
Clearly, but they are not going to make it easy. Look for them to “shake the trees” and dislodge weak hands on the short siide…but you knew that! 🙂
These are the kinds of situations that give you ITCHY TRIGGER FINGERS! (ITF) hehe!
My itchy trigger finger will short SPX/SPY MORE (already have some size on for me) at below 2990…
And I’m building a small pile of RUT puts as well as it drops.
I also could not resist the call of the wild, lol!
Picked up a few 290 strke calls expiring tomorrow for a buck.
Will exit short leg of my put spread if we close below 3000.00 Gidyap! 🙂
The line in the sand is 3000 on close…
Looks like a larger contracting B wave triangle……
Stats on recent (20 yr.) inter-meeting Fed rate cuts:
https://www.marketwatch.com/story/heres-what-history-says-about-stock-market-performance-in-past-instances-when-the-fed-delivers-a-shock-interest-rate-cut-2020-03-03
I’m seeing this B correction as still ongoing
Interestingly, the second ABC will be equal to the 1st at about 3176, close to a Fibo for the retracement of last week’s drop.
There should be a good short entry point in the 3170s / 3180s (about 100 points higher than current level), so we just need to count the waves in the final C…
My view. Key fibo levels are 3190 (61.8%) and 3275 (76-78%).
Exactly!
Much upside still in the cards, but 2 upcoming great trades:
1/ short to play wave C down. Maybe short in the 3175/3200 zone, if stopped, short in the 3270s.
2/ long at new lows to play wave V up. This trade has a great entry point and stop (new lows & bottom of 2), so it’s a no-brainer
Just don’t get long too early. Because if in fact it turns out that 40%+ of world’s population gets this virus, this is not a 2 down. This is the start of an epic bear market. In my opinion. (I am often wrong.)
I agree my friend, this could be a virus inspired third down….
I think the higher retracement is a good possibility. I am looking for them to mount a valiant effort to claim 3200, and perhaps even manage a daily close above it…but not for long I suspect…
I am thinking wave C down will start in the overnight session with a big opening gap down for the daily session making it difficult for the traders to get on board.
totally agreed
Unless it launches today. Which is very possible. This “no reaction” to a 50 pt rate cut is SCREAMING “will go down soon, and hard”. It’s almost surreal. The Fed and treasury types must be quaking in their boots right now (and busy distributing their personal shares!!!).
I will not be surprised by major selling before the close today. Not confident of it, just not surprised. I know our B wave structure is not “fulfilled” as counted. But EW doesn’t predict the future. “Keep and open and flexible mind…”
Bought RUT puts (Apr 20, 1400 strike), up a fair amount almost instantly. RUT is looking sick.
Market had hard time breaching multi-year trend line at 3080-3090 (it bounced right off it). Now it’s testing the lower support line of the new trend channel. If it breaks it on an hourly and doesn’t come back within next hour after that, then it is possible that overnight scenario you just mentioned might easily play out.
Uh Huh…! Typical!
Mr. Market’s reaction to the FED panic rate cut is ominous.
The FED…is DEAD!!!
Rate cuts will do little to nothing to effect the (potential) massive business slowdown coming/starting.
yea, normally a 50 pt rate cut would send the market into the stratosphere!
What are they going to do after the first negative quarter GDP print??!!!
I think we just saw a guarantee of furutre negative interest rates in the U.S., something I once thought would never happen….
FED repo action is crazy $100 billion issued at 8:45AM today…careful time indeed… expecting action to pickup shortly
Sure looks like a B wave top to me. Could reverse back up but frankly I’d be surprised.
On the daily chart now showing Dark Cloud Cover candle.
I have to laugh…100 point swings in SPX in just a few minutes now routine!!!
IMO (I could be wrong and I often am) this is the short opportunity of a lifetime.
I recall mid last week when we saw a rebound in SPX during the early part of the day only to loose 100 plus points at close…today might be a reverse of the same in the works. They will mess with technical till the last minute otherwise they don’t have the edge.
Move down needs to hold 2990.44 and preferably close back above the 3000 Maginot Line…..
I’ll label this move down as the end of an expanded flat for minor B
Thanks for the update in real-time!
Implies a whole ‘nother impulse up to go…
I’ll be bailing on my short at break even if price pushes up then…and be ready to try again higher prices…oops!!! Out for $50 profit…back to the drawing board!
Updated hourly chart:
depending on my schedule today I’ll maybe also do another update in the afternoon, but I do have a bunch of stuff to do to prepare for the next leg of my journey to Panama
While intermediate (B) is labelled as nearing completion, it also needs to have an alternate where the degree of labelling is moved down one degree to consider a triangle / flat / combination taking longer. That’ll be in today’s analysis.
In short, this is a B wave. It could be a quick sharp zigzag, but equally as likely it could be a time consuming sideways triangle / flat / combination. It’s impossible to tell which it is until it’s over or some time after that. Which is equivalent to a classic analysis approach of waiting for the breakout before having confidence that the bounce or consolidation is over.
Thanks Lara! Enjoy the Panama Panorama!
Premium on SPY 312 strike calls expiring tomorrow a hefty 3.75 ask 3.66 bid…that is rich…!
Boy that is one spindly daily dragon-fly…!
Verne – It is very interesting to see FED rate cut by 0.50 % and markets down….I suspect with additional liquidity added today..tree is being shook before big players jump in. Market drop to negate FED action will be a very bad sign.
Yes indeed, Rishi. I know a lot of traders were watching keenly to see how Mr. Market would react and we kinda suspected a 50 basis point cut was in the making. The response was ominous in the extreme. The FED has lost control, and now everyone knows it…buckle up…! 🙂
I need to make a short announcement. BREAKOUT. I live 350 miles from Seattle. Last evening we had 3 person who tested presumptive positive for corona virus in our county. My daughter is an RN and she has cared for one individual while being exposed herself. She has not cone home last night. CDC is on the way to confirm the cases. In any event, I wanted all of you to know, the virus is nowhere near containment in US. Fear is about to explode in US.
The persons were at a casino and resort near our town. It closed yesterday. But everyone there, 100’s of people, were all potentially exposed. They have scattered throughout the tri-state area.
Prayers for the safety of your family Rodney.
It’s going to get crazy. This market going up here is crazier still…if ever I believed in market manipulation, it’s now. Jack it up to distribute at higher prices by the Big Money, before the real market collapse starts. I guess that’s the general nature of B waves, though.
Thank you, we need prayers. My community will be upside down in the next few hours.
US containment at this point is a pipe dream, and CDC knows it.
I guarantee that behind closed doors the strategy is now mitigation.
Take good care of yourself and your family Rod and praying for you bud…
Thanks. When it happens to you, it is much different than reading about it. Gotta go. Have a great day. BTW, another daughter, a 1st lieutenant in US Army, leaves for a deployment in Kuait this week. She is in Army Intelligence. We pray for no wars!
Best of Luck w/everything Rodney. We are all thinking of you.
Take Care…
ES showing a different pattern than cash. ES is still in a sideways consolidation pattern from which it should break higher in sync with cash C up…both already at next round number target of 3100. A close above brings 3200 into play.
Moving contingency stop up to any CLOSE below 3100.00
I am expecting 3,200 levels soon based on huge liquidity added By FED. Your thoughts.
All major averages tagging key Fibo levels: RUT at 38%, SPX and NDX at 50%. And stalling/turning for at least the moment.
Stalling or turning or could it be consolidating
I think it is possible to see an extended third wave with completion of a five up for A this morning. If correct, we need a corrective B in three, than another five up for C to complete the corretion.
The big question is whether we just finished only the A wave up and just starting the B wave down or that’s all she wrote. I suspect the former and I expect VIX will let the cat out of the bag with a gap higher if we have a C wave down unfolding…
UVXY bull flag targeting above 30 on next wave down….
Last leg of B wave – maybe Verne is right – we might be ending B wave today.
If wave B does end today Lara indicates resistance at 3180. So it could be far north than that
So far reached 50% retracement. Might be going to 61.8%, I suppose or close to 3200, but probably not today. We’ll see
Opening “stink bid”on Diamond 270 calls expiring Friday for 1.50, current bid at 2.99….
Missed it on the initial move down….Rats!
A top Harvard infectious disease expert estimates 40-70% of the worlds population will be infected with CV (based upon “models”). Also that this is already about 10x broader than SARS already and isn’t really comparable at this point. Search for “U.S. preps for a pandemic as coronavirus claims 6 lives in Washington state” to find a CBS news interview of him.
He points out that many infected have virtually NO SYMPTOMS (ever). I wasn’t aware of that.
That is the scary thing about this animal. You can be asymptomatic and still infect people around you. This is really bad imho and a real game-changer….
I love triangles.
They tend to be quite predictable and offer high probability trade set-ups.
Just eye-balling this one looks like a thrust up to around 3300 could be in the works.
We may turn just below, or after an intra-day breach, as the round number proves resistance….
Up too 3300 won’t be completion of wave B today. However I’m liking that round number your eyeing. Thsnkyou for the welcome Verne. Happy trading
Looks like we have some kind of B wave triangle unfolding.
It is a rare event to see VIX printing green in the middle of an upward corrective wave. We after all “should” have a C wave up still on deck. If VIX stays green through this possible B wave and continues higher along with the market during the C wave….
“Farewell, and Adieu, To You Spanish Ladies…!”
Hopefully we get a B wave completion today. The next sharp dive in VIX is going to be one of the best long vol trade set-ups in years….
How are youse guys playing it? The C wave down I mean, not necesssarily long vol… 🙂
April expiry SPY puts and put back ration spreads for me.
I had a great trade on Diamond 272 puts on the last wave down.
Those babies went from 7.50 the Friday before the plunge to a 25.00 bid!
I am getting that feeling of Deja Vu all over again! 🙂
The G7 announcement that they are “ready” to take action is uproarously funny!
Does anyone know why…? 🙂
Verne
I saw the announcement. Do you read it like me. Yes prepared to take action with regards to fiscal stimulus but things are all not that bad.
I’m hoping for another bounce well into 3100. Let’s see how the open plays out
Hu nberadis, and welcome to the forum.
I found the announcement amusing in view of of the fact that we all know exactly what they have ALREADY been doing…!
I like TOS as a trading platform for its amazing charting features…a skill I sadly lack…
Welcome and TOS response was meant for pflamini who posted below…too much multi-tasking…! 🙂
I’m asking myself why they even bothered to announce they were even having a meeting
Gates article:
https://www.nejm.org/doi/full/10.1056/NEJMp2003762?utm_source=newsletter&utm_medium=email&utm_campaign=newsletter_axiosam&stream=top
It is understandable why some initially dismissed the the threat of Covid 19 as being no worse than the seasonal flu. There was after all, a slew of mis and dis-information being thrown around by supposedly respectable sources, and unless you talked to experts in the field, it would have been easy to fall for the propaganda. Frances Boyle here at U of I sounded the alarm early. It is mind-blowing how some still insist on down-playing what is going on and comparing this to the flu. Not good. Bill Gates has an interesting article in the current NEJM.
My one point of disagreement is his reporting of the infection and mortality rate. The fact is we do not have this information. The epicenter of thr outbreak, Wuhan City in Hubei Province, has been absolutely locked down by the CCP, who continue to lie about casualties. Wuhan is mostly dark, as evidenced by recent evening video from the city. Where are all the people? China’s skies are clear for the first time in decades. An 80% worker return rate is preposterous and factories remain idle.
Kevin should re-post yesterday’s protocol in case some missed it. Be careful everyone…
Hi all. I’m new to this awesome community.
I was wondering if you guys would share what trading platforms you use and the pros and cons about them.
…if it’s not too much trouble…?
Much appreciated
I use thinkorswim for all my analysis (I keep a balance of $10 in it to assure they never close my account), and I use interactivebrokers for all my actual trading for lowest cost commissions reasons (and I’m never had a problem with them re: security or support or significant software issues).
I tried motivewave for analysis but really only cared for the ease of EW work. Everything else, not so much for me, and these days I just don’t bother with it.
Thank you. Interactive Brokers seems to be the main go to. 🙂
https://www.zerohedge.com/markets/shanghai-accord-20-powell-mnuchin-lead-tuesdays-eme
https://www.zerohedge.com/markets/shanghai-accord-20-powell-mnuchin-lead-tuesdays-emergency-g-7-coronavirus-call
Note that (a) rate cuts take months to affect the economy and (b) if the economy is slowing dramatically because cities/countries are in some kind of lock down mode, people aren’t going to work, etc., more money sloshing around doesn’t really do much for business bottoms lines. You can stimulate demand but that doesn’t do much if the problem is supply!!
Thankyou
Updated Bitcoin analysis is publicly available over at Elliott Wave Gold here.
Thank you Lara.
Just took a fresh small position (always small in this beast!!).
Lara will you still be doing your pre market close summary while in the US?
Thanks
Peter
Mostly. I didn’t manage it today I know, but I should be able to do it most days.
Next week I’ll be in Panama on an orientation tour of the country and so I don’t think I’ll be able to do it then.
The timing is horrible I know, but this was booked months in advance and I can’t change it now.
No worries – all good.
I noticed there will be an important conference call tomorrow 7am eastern . Could move the market significantly.
Morning/afternoon.
Would you care to elaborate
g7, Mnuchin,Powell , etc to discuss coordinated financial effort to counter Coronavirus crisis. 7am tuesday. check out article on Zerohedge
come on Doc, throw us a bone. Don’t leave us hangin!
Thanks Doc. You’re right, it could be a mover.
First
Crazy day… 2
hey,, im turd
Maybe the last shall be first…
Hope that doesn’t put you in the dumps, Doc…
Or leave you bogged down.