
Downwards movement continued for Friday as last analysis expected. While this fall in price this week has been dramatic, it should be viewed in the larger context of the bull market that began in March 2009. Analysis of the current pullback in context of recent prior movement suggests this may be not much different from prior deeper pullbacks within the secular bull market.
Summary: There is no evidence to suggest the larger bull market is over. The current pullback is very deep and not likely to be finished yet. At its conclusion, it may present a good buying opportunity.
For the short term, a bounce or sideways consolidation may begin for wave B. Thereafter, wave C may end below 2,812.68 but not below 2,728.81.
The biggest picture, Grand Super Cycle analysis, is here.
Last monthly charts analysis is here with video here.
ELLIOTT WAVE COUNTS
FIRST WAVE COUNT
MONTHLY CHART
Click chart to enlarge.
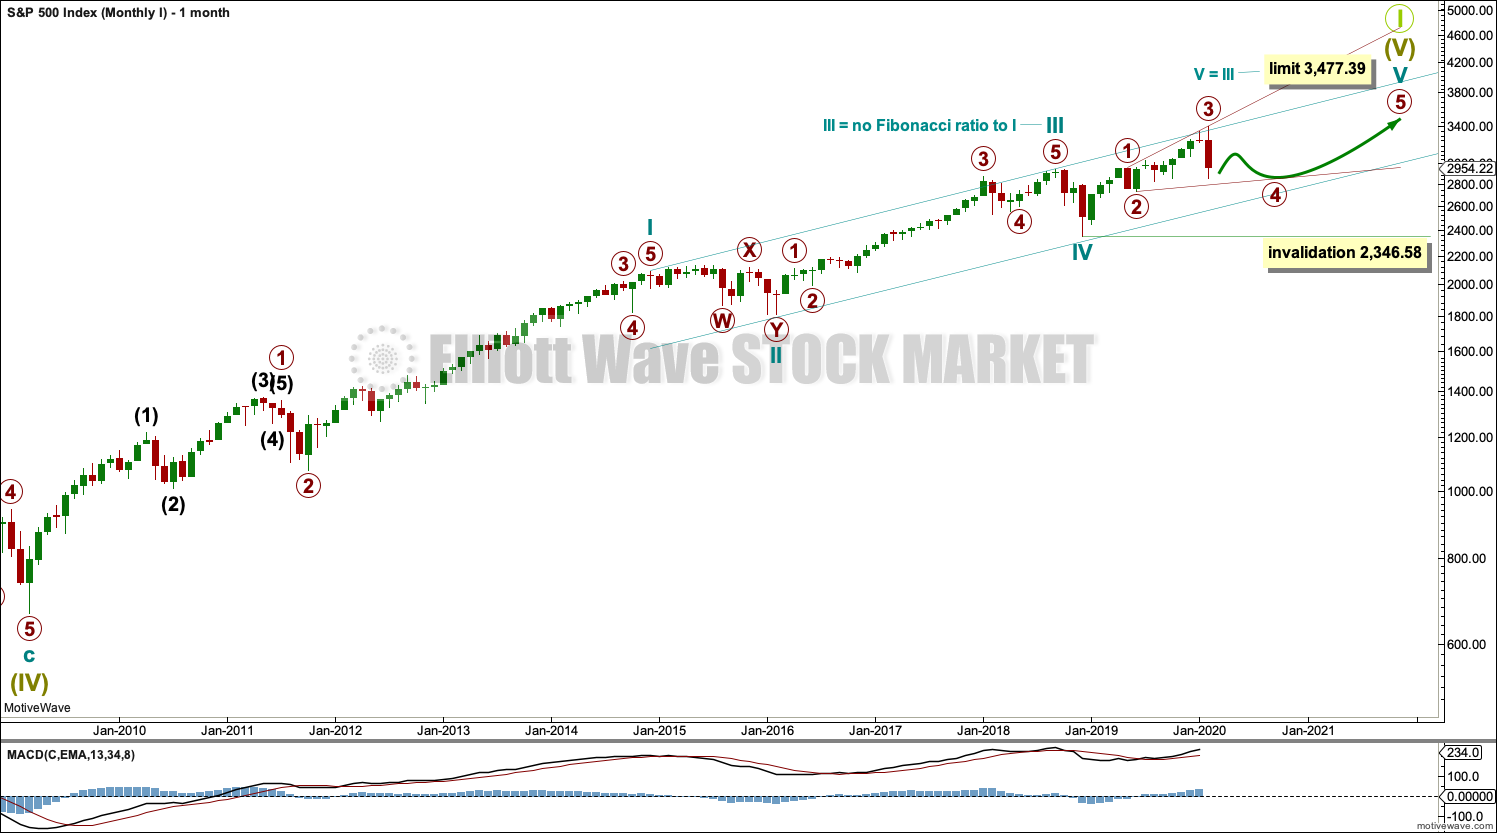
Super Cycle wave (IV) completed a 8.5 year correction. Thereafter, a bull market began for Super Cycle wave (V). The structure of Super Cycle wave (V) is incomplete. It is subdividing as an impulse.
A channel is drawn about the impulse of Super Cycle wave (V) using Elliott’s first technique. Draw this channel first from the high of 2,079.46 on the 5th of December 2014 to the high of 2,940.91 on the 21st of September 2018, then place a parallel copy on the low at 1,810.10 on the 11th of February 2016. Cycle wave IV found support about the lower edge.
There is perfect alternation between a shallow time consuming combination for cycle wave II and a deeper and more brief double zigzag for cycle wave IV. The speed and depth of cycle wave IV makes these two corrections look like they should be labelled the same degree. This wave count has the right look.
The middle of the third wave overshoots the upper edge of the Elliott channel drawn about this impulse. All remaining movement is contained within the channel. This has a typical look.
Within cycle wave V, no second wave correction may move beyond the start of its first wave below 2,346.58.
This wave count expects MACD to begin to exhibit divergence with price as price makes new highs. Cycle wave III may exhibit strongest momentum and cycle wave V may exhibit some weakness. Price is making new highs, but MACD has not. This remains the main wave count.
Within Super Cycle wave (V), cycle wave III may not be the shortest actionary wave. Because cycle wave III is shorter than cycle wave I, this limits cycle wave V to no longer than equality in length with cycle wave III at 3,477.39. A new high by any amount at any time frame above this point would invalidate this main wave count in favour of one of the two alternate monthly charts which may be seen in last published monthly analysis.
This wave count agrees with MACD. Cycle wave III exhibits strongest momentum, and primary wave 3 within cycle wave III exhibits the strongest histogram within MACD.
WEEKLY CHART
Click chart to enlarge.
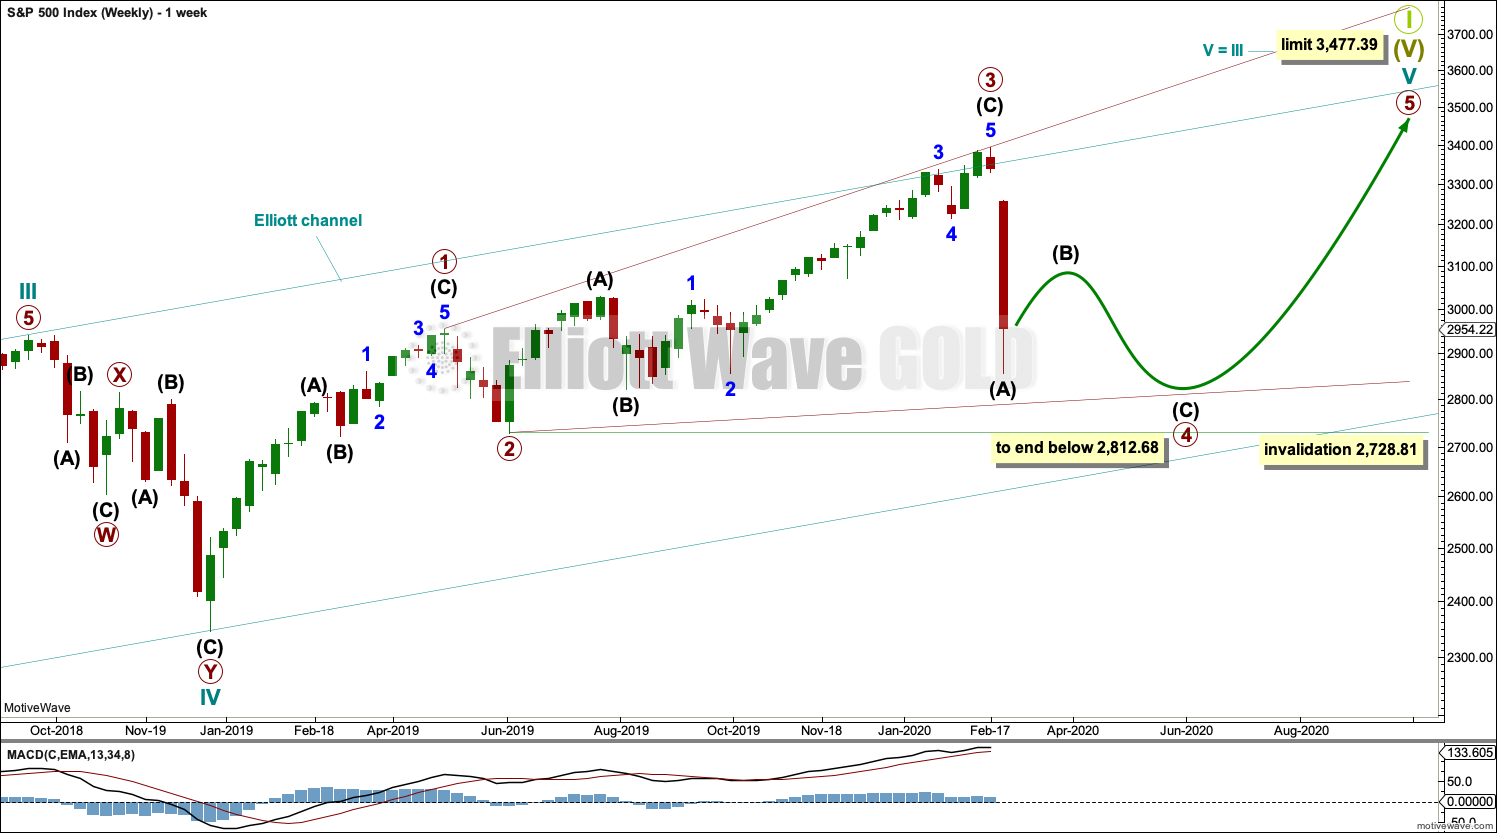
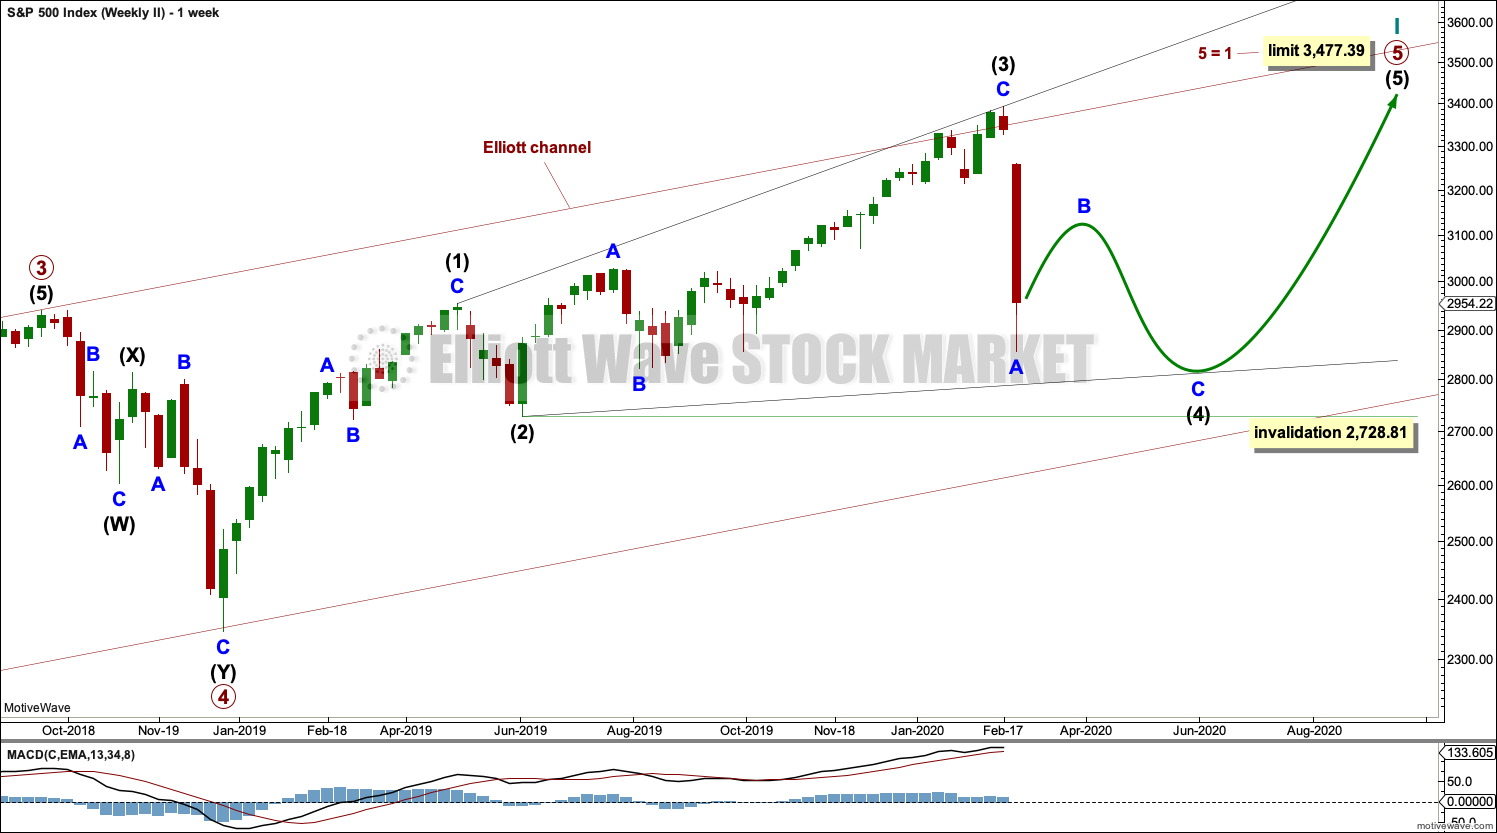
Cycle wave V may subdivide either as an impulse or an ending diagonal. Impulses are much more common, but at this stage an impulse is now invalidated and so the only remaining possible structure is a diagonal.
At this stage, cycle wave V may end within this year or possibly into next year.
The daily chart below will focus on movement from the end of intermediate wave (B) within primary wave 3.
Ending diagonals require all sub-waves to subdivide as zigzags. Primary wave 4 of a diagonal must overlap primary wave 2. This rule is now met. Primary wave 4 may not move below the end of primary wave 2 below 2,728.81.
This ending diagonal would be expanding. Primary wave 3 is longer than primary wave 1, and primary wave 4 so far is longer than primary wave 2. Primary wave 5 would need to be longer than primary wave 3 for all rules regarding wave lengths of expanding diagonals to be met.
Fourth and second waves of diagonals most commonly end somewhere between 0.66 to 0.81 of the prior wave. This gives a target zone for primary wave 4 from 2,954.81 to 2,855.10. However, this diagonal is expanding and primary wave 5 needs to be longer in length than primary wave 3, which was 664.71 points for this rule to be met. This rule needs to be met prior to the upper limit for cycle wave V at 3,477.39, so primary wave 5 would need to begin below 2,812.68.
DAILY CHART
Click chart to enlarge.
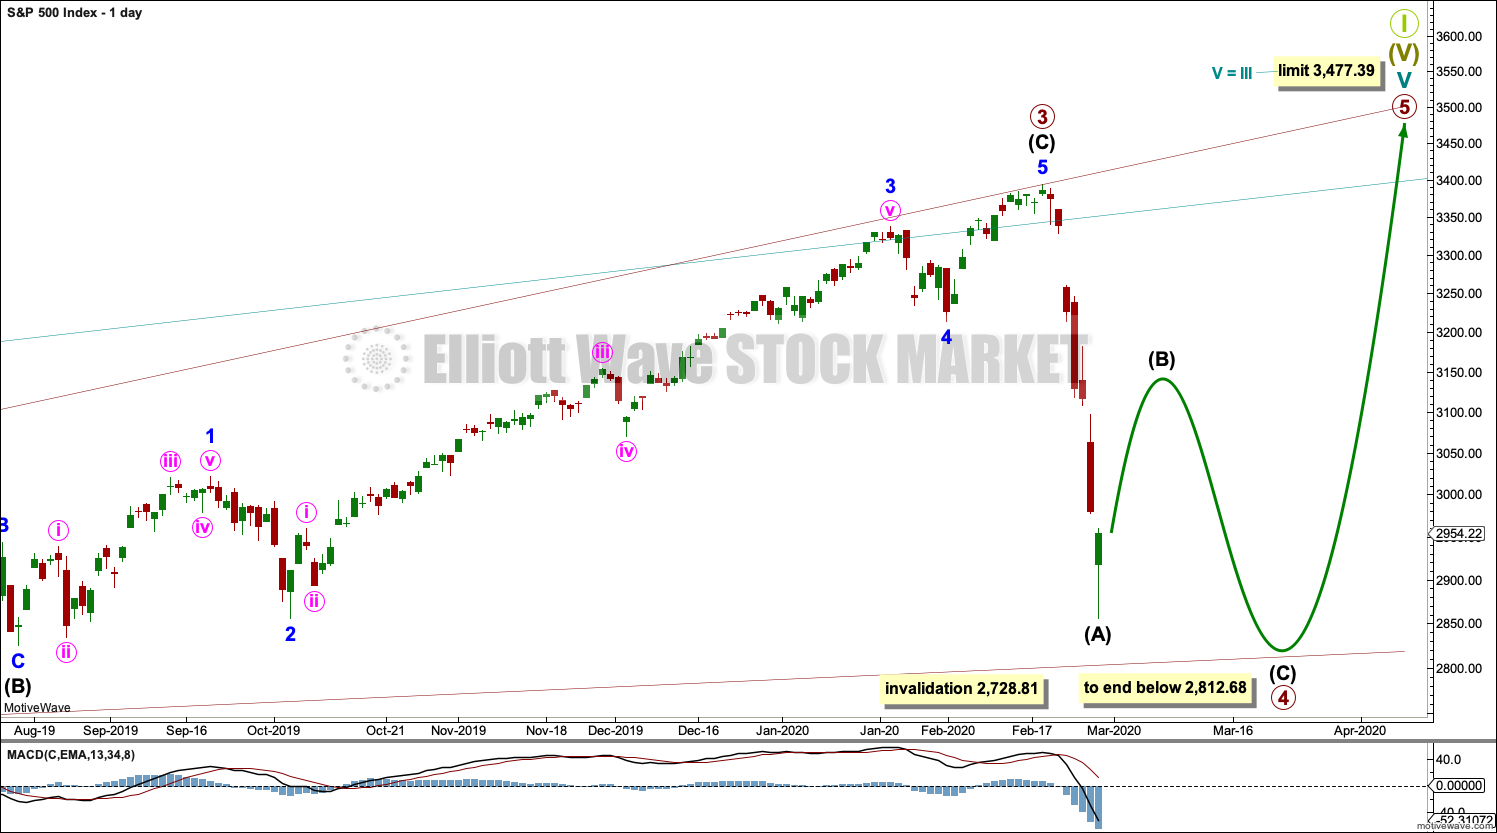
All sub-waves of an ending diagonal must subdivide as zigzags. This is the only Elliott wave structure where a third wave sub-divides as anything other than an impulse.
Primary wave 4 must subdivide as a zigzag. Within the zigzag, there would very likely be a sharp bounce or a time consuming sideways consolidation for intermediate wave (B).
Diagonals normally adhere very well to their trend lines, which may be tested within the sub-waves. The upper 1-3 trend line is tested at the end of minor wave 3 within intermediate wave (C) within primary wave 3.
Primary wave 4 may not move beyond the end of primary wave 2 below 2,728.81.
HOURLY CHART
Click chart to enlarge.
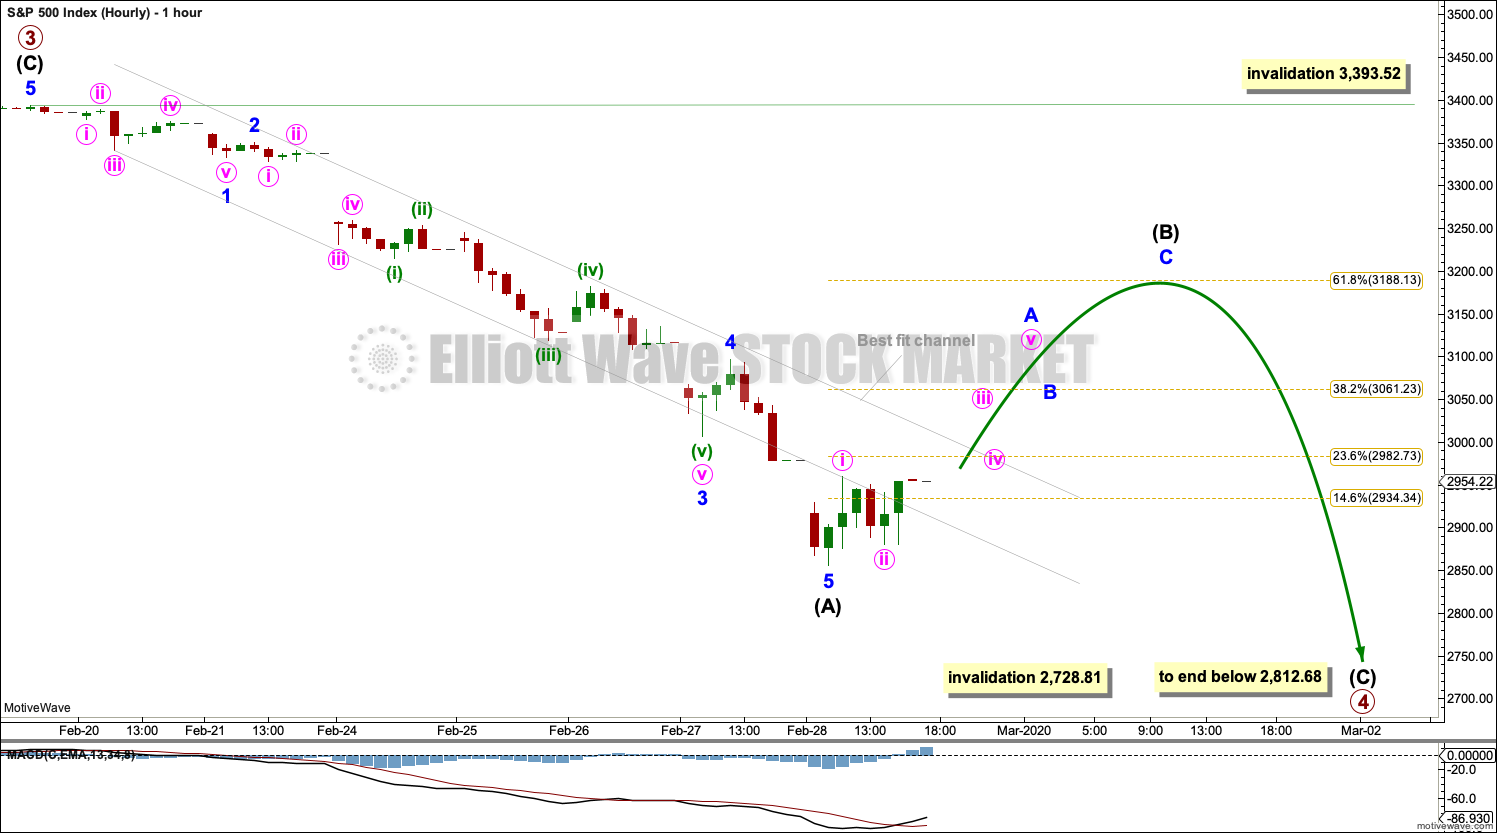
Primary wave 4 within a diagonal must subdivide as a zigzag. Within the zigzag, intermediate wave (B) would very likely show on the daily and weekly chart for primary wave 4 to have the right look. Intermediate wave (B) so far does not show up on the daily chart, but it may have just begun during Friday’s session. A long lower wick and bullish divergence between price and both of market breadth and On Balance Volume suggest a bounce next week.
Intermediate wave (B) may not move beyond the start of intermediate wave (A) above 3,393.52.
Intermediate wave (B) may subdivide as any Elliott wave corrective structure. It may be a quick sharp bounce as in a single or multiple zigzag, or it may equally as likely be a time consuming consolidation as in a flat, combination or triangle. Multiple wave counts at the hourly chart level will be required over the next one to two weeks as intermediate wave (B) unfolds.
SECOND WAVE COUNT
WEEKLY CHART
Click chart to enlarge.
This second wave count sees all subdivisions from the end of the March 2009 low in almost the same way, with the sole difference being the degree of labelling.
If the degree of labelling for the entirety of this bull market is all moved down one degree, then only a first wave at cycle degree may be nearing an end.
When cycle wave I is complete, then cycle wave II should meet the technical definition of a bear market as it should retrace more than 20% of cycle wave I, but it may end about either the 0.382 or 0.618 Fibonacci Ratios of cycle wave I. Cycle wave II may end close to the low of primary wave II within cycle wave I, which is at 1,810.10. It is also possible that cycle wave II could be fairly shallow and only barely meet the definition of a bear market.
An ending expanding diagonal is still viewed as nearing an end. This wave count labels it primary wave 5. Primary wave 5 may still need another year to two or so to complete, depending upon how time consuming the corrections within it may be.
Primary wave 5 may be subdividing as a diagonal, in the same way that cycle wave V is seen for the first weekly chart.
TECHNICAL ANALYSIS
MONTHLY CHART
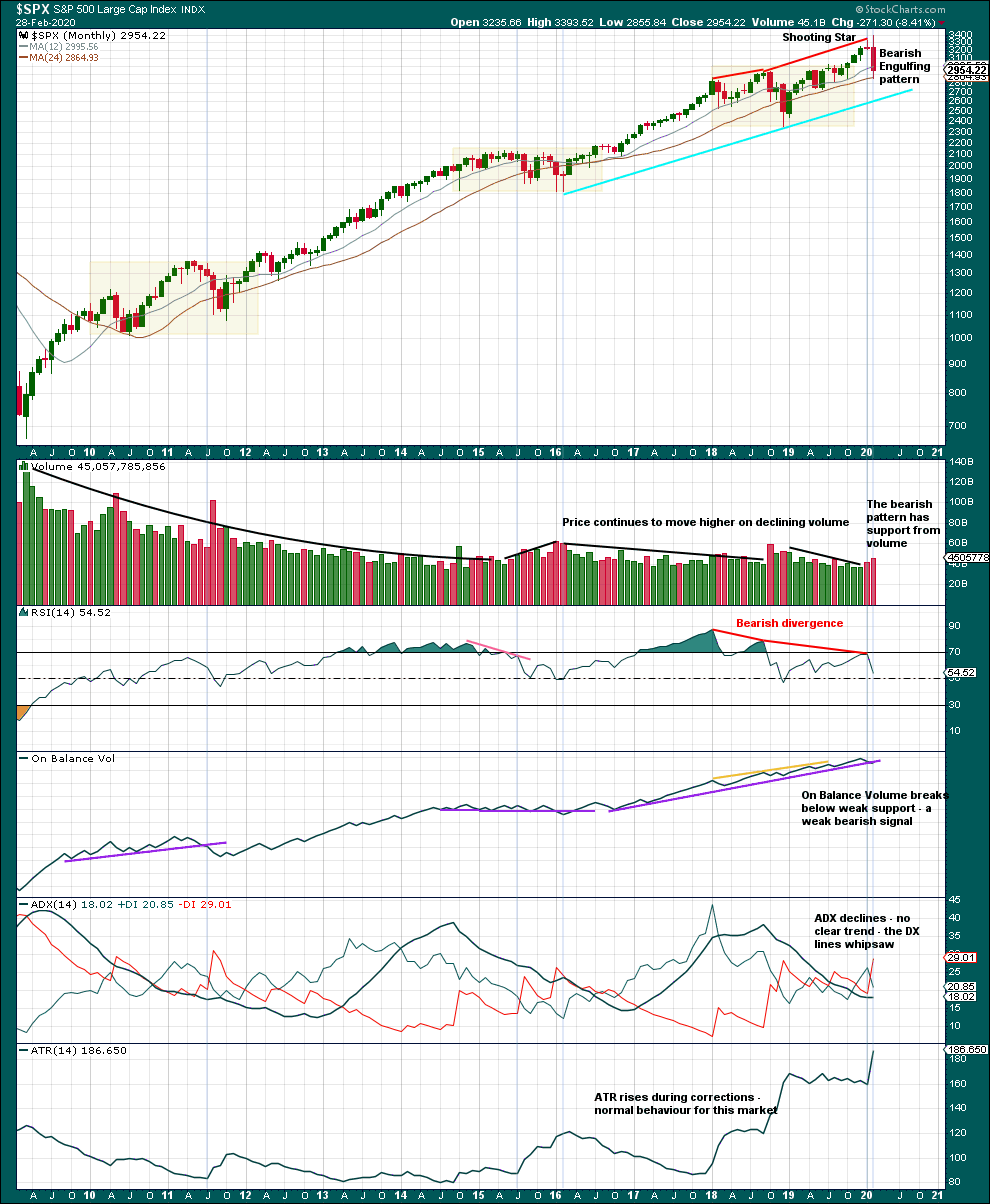
Click chart to enlarge. Chart courtesy of StockCharts.com.
This monthly chart shows the entire bull market which began in March 2009. Three large multi-month consolidations are identified by shaded areas on this chart. Note that the first two consolidations were followed closely by a test of support, which entered the prior area of consolidation by some margin, and then by a large sustained upwards trend.
The most recent consolidation is now followed by a test of support, which has re-entered the prior area of consolidation. This test was outlined in last monthly analysis as a normal and to be expected behaviour following a multi-month consolidation. Upon the completion of this test, it would be normal for price to move up and away in a sustained bullish move.
WEEKLY CHART
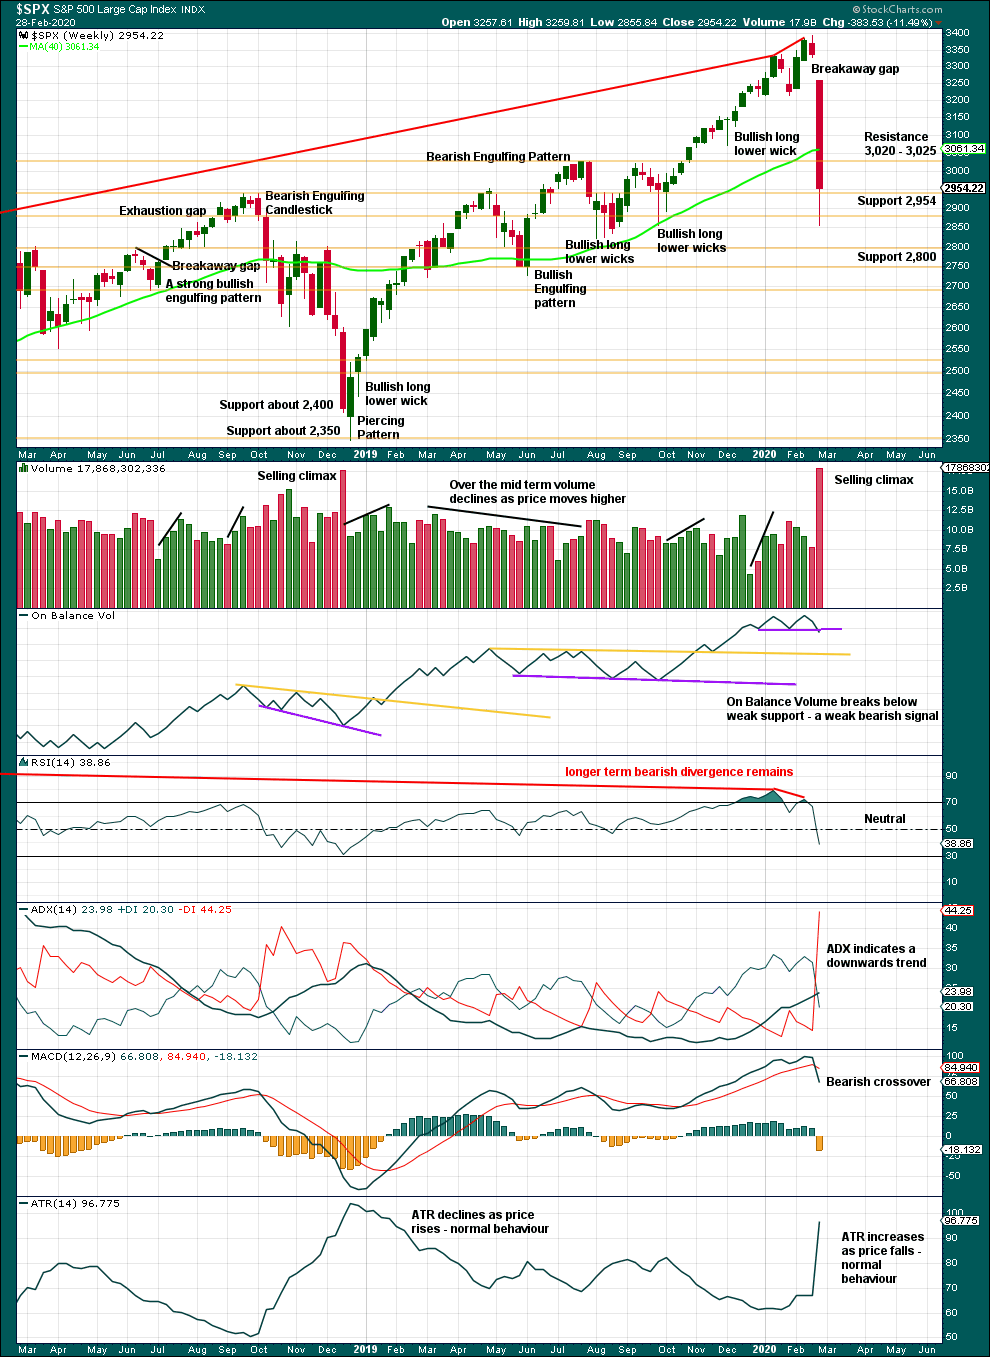
Click chart to enlarge. Chart courtesy of StockCharts.com.
Risk of a pullback identified last week has been followed by a 15.8% drop in price (high to low) so far. This dramatic drop in price has precedent within the larger bull market. It does not necessarily mean the secular bull market must be over.
At the weekly chart level, conditions are not yet oversold; this pullback may be expected to continue further.
For the short term, the volume spike this week may be a selling climax. In conjunction with a bullish long lower wick on this weekly candlestick, a bounce may be expected about here.
DAILY CHART
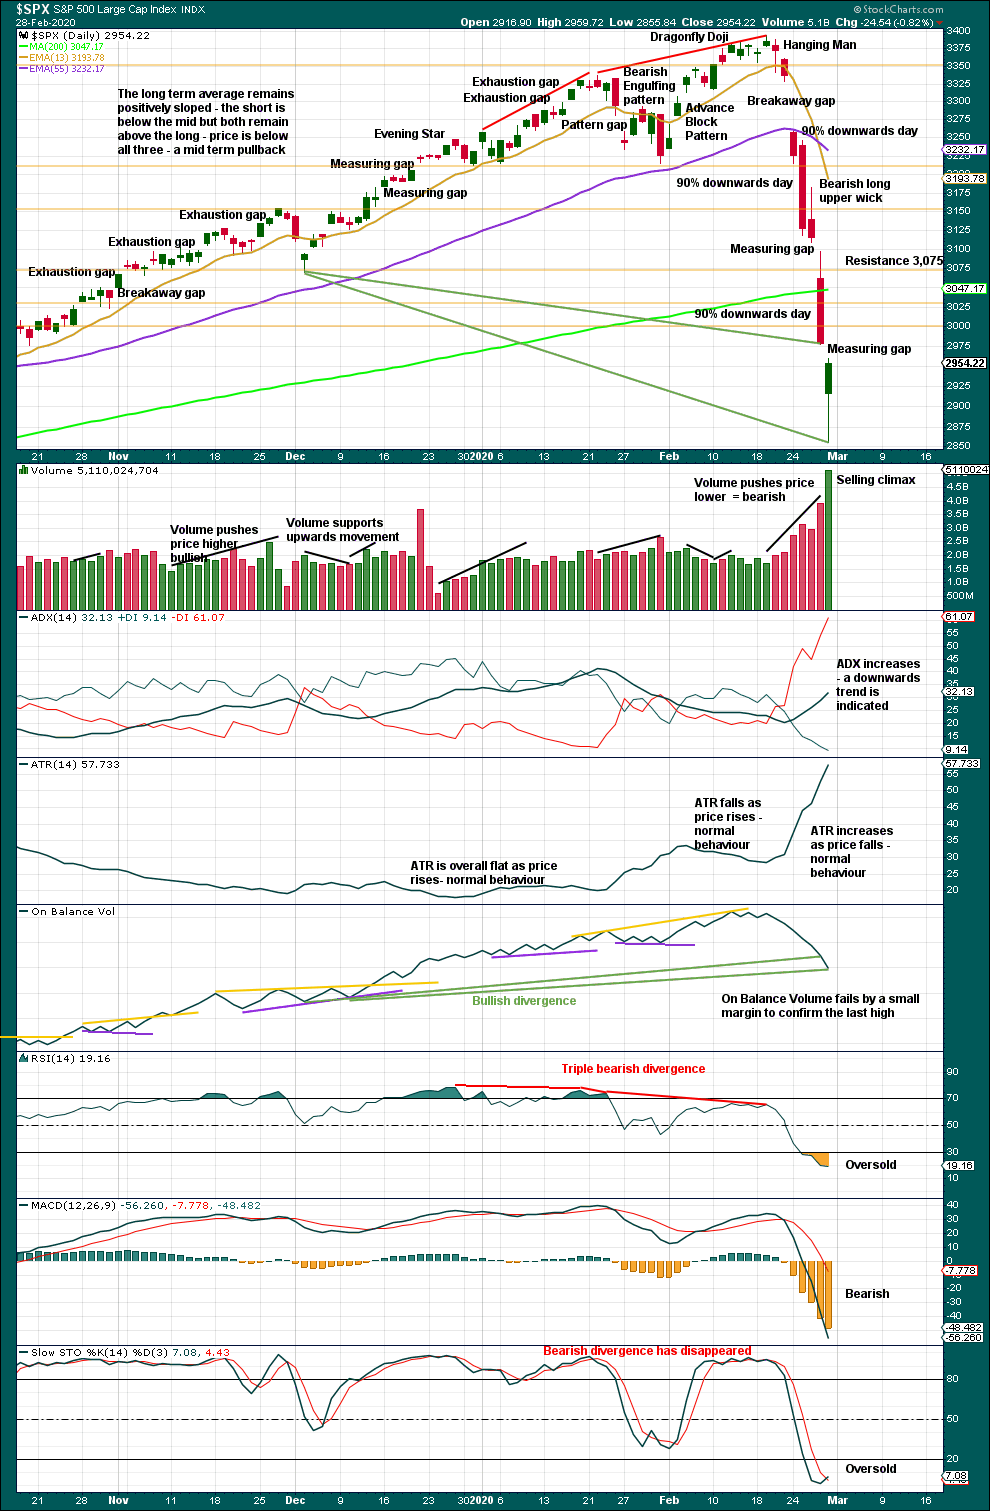
Click chart to enlarge. Chart courtesy of StockCharts.com.
There are now three 90% downwards days in this strong downwards movement.
Following a 90% downwards day, either a 90% upwards day or two back to back 80% upwards days within 3 sessions would be required to indicate a 180°reversal in sentiment and indicate a sustainable low may be in place.
The measuring gap from Thursday gave a target at 2,946.25, which was met and exceeded.
The measuring gap from Friday now gives a target at 2,840.04, which has not quite been met by the end of Friday’s session. The long lower wick and strong close to Friday’s session suggests it may not be met.
Price is falling faster than On Balance Volume. This divergence is bullish and suggests this pullback may be an interruption to the secular bull market.
BREADTH – AD LINE
WEEKLY CHART

Click chart to enlarge. Chart courtesy of StockCharts.com. So that colour blind members are included, bearish signals
will be noted with blue and bullish signals with yellow.
Bear markets from the Great Depression and onwards have been preceded by an average minimum of 4 months divergence between price and the AD line with only two exceptions in 1946 and 1976. With the AD line making new all time highs with last all time highs from price, the end of this bull market and the start of a new bear market is very likely a minimum of 4 months away, which is mid June 2020.
In all bear markets in the last 90 years there is some positive correlation (0.6022) between the length of bearish divergence and the depth of the following bear market. No to little divergence is correlated with more shallow bear markets. Longer divergence is correlated with deeper bear markets.
If a bear market does develop here, it comes after no bearish divergence. It would therefore more likely be shallow.
This week price and the AD line have both moved lower. Price has made new lows below the prior swing low of the week beginning 2nd December 2019, but the AD line has not. Price is falling faster than market breadth; breadth does not support this fall in price. This divergence is bullish and fairly strong, and it supports the new Elliott wave count.
Large caps all time high: 3,393.52 on 19th February 2020.
Mid caps all time high: 2,109.43 on 20th February 2020.
Small caps all time high: 1,100.58 on 27th August 2018.
DAILY CHART
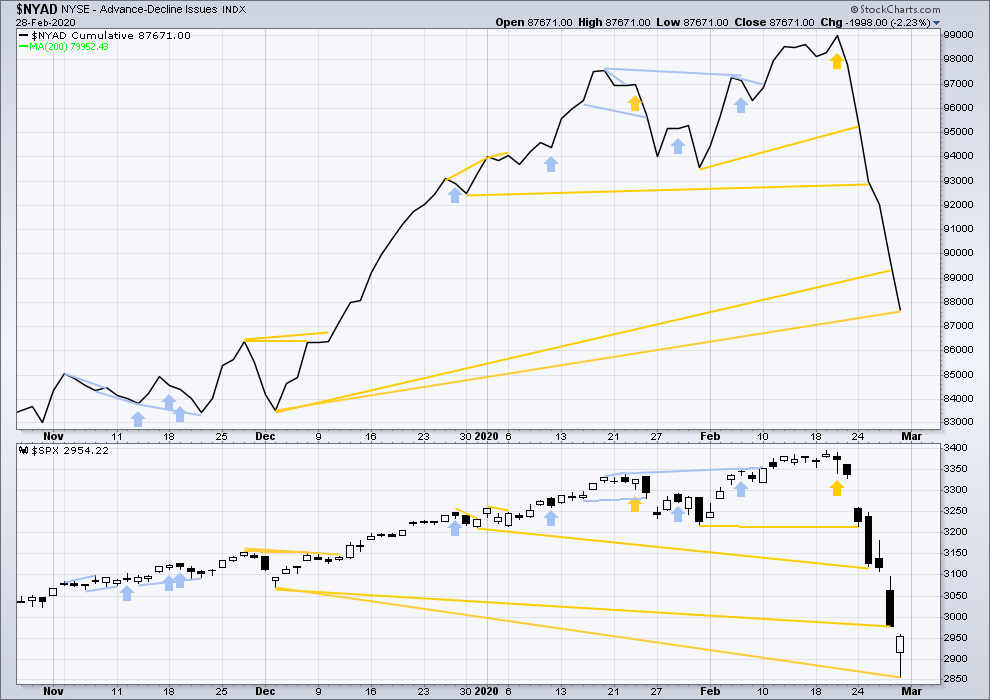
Click chart to enlarge. Chart courtesy of StockCharts.com. So that colour blind members are included, bearish signals
will be noted with blue and bullish signals with yellow.
Breadth should be read as a leading indicator.
Again, price has made a new low below the prior small swing low of the 3rd of December 2019, but the AD line has not. Price is falling faster than market breadth. This divergence is bullish.
VOLATILITY – INVERTED VIX CHART
WEEKLY CHART
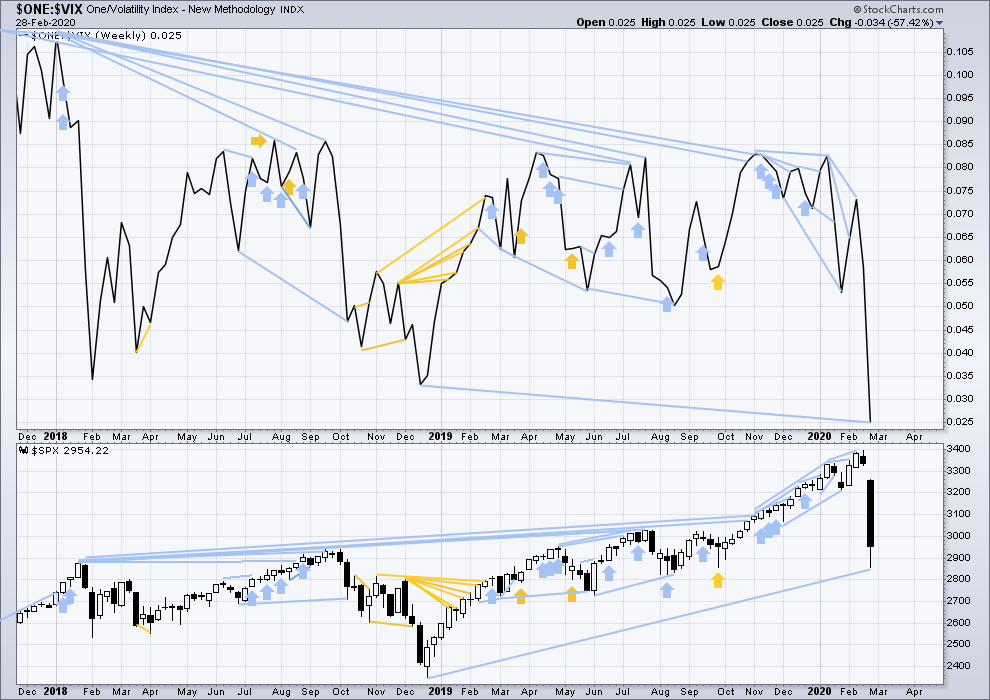
Click chart to enlarge. Chart courtesy of StockCharts.com. So that colour blind members are included, bearish signals
will be noted with blue and bullish signals with yellow.
The all time high for inverted VIX was on 30th October 2017. There is now over two years of bearish divergence between price and inverted VIX.
The rise in price is not coming with a normal corresponding decline in VIX; VIX remains elevated. This long-term divergence is bearish and may yet develop further as the bull market matures.
This divergence may be an early warning, a part of the process of a top developing that may take years. It is clearly not useful in timing a trend change from bull to a fully fledged bear market.
This week both price and inverted VIX have moved lower. Inverted VIX has made new lows below prior lows of weeks beginning 17th / 24th December, but price has not. Inverted VIX is falling faster than price. This divergence is bearish. Because this disagrees with the AD line this week, it shall not be given weight in this analysis.
DAILY CHART
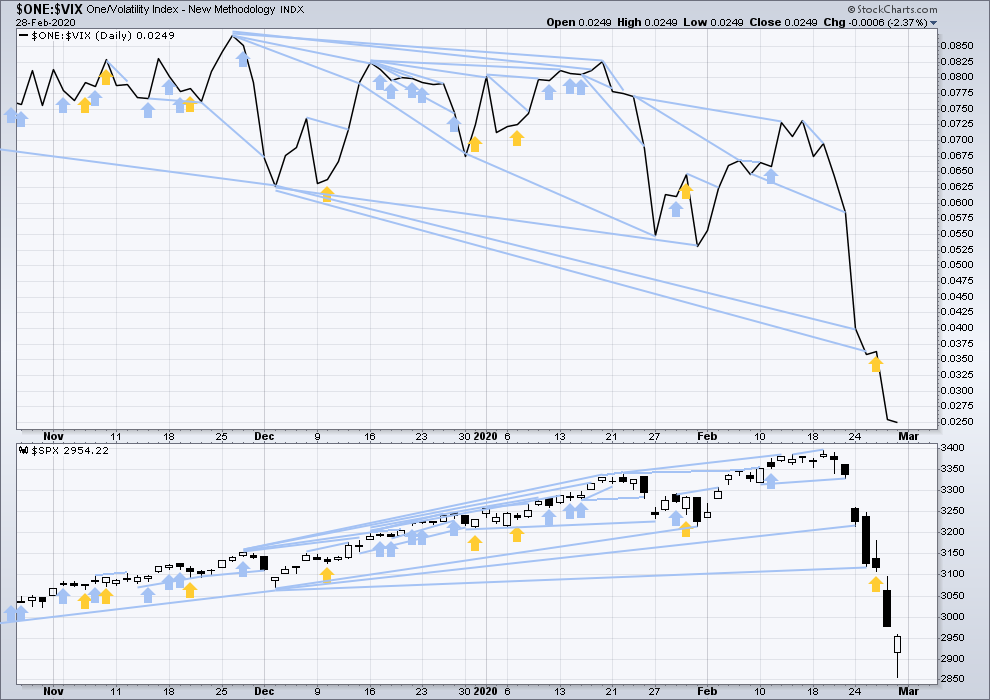
Click chart to enlarge. Chart courtesy of StockCharts.com. So that colour blind members are included, bearish signals
will be noted with blue and bullish signals with yellow.
Again, both price and inverted VIX have moved to make new mid-term lows. There is no new divergence.
DOW THEORY
Dow Theory would confirm a bull market if the following highs are made:
DJIA: 26,951.81 – a close above this point has been made on the 3rd of July 2019.
DJT: 11,623.58 – to date DJT has failed to confirm an ongoing bull market.
S&P500: 2,940.91 – a close above this point was made on the 29th of April 2019.
Nasdaq: 8,133.30 – a close above this point was made on the 26th of April 2019.
Dow Theory would confirm a bear market if the following lows are made on a closing basis:
DJIA: 21,712.53
DJT: 8,636.79
S&P500: 2,346.58
Nasdaq: 7,292.22
Published @ 11:25 a.m. EST on February 29, 2020.
—
Careful risk management protects your trading account(s).
Follow my two Golden Rules:
1. Always trade with stops.
2. Risk only 1-5% of equity on any one trade.
—
New updates to this analysis are in bold.
Wow 100 points in last 90 mins, difficult market
Irrational B wave exuberience? Maybe…
Well as mentioned before, I am also considering it as minor 2 complete & it’s minor 3, today’s move of 100 points in 90 minutes is just amazing… so Let’s see open to the possibility of lower low but also aware that it may just continue to move higher & higher…
So I am just being careful by
1) NO SHORTS
2) Buy small with tight stop
I’ll only short with a proper setup and won’t be stubborn with it…
Also…possibility of a ‘2’ count…as a ZZ. Only 1st portion complete more down to come,….then 3rd wave?
Sold half of my longs at the close. The other half will be tomorrow. I consider myself fortunate to have this opportunity to sell at essentially a very small loss. I’ll call it break even.
I’m hoping to unload tomorrow- fractional loss ‘ain’t no thang’ here. having lots of dry powder to buy myself into break even was crucial. very thankful to have been raising cash the two days before the bottom fell out. excellent guidance by Lara…
I am thinking today was the top Minor A of Intermediate B. So I may end up waiting till Wednesday to unload the remainder of my longs. I am waiting for Lara’s update count tonight.
Wise man… 🙂
Careful here – multi-year resistance at 3088 on /ES as I mentioned earlier this morning
Close above 3000 brings 3100 into play short term. Right now CBs in charge…
Wow!! Epic!! If we get candlestick close above the 61.8 in next couple sessions we can expect to continue where we left off
A daily candlestick close above 3188.66 is going to punch this market back where we left off. I agree with you Verne that CB’s is in charge and running the show. Interesting couple weeks ahead
UVXY needs to move below 21.71 to signal ” All Clear” on short vol trade…risk is gap higher if it does not…
I have the close at 21.69 with a low of 21.60.
Amazing isn’t it? Hope it is not a head fake as they also watch those gaps…
Five up. Possible ZZ?
A move back below 2930.93 means gap support failure and short term very bearish…!
Whip it ! Whip it real good ….
The 8 inches of fresh snow here in Solitude really helps my day trade game …. who knew ?
They are defending 3000.00…
The CDC stance on handling this potential pandemic is quite troubling.
The case of their refusing to approve testing (delay of four days!)for a patient that returned to the country on a ventilator is beyond insane. This virus incubates for as long as 14 to over 30 days!
Waiting for symptoms I understand is “cost effective” but in my view injurious to a strategy of effective containment.
I think they are way short of testing kits. VP Mike Pence stated yesterday, they will have 50,000 ready to ship this week and much more available soon. They will need millions upon millions just for the US alone.
Friends:
I just received a forwarded email from a pathologist who has been studying the corona virus (as a class of viruses) since the 1970’s. His take: by late March/April, it will be WIDESPREAD in the US. Which implies it will be widespread all around the world.
You know what I think the market will do as a result of that. We may be at the early stage of an epic market crash. May be. Take appropriate precautions is my advice. There’s little upside potential right now…and serious downside risk. My $0.02!
I agree. The Chinese PMI data reported this week-end (do doubt highly “massaged”) suggests the impact on the global economy is going to be severe.
The CBs are pumping in tens of billions of try and keep prices afloat.
As I mused previously, can they bail out the global economy…?!!
Back below 3000.00, so I am out if we close below…
Free advice and good advice. Well noted buddy
I will be exiting all my long positions at the completion of Intermediate B. I am hoping this occurs at 3050 or above. Currently at SPX 3010, I am only 115 SPX points or 3.7% down. I say ‘only’ because at 2855 it was much worse! I agree with Lara and most here that we have not yet seen the bottom. I don’t want to be holding any long positions as the next leg starts.
Historically, all those market affecting viruses (SARS, Ebola, MERS, Zika) all ended by March-June period. Market rallied on average 7.5% 3 month after and 13% 6 month after. Not saying that this is going to repeat, but if history is any guidance, yes, the bottom is not there yet, but we might be seeing it soon.
Kevin: be greedy when everyone is fearful, and fearful when everyone is greedy. Rule #1. Not saying that we are at the bottom yet, but Friday’s VIX was the second highest peak in history after 2008.
Your comments are thoughtful.
Fear hasn’t set in yet. That may not happen. But if the infection rate spikes over the next few weeks, it will, seriously. And yes, once it all abate, it’ll be a fine buying opportunity.
My general take is all our models are “no good” in the face of exogenous calamities, like a surprise meteor strike for example…or a surprise contagion.
Here for everyone to see is the latest info I received. For me, it’s redouble my concern about downside risk.
———————————
Dear Colleagues, as some of you may recall, when I was a professor of pathology at the University of California San Diego, I was one of the first molecular virologists in the world to work on coronaviruses (the 1970s). I was the first to demonstrate the number of genes the virus contained. Since then, I have kept up with the coronavirus field and its multiple clinical transfers into the human population (e.g., SARS, MERS), from different animal sources. The current projections for its expansion in the US are only probable, due to continued insufficient worldwide data, but it is most likely to be widespread in the US by mid to late March and April.
Here is what I have done and the precautions that I take and will take. These are the same precautions I currently use during our influenza seasons, except for the mask and gloves.:
1) NO HANDSHAKING! Use a fist bump, slight bow, elbow bump, etc.
2) Use ONLY your knuckle to touch light switches. elevator buttons, etc.. Lift the gasoline dispenser with a paper towel or use a disposable glove.
3) Open doors with your closed fist or hip – do not grasp the handle with your hand, unless there is no other way to open the door. Especially important on bathroom and post office/commercial doors.
4) Use disinfectant wipes at the stores when they are available, including wiping the handle and child seat in grocery carts.
5) Wash your hands with soap for 10-20 seconds and/or use a greater than 60% alcohol-based hand sanitizer whenever you return home from ANY activity that involves locations where other people have been.
6) Keep a bottle of sanitizer available at each of your home’s entrances. AND in your car for use after getting gas or touching other contaminated objects when you can’t immediately wash your hands.
7) If possible, cough or sneeze into a disposable tissue and discard. Use your elbow only if you have to. The clothing on your elbow will contain infectious virus that can be passed on for up to a week or more!
What I have stocked in preparation for the pandemic spread to the US:
1) Latex or nitrile latex disposable gloves for use when going shopping, using the gasoline pump, and all other outside activity when you come in contact with contaminated areas.
Note: This virus is spread in large droplets by coughing and sneezing. This means that the air will not infect you! BUT all the surfaces where these droplets land are infectious for about a week on average – everything that is associated with infected people will be contaminated and potentially infectious. The virus is on surfaces and you will not be infected unless your unprotected face is directly coughed or sneezed upon. This virus only has cell receptors for lung cells (it only infects your lungs) The only way for the virus to infect you is through your nose or mouth via your hands or an infected cough or sneeze onto or into your nose or mouth.
2) Stock up now with disposable surgical masks and use them to prevent you from touching your nose and/or mouth (We touch our nose/mouth 90X/day without knowing it!). This is the only way this virus can infect you – it is lung-specific. The mask will not prevent the virus in a direct sneeze from getting into your nose or mouth – it is only to keep you from touching your nose or mouth.
3) Stock up now with hand sanitizers and latex/nitrile gloves (get the appropriate sizes for your family). The hand sanitizers must be alcohol-based and greater than 60% alcohol to be effective.
4) Stock up now with zinc lozenges. These lozenges have been proven to be effective in blocking coronavirus (and most other viruses) from multiplying in your throat and nasopharynx. Use as directed several times each day when you begin to feel ANY “cold-like” symptoms beginning. It is best to lie down and let the lozenge dissolve in the back of your throat and nasopharynx. Cold-Eeze lozenges is one brand available, but there are other brands available.
I, as many others do, hope that this pandemic will be reasonably contained, BUT I personally do not think it will be. Humans have never seen this snake-associated virus before and have no internal defense against it. Tremendous worldwide efforts are being made to understand the molecular and clinical virology of this virus. Unbelievable molecular knowledge about the genomics, structure, and virulence of this virus has already been achieved. BUT, there will be NO drugs or vaccines available this year to protect us or limit the infection within us. Only symptomatic support is available. I hope these personal thoughts will be helpful during this potentially catastrophic pandemic. You are welcome to share this email.
Good luck to all of us!
James Robb, MD FCAP
Many thanks Kevin.
Extremely helpful info…!
Thanks for sharing that Kevin. It is much appreciated.
Yes, Kevin, thank you for sharing this.
Yiikes! DJIA up 666.60…!
Wassup wid dat?! 🙂
Premiums are sky high with VIX trading at better than 30.
I went ahead and executed trade for 0.32.
Will exit spread on any CLOSE below 3000.00 so I could get stopped out today or overnight. If we close above 3000.00 will set up contingency order to buy back short leg of spread on any move back below 3000.00 Lock and Load! 🙂
Verne, with the new uptrend channel we can close below 3000 at the bottom of this channel, but continue up tomorrow along the channel. I don’t see 3000 as a make or break type of deal.
You may be correct. Just my personal entry and exit criterion fwiw…
If we close above 3000 today, deploying massive SPY 299X300 bear call spread for limit of 0.30 per spread…
Trade can be set up via a cotingency order with execution trigger a CLOSE above 3000.00. Risk is 100.00 per spread if price closes below 3000 on expiration date…
ROI is 300.00 for 1000.00 comittment through expirarion on Friday March 6 for ten contracts.
Watching 3000 with keen interest. This could be just the A up of an unfolding A,B,C…..
So it looks like we’re re-testing the 200-day moving average. Will it be a sweet kiss goodbye, or do we plow right on through? Hmmm.
Struggling! Little double top in place now on the 5 minute.
Time for me to start taking put back ratio stabs, with super tight stops (just above the most recent high pivot). For example, sell 2 SPY Apr 20 300 puts, buy SPY Apr 20 298 puts. Sell if SPY gets back to 304.1 (pivot high right now) for -$160 or so (maybe -$200 when all is said and done). If SPY tanks back to 280, up $1000, and at 240, up $4400. If true disaster strikes in coming days…yet more. You can try several times to catch the top of the B wave and still come out with very nice profits.
Time for me to start taking put back ratio stabs, with super tight stops (just above the most recent high pivot). For example, sell 2 SPY Apr 20 300 puts, buy SPY Apr 20 298 puts. Sell if SPY gets back to 204.07 for -$160 or so (maybe -$200 when all is said and done). If SPY tanks back to 280, up $1000, and at 240, up at $4400. You can try several times to catch the top of the B wave and still come out with very nice profits.
If anyone is monitoring new infection totals at coronavirus dot app, note that the daily bar chart shows partials for “today” which are updated throughout the day. So only completed days show final totals. The 3/2 # just went up from what it was showing an hour ago for example.
AFAIAC, this chart is “everything” right now. If it starts spiking…
Revamped RUT count.
Indicates that there’s probably a lot more movement down to come…but I’m open to anyone else’s model too.
NDX has broken above it’s upper 6 day down-channel line. But not SPX or RUT.
SPX has now pushed it’s nose out of the channel as well, and has broken bullish symmetry (largest up move now of any during the A wave down), pushed through the 21-23% retrace zone, and filled Friday’s opening gap. All very B wave positive indicators.
Kevin
Where do you think wave B is Hong to end
Kevin
Where do you think this next upwards movement may end
Wish I knew!
I do note that on the hourly chart there is already an A-B-C structure in place. Could it be a real “shorty”, consistent with the tremendous bearish pressure? I think it could.
3060 is the 38.2% retrace level, 3125 the 50%, and 3184 the 61.8%. Those are the critical levels to watch for a B wave completing pivot. Turning right here in between the 23% and 38% is possible, but a bit less likely.
NDX is already just about at it’s 38.2% retrace level. And up over 3%! RUT is lagging (as usual recently), but still up 1.5%.
Note that the current SPX stall is just under the 200 day SMA! A sharp turn down here has real potential I think.
Thanks Kevin
Great info. It allows me tactically where I’m positioning myself. I honestly thought this was going to melt up to at least 3060.
To be fair I can’t keep up with the counts
Have watched the Asian trade and the London pen and it’s more like a consolidation for the next leg up. However we shall see
I have seen the coronavirus app. My wife just got out of hospital getting tested here in the Middle East. I have to say frustrating with the protocol to say least
Hope all is well friend
I have a really stupid question …. on Laura s weekly count ( first chart ) how can primary wave 4 enter primary wave 1 price territory ? Am I missing something ?
Ending and leading diagonals have this characteristic.
got it – thank you
she touches on this in the video with a description as well.
This is an alternate idea that maybe I should be publishing.
My concern is that it is very bearish, and it may persuade members to be more bearish right when we should be looking for opportunities.
The proportions between intermediate (2) and (4), and minor 2 and 4 are really not very good. But this is valid.
The futures battle seems to be developing around the 3000 round number red line. As on the way up, round number resolutions on a closing basis will likely tell the tale!
/ES (e-mini futures) opened down but it’s “filling” in the area of the lows of Friday, and there appears to be some buying pressure. I have the hourly trend at the moment at “strong up” even, but that could change in hurry.
Gonna be an interesting week, and month. Heck, it’s going to be an interesting YEAR and DECADE!!! But one hour and day at a time.
Hey class, just for kicks, you might want to check out Nate’s latest post. An interesting alternate possibility…
His middle chart doesn’t make sense.
Yeah, kinda odd.
I used to subscribe to him a few years ago. Nate is an excellent EW analyst. However I’ve been doing EW myself for too long now to know that imo you can’t possibly be definitive on it without some sort of TA to back up your analysis. It’s just too
subjective otherwise.
Gents if weekend wall street on IG markets is saying 600 plus points down. Is this going to gap down on open at Asia open
Futures opened in deep red and that is not good so far.
PPT working overtime!
Looks like we need another wave down, despite their best efforts…lol!
Keep an eye on the # of new infections by day at coronavirus dot app.
The potential for the CV infection rate to go exponential over the next 4-8 weeks is non-zero (hopefully extremely small). Which means the potential for a world-wide business slow down of massive proportions is non-zero. Should that happen, we likely see a market crash of epic proportions. “It could happen here.” A black swan event.
I will take that edge and put on put ratio back spreads as the B wave completes and confirms, or there are other price action reasons to get on with it. A great weapon for potential big moves and tight stops.
Folks, if the CV rate goes exponential, I fully expect SPX to go to the 2000 area and potentially much lower than that. The world economy will lock up, and who knows what happens in the financial markets under that kind of strain. Probably not going to happen…but it could. A black swan, 5 sigma kind of epic event.
“Protect yourself at all times.”
Sounds like you’ve been in the Octagon…! 🙂
No, I’m lover not a fighter, lol!!
The best boss I ever had told me once “Kevin!!! Don’t back into the future and let it break over your head; turn around and face it!”. (Thankfully, I have no boss now…35 years of that was plenty.)
A forward facing sober review of the facts here says everything will PROBABLY play out generally as Lara has mapped. And…there is some potential that it plays out far, far, far worse than that. EW isn’t great at predicting meteor strikes, or (if it comes to it) a serious pandemic.
Stay nimble and be alert to all possible future outcomes is what I’m trying to do. This is a very unique and unusual situation.
Looking at some of the European Indices like DAX, It seems to have completed the P1-P2, I1-I2 (the latest drop I2 could still continue) but beside the ending diagonal count, considering that this was a multi month bullish breakout and this recent drop is just a retest of that breakout..
Also as there was no divergence in the breadth, I am still considering this drop as some kind of deep wave 2, so open to idea of a strong V recovery and explosive move up (targeting 4k+). with the unbelievably strong bid this market has had before this drop and how bullish it was, This market has done it before multiple times in last few months, when we were expecting a triangle or a B wave up etc, it just continued higher and require change of count, so because of that I’ll only play on the long side and being cautious with my positioning but next few days will be fascinating, and engulfing next week will be amazing..
May be in next few weeks, we will all wish that we should have loaded the boat on this drop but it’s still very precarious situation so requires caution. 🙂
The monthly candle should sound a cautionary note. The ferocity of this decline trapped an awful lot of traders with how swiftly it unfolded so overhead supply could prove formidable resistance to any relief rally.
I think with massive drops, a lot of people threw the towel in starting Wednesday into Friday close. Let’s see where the futures sit into tomorrow’s open.
Yeah IG showing about -600 gap down on YM, so around 50-60 points in ES…
Yes, the drop is ferocious but irrational exuberance was also extreme, I think if we start to get the squeeze and start to see the market bid strongly (as it was before the drop for whatever reason).. I am of the view that people who missed on the initial move up will be more aggressive in buying it, which could make it a strong melt up until the election later in the year but I am open to all the views and I’ll let price action be the guide 🙂
If it’s a weak & choppy move up then it’s a B wave, also I like that it has to go below 2812 for the ED main count to stay valid, which is nice… so regardless I think we’ll have exciting few weeks with lots of opportunities
Actually, I know a lot of experienced traders who were convinced the over-sold conditions warranted going into the week-end long.
Just as we saw quite a few bearish reversal signals get violently negated on the “ramp and camp” moves higher, we could be about to see the same thing during this brutal decline. I would ordinarily short vol on the familiar appearance of the ” VIX wick”, but this time I went in very light. I think we likely see a lower high on what could be a fifth down after a fourth wave bounce on Friday.
Let’s see if they can put humpty Dumpty back faster than it came tumbling down..
Is it possible we’ve just completed Primary 1 (circle) of a large diagonal from 12/26/18? Not much room for new highs in Primaries 3 and 5 (circle), but more time for an extended divergence between breadth and price.
The upwards wave from the low of December 2018 to the last ATH will just not fit as a completed diagonal.
It could be forced to fit as a completed impulse, but the proportions don’t look very good. Still, it’s a valid alternate idea and I think it may be time to chart it… my concern there is it’s fairly bearish, and after last weeks dramatic decline a more bearish count now may not be a good idea in terms of psychology
I lightened up on my massive BLK short with the intention to re-load on the upcoming B wave bounce. The risk is the Ukranian news will surface anyday and the implosion I expect will occur without my wagon’s being fully loaded….hmmnnn…!
The next few weeks are going to be absolutely fascinating. To avoid invalidating the main count we are going t o need a deep B wave correction if the typical A/C ratios obtain.
Could we see an expanded flat wave B????!
I could see it with a sudden 0.75 basis points rate cut and announcement of Q.E. infinity (yeah, I know it would be suicidal for the FED, but what’s a few trillion among friends?)
Boy, would that put a few bees in a lot of traders’ bonnets!!! Egad!!!
hey ,, Im first ,, just like old times
Welcome back doc!
Aaaahhh…! Brings back old memories, Doc…you were relentless!!! 🙂