
A new low below 3,027.98 invalidates an impulse unfolding upwards and suggests this big fifth wave may be an ending expanding diagonal. Diagonals are not as common as impulses in fifth wave positions, and so until an impulse is invalidated a diagonal should always be considered a lower probability. Sometimes lower probability outcomes occur, and they will never be the most expected.
Summary: The larger trend is up. Consolidations and pullbacks may last a few weeks but should be viewed in the bigger context of an ongoing bull market. At support they may provide opportunities to join the trend.
This current correction is very deep, but it will now be expected to end below 2,905.99.
The biggest picture, Grand Super Cycle analysis, is here.
Last monthly charts analysis is here with video here.
ELLIOTT WAVE COUNTS
FIRST WAVE COUNT
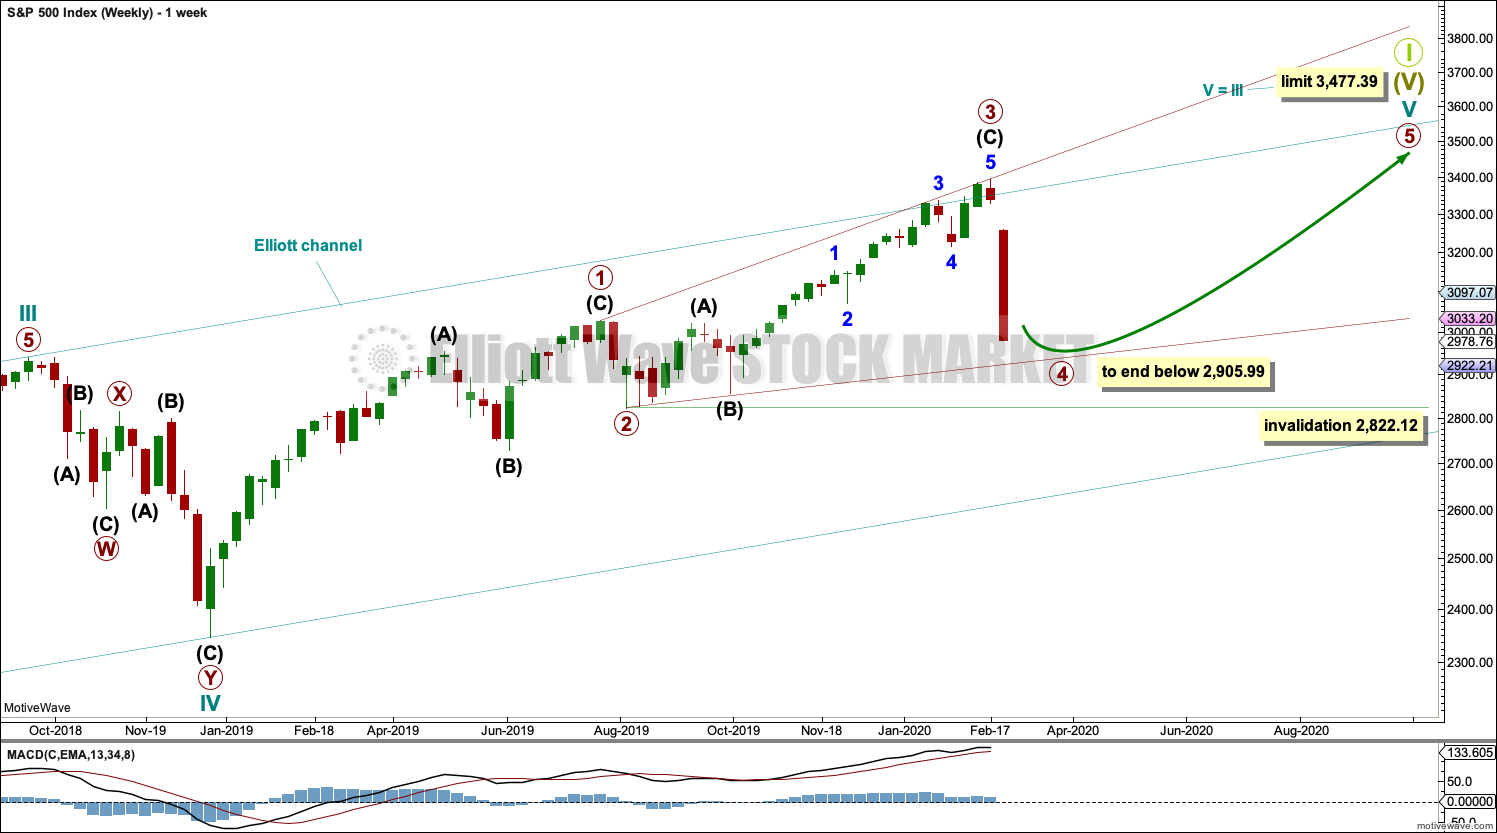
WEEKLY CHART
Click chart to enlarge.
Cycle wave V may subdivide either as an impulse or an ending diagonal. Impulses are much more common, but at this stage an impulse is now invalidated and so the only remaining possible structure is a diagonal.
At this stage, cycle wave V may end within this year or possibly into next year.
A channel is drawn about the impulse of Super Cycle wave (V) using Elliott’s first technique. Draw this channel first from the high of 2,079.46 on the 5th of December 2014 to the high of 2,940.91 on the 21st of September 2018, then place a parallel copy on the low at 1,810.10 on the 11th of February 2016. Cycle wave IV found support about the lower edge.
Within Super Cycle wave (V), cycle wave III may not be the shortest actionary wave. Because cycle wave III is shorter than cycle wave I, this limits cycle wave V to no longer than equality in length with cycle wave III at 3,477.39. A new high by any amount at any time frame above this point would invalidate this main wave count in favour of one of the two alternate wave counts in the monthly chart analysis which are much more bullish.
The daily chart below will focus on movement from the end primary wave 2.
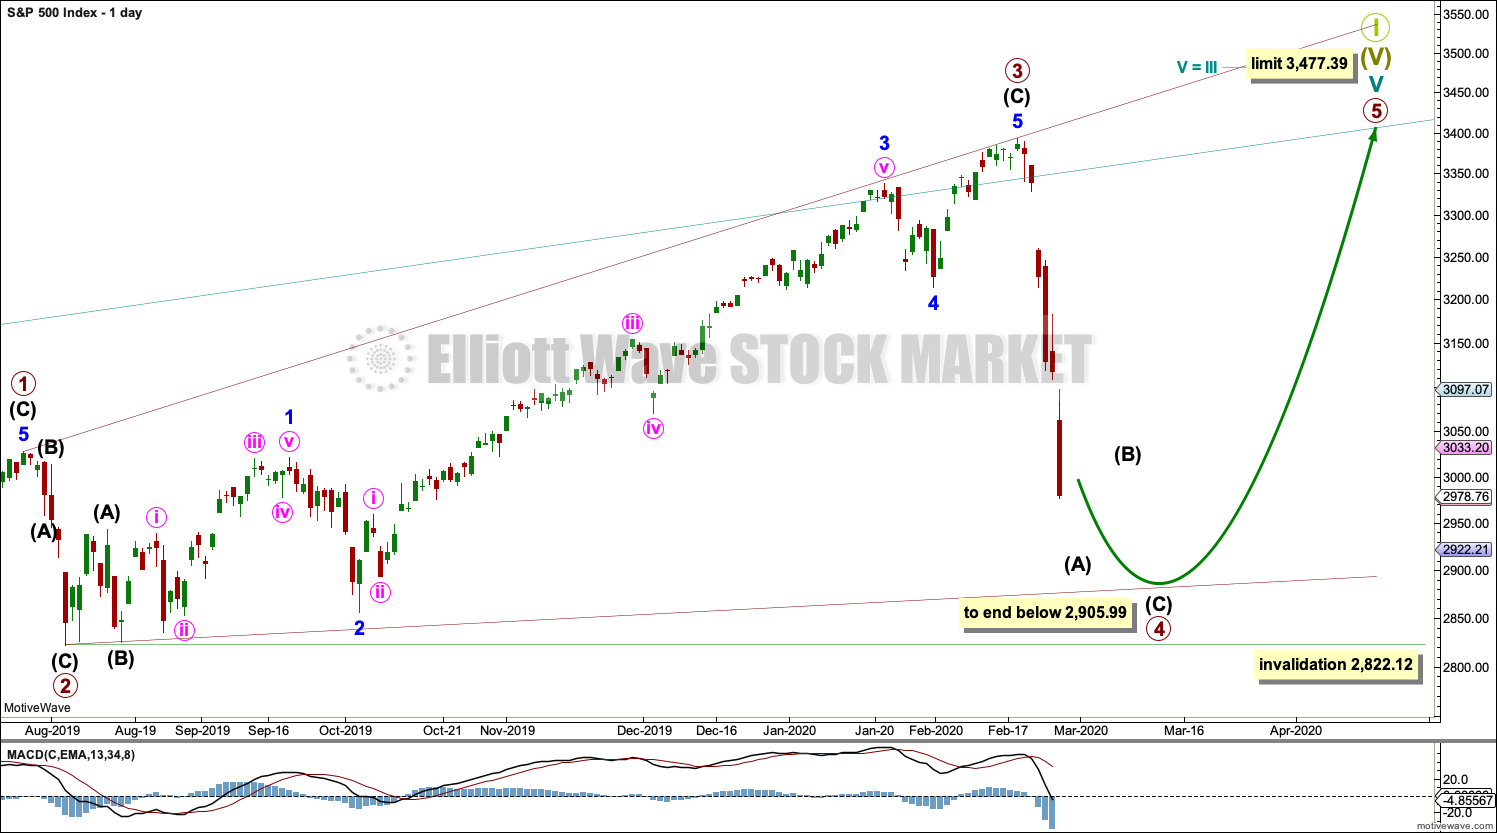
Ending diagonals require all sub-waves to subdivide as zigzags. Primary wave 4 of a diagonal must overlap primary wave 2. This rule is now met. Primary wave 4 may not move below the end of primary wave 2 below 2,822.12.
This ending diagonal would be expanding. Primary wave 3 is longer than primary wave 1, and primary wave 4 so far is longer than primary wave 2. Primary wave 5 would need to be longer than primary wave 3 for all rules regarding wave lengths of expanding diagonals to be met.
Fourth and second waves of diagonals most commonly end somewhere between 0.66 to 0.81 of the prior wave. This gives a target zone for primary wave 4 from 3,016.40 to 2,930.69. However, this diagonal is expanding and primary wave 5 needs to be longer in length than primary wave 3, which was 571.40 points for this rule to be met. This rule needs to be met prior to the upper limit for cycle wave V at 3,477.39, so primary wave 5 would need to begin below 2,905.99.
DAILY CHART
Click chart to enlarge.
All sub-waves of an ending diagonal must subdivide as zigzags. This is the only Elliott wave structure where a third wave sub-divides as anything other than an impulse.
Primary wave 4 must subdivide as a zigzag. Within the zigzag, there would very likely be a sharp bounce or a time consuming sideways consolidation for intermediate wave (B).
Diagonals normally adhere very well to their trend lines, which may be tested within the sub-waves. The lower 2-4 trend line is drawn to sit across the lows of corrections early within primary wave 3. This lower trend line may be about where primary wave 4 may find eventual support.
Primary wave 4 may not move beyond the end of primary wave 2 below 2,822.12.
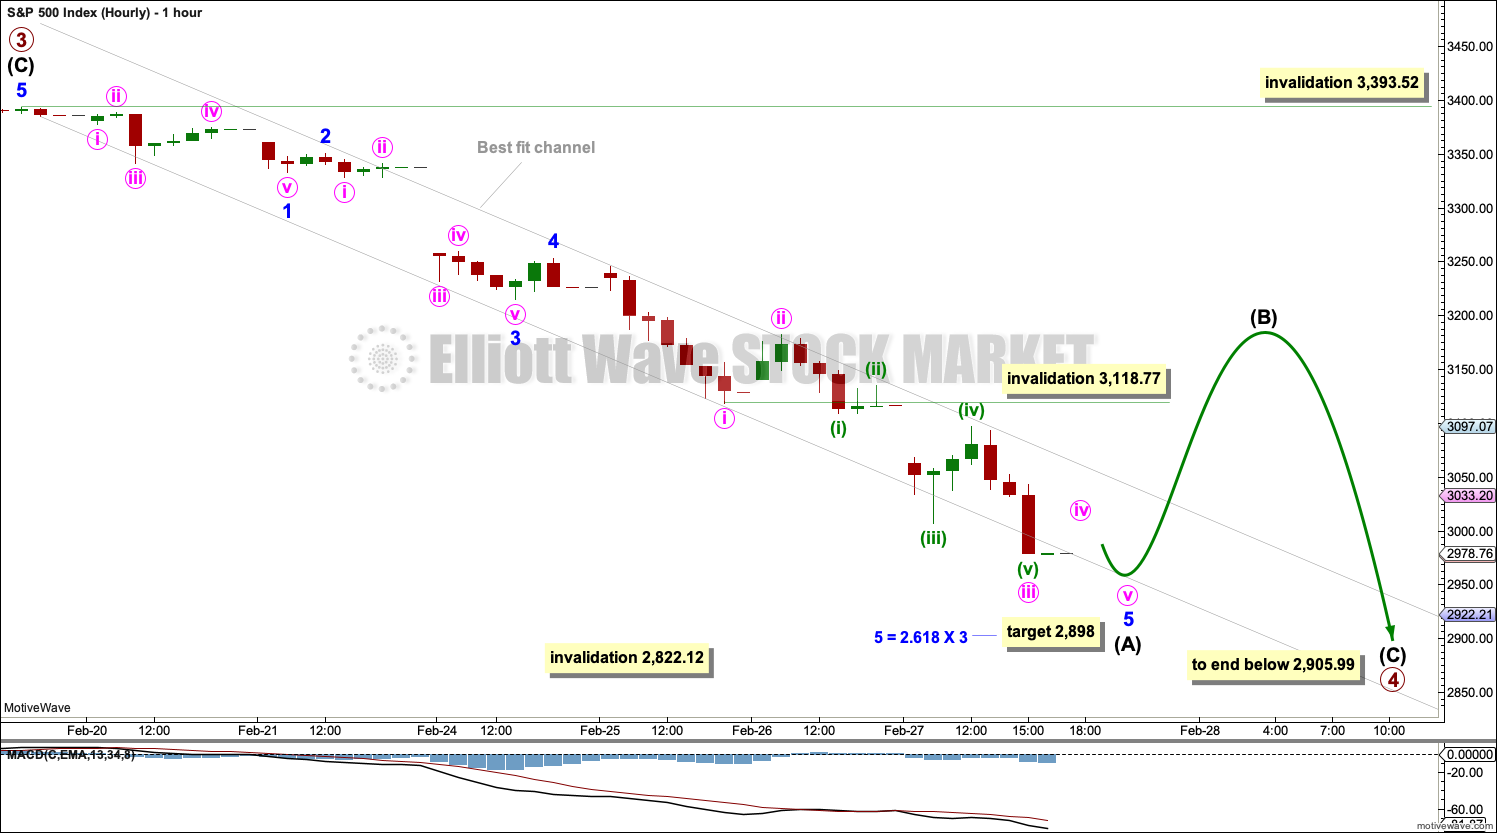
HOURLY CHART
Click chart to enlarge.
Primary wave 4 within a diagonal must subdivide as a zigzag. Within the zigzag, intermediate wave (B) would very likely show on the daily and weekly chart for primary wave 4 to have the right look. Intermediate wave (B) so far does not show up on the daily chart, so it may not yet have begun.
Intermediate wave (A) may be incomplete.
Intermediate wave (A) must subdivide as a five wave motive structure, most likely an impulse. Within the impulse, minor waves 1 to 4 may be complete and minor wave 5 may be extending. Within minor wave 5, minute wave iv may not move into minute wave i price territory above 3,118.77.
The best fit channel continues to indicate where price is finding resistance, although the strength of downwards movement has broken below support. Assume price may continue to fall while price remains below the upper edge of this channel. When this channel is breached by upwards movement, that may be taken as indication that intermediate wave (A) may be over and intermediate wave (B) may have begun.
Intermediate wave (B) may not move beyond the start of intermediate wave (A) above 3,393.52.
SECOND WAVE COUNT
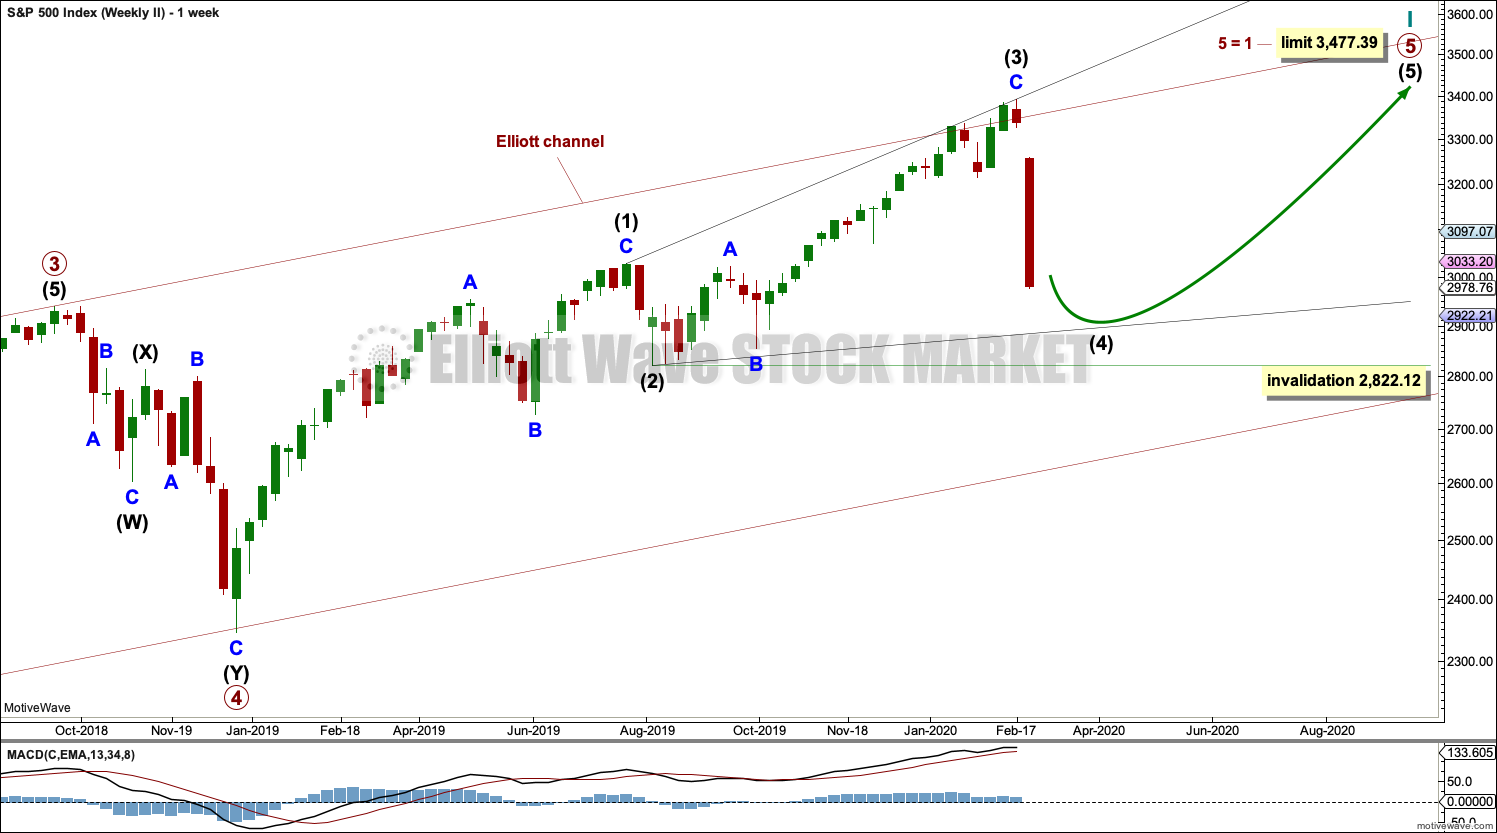
WEEKLY CHART
Click chart to enlarge.
This second wave count sees all subdivisions from the end of the March 2009 low in almost the same way, with the sole difference being the degree of labelling.
If the degree of labelling for the entirety of this bull market is all moved down one degree, then only a first wave at cycle degree may be nearing an end.
When cycle wave I is complete, then cycle wave II should meet the technical definition of a bear market as it should retrace more than 20% of cycle wave I, but it may end about either the 0.382 or 0.618 Fibonacci Ratios of cycle wave I. Cycle wave II may end close to the low of primary wave II within cycle wave I, which is at 1,810.10. It is also possible that cycle wave II could be fairly shallow and only barely meet the definition of a bear market.
An ending expanding diagonal is still viewed as nearing an end. This wave count labels it primary wave 5. Primary wave 5 may still need another year to two or so to complete, depending upon how time consuming the corrections within it may be.
Primary wave 5 may be subdividing as a diagonal, in the same way that cycle wave V is seen for the first weekly chart.
TECHNICAL ANALYSIS
WEEKLY CHART
Click chart to enlarge. Chart courtesy of StockCharts.com.
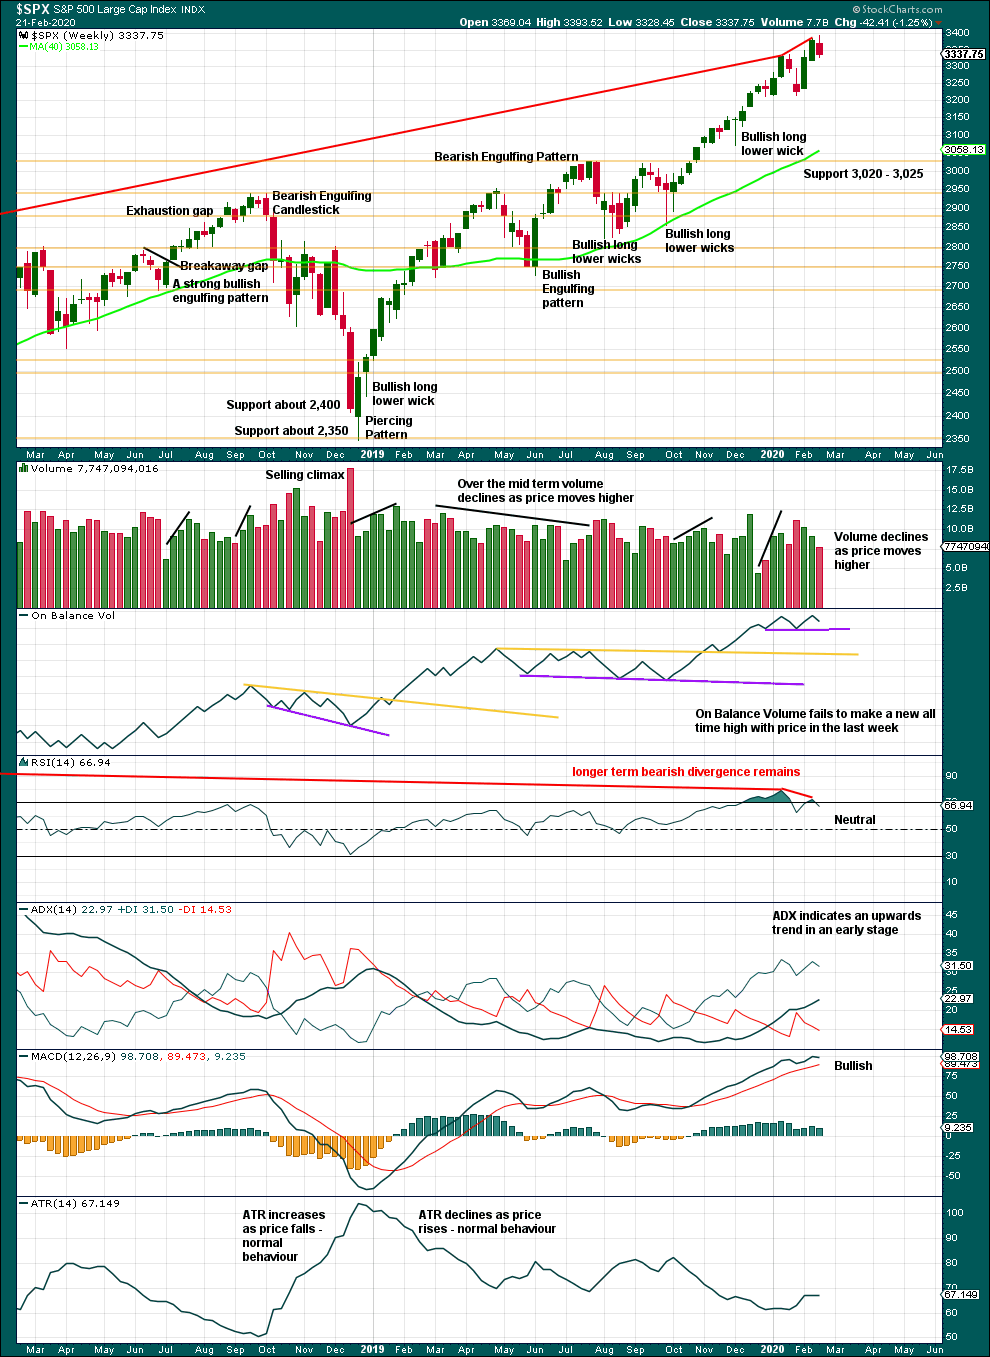
It is very clear that the S&P is in an upwards trend and the bull market is continuing. Price does not move in straight lines; there will be pullbacks and consolidations along the way.
This chart is overall bullish. There are no signs of weakness in upwards movement.
This bull market beginning in March 2009 has been characterised now for many years by rising price on declining volume. Despite all technical textbooks stating this is unsustainable, it has now been sustained for over a decade. This is concerning for an eventual bearish move as it may mean that support below is thin and weak, but for now the bull market continues. A decline in volume in current market conditions shall not be read necessarily as bearish.
Further pullbacks or consolidations will unfold. Do not expect price to move in a straight line. Pullbacks to support in a bull market may be used as opportunities to join an established trend.
Continued bearish divergence for the short term between price and RSI suggests the risk of a pullback remains high.
Last week sees upwards movement, but this is not confirmed by On Balance Volume.
DAILY CHART
Click chart to enlarge. Chart courtesy of StockCharts.com.
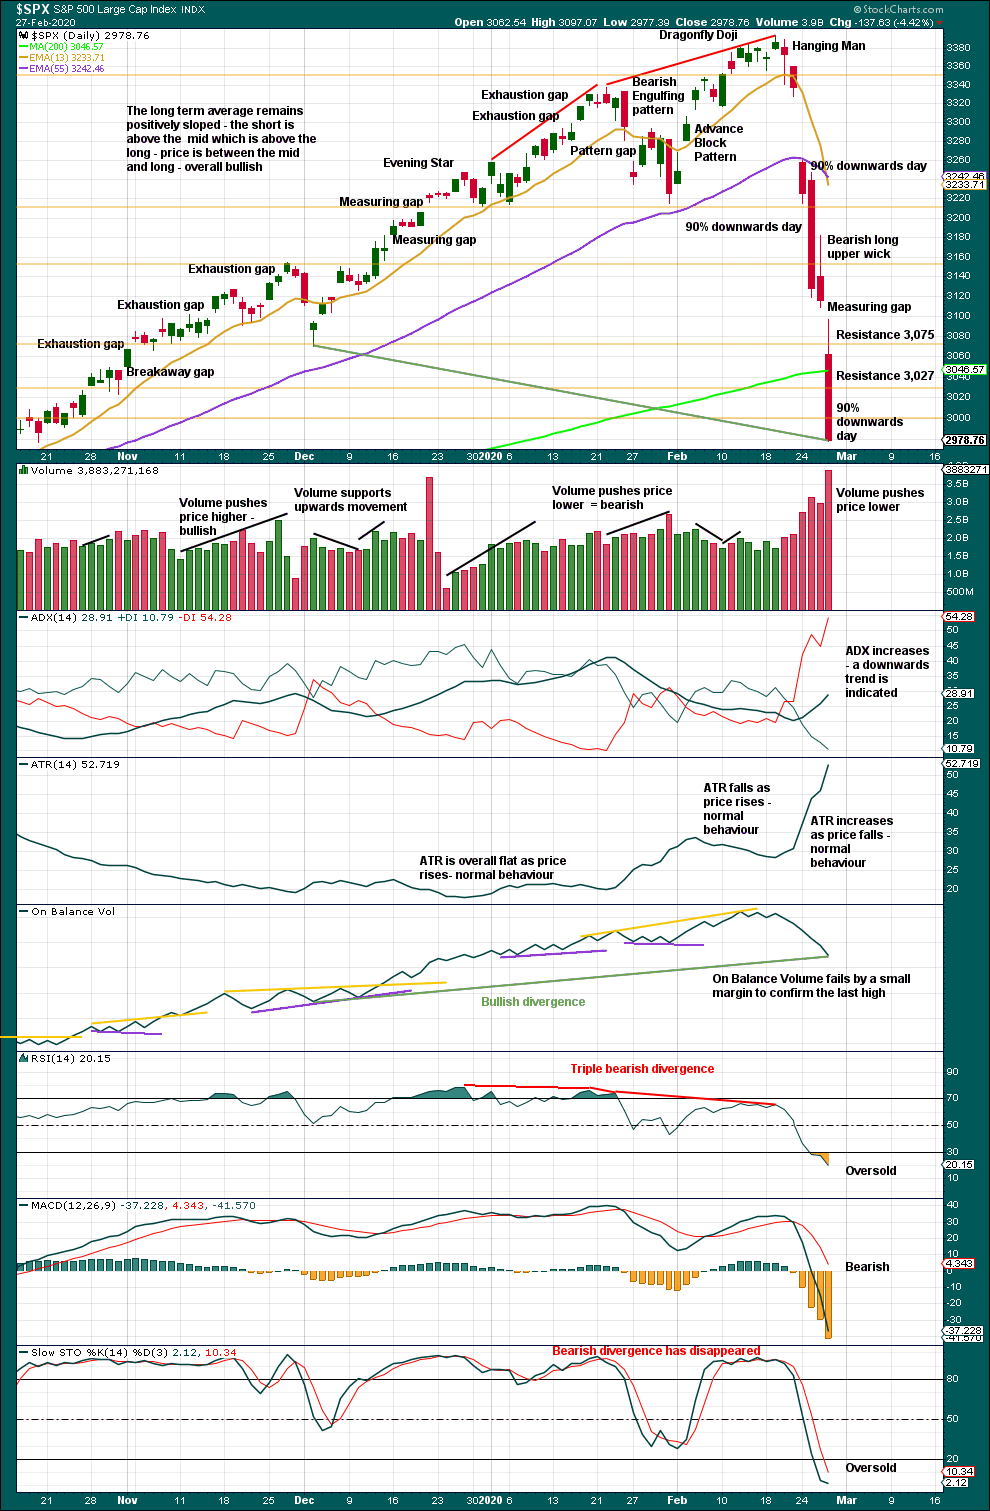
The larger trend, particularly at the monthly time frame, remains up. Expect pullbacks and consolidations to be more short term in nature although they can last a few weeks.
There are now three 90% downwards days in this strong downwards movement.
Following a 90% downwards day, either a 90% upwards day or two back to back 80% upwards days within 3 sessions would be required to indicate a 180°reversal in sentiment and indicate a sustainable low may be in place.
With RSI now deeply oversold today, it would be reasonable to expect a bounce here or very soon. The measuring gap today gives a target at 2,946.25.
BREADTH – AD LINE
WEEKLY CHART
Click chart to enlarge. Chart courtesy of StockCharts.com. So that colour blind members are included, bearish signals
will be noted with blue and bullish signals with yellow.
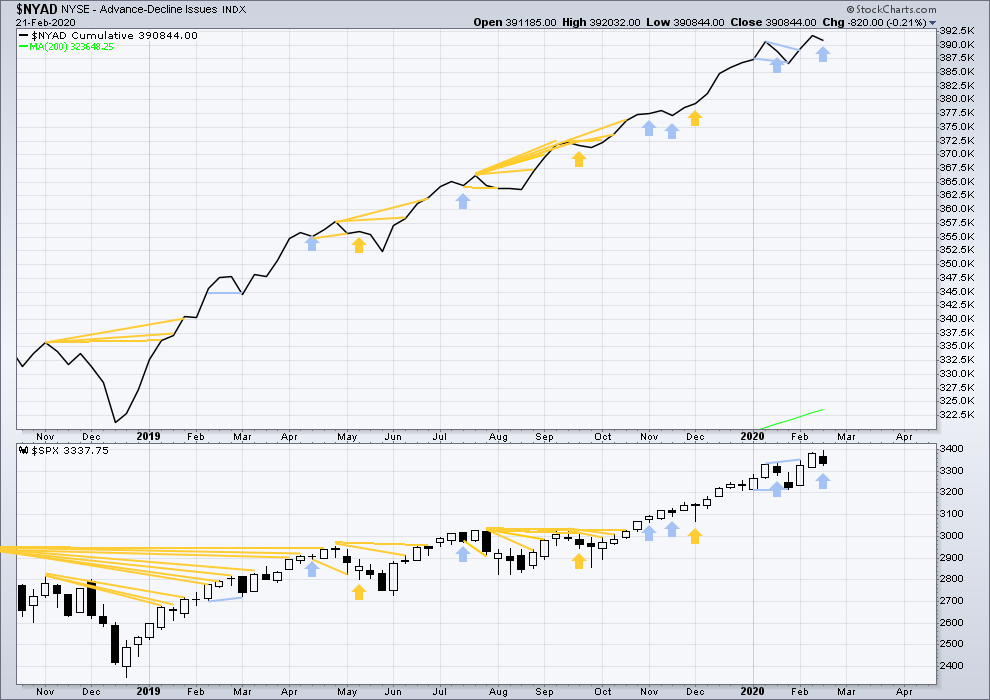
Bear markets from the Great Depression and onwards have been preceded by an average minimum of 4 months divergence between price and the AD line with only two exceptions in 1946 and 1976. With the AD line making new all time highs last week, the end of this bull market and the start of a new bear market is very likely a minimum of 4 months away, which is mid June 2020.
In all bear markets in the last 90 years there is some positive correlation (0.6022) between the length of bearish divergence and the depth of the following bear market. No to little divergence is correlated with more shallow bear markets. Longer divergence is correlated with deeper bear markets.
If a bear market does develop here, it comes after no bearish divergence. It would therefore more likely be shallow.
Last week price has moved higher, but the AD line has moved lower. This single week instance of bearish divergence supports the main Elliott wave count.
Large caps all time high: 3,393.52 on 19th February 2020.
Mid caps all time high: 2,109.43 on 20th February 2020.
Small caps all time high: 1,100.58 on 27th August 2018.
DAILY CHART
Click chart to enlarge. Chart courtesy of StockCharts.com. So that colour blind members are included, bearish signals
will be noted with blue and bullish signals with yellow.
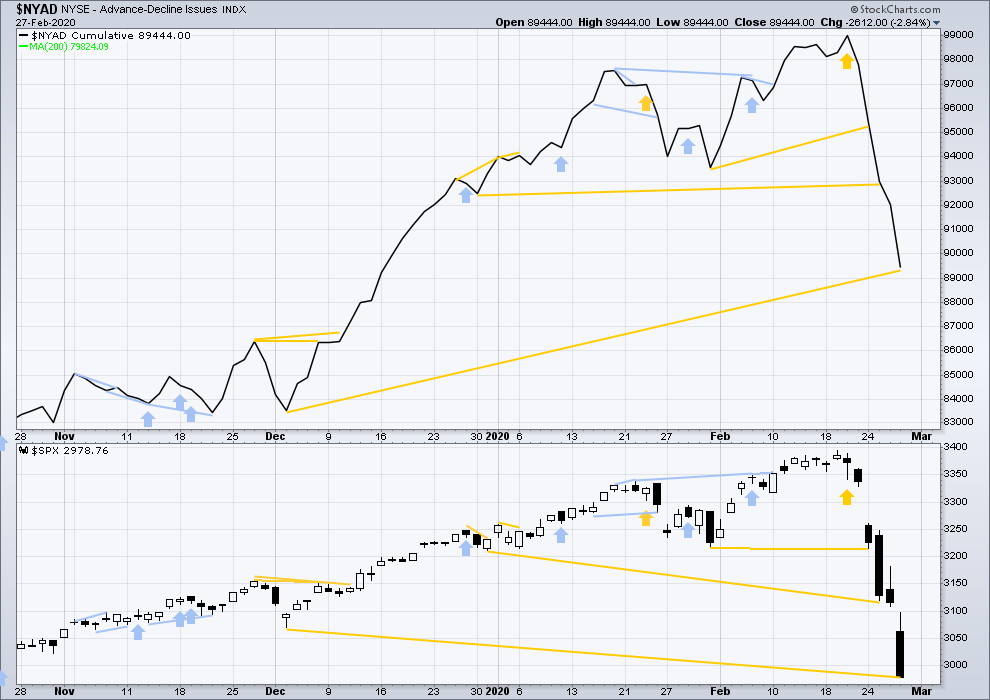
Breadth should be read as a leading indicator.
Today price has made a new low below the prior small swing low of the 3rd of December 2019, but the AD line has not. Price is falling faster than market breadth. This divergence is bullish.
VOLATILITY – INVERTED VIX CHART
WEEKLY CHART
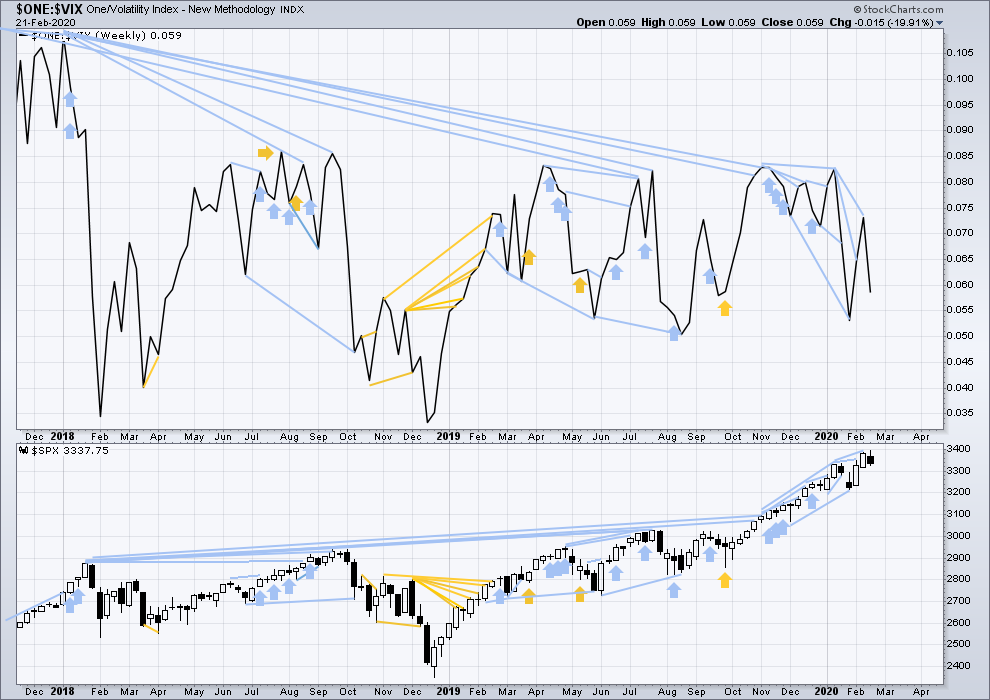
Click chart to enlarge. Chart courtesy of StockCharts.com. So that colour blind members are included, bearish signals
will be noted with blue and bullish signals with yellow.
The all time high for inverted VIX was on 30th October 2017. There is now over two years of bearish divergence between price and inverted VIX.
The rise in price is not coming with a normal corresponding decline in VIX; VIX remains elevated. This long-term divergence is bearish and may yet develop further as the bull market matures.
This divergence may be an early warning, a part of the process of a top developing that may take years. It is clearly not useful in timing a trend change from bull to a fully fledged bear market.
Last week both price and inverted VIX have moved lower. There is no new short-term divergence.
DAILY CHART
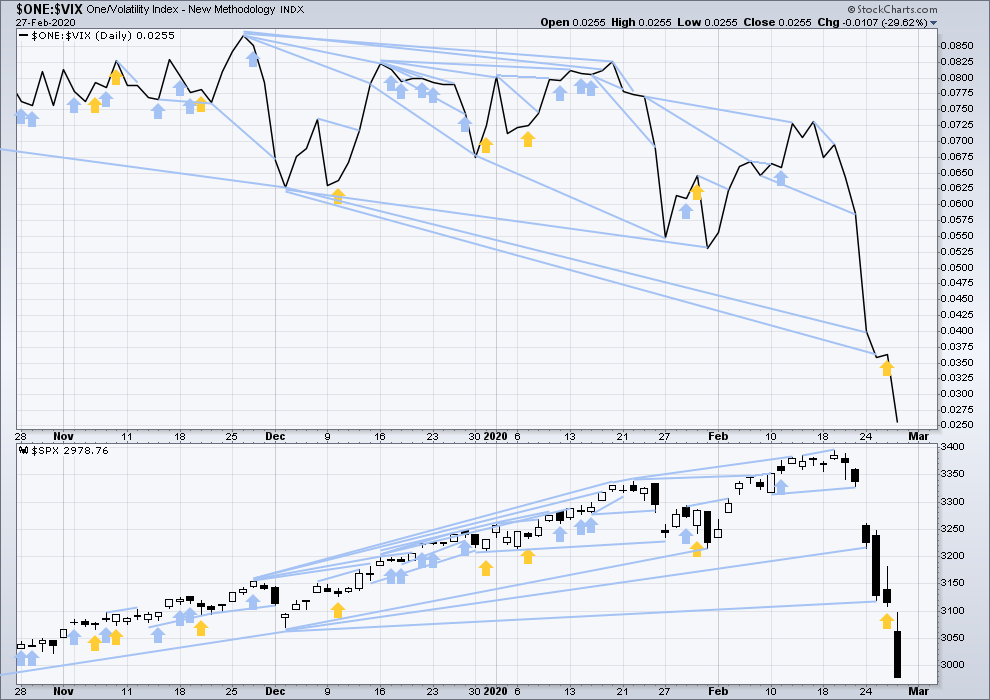
Click chart to enlarge. Chart courtesy of StockCharts.com. So that colour blind members are included, bearish signals
will be noted with blue and bullish signals with yellow.
Today both price and inverted VIX have moved to make new mid-term lows. There is no new divergence.
DOW THEORY
Dow Theory confirmed a bear market in December 2018. This does not necessarily mean a bear market at Grand Super Cycle degree though; Dow Theory makes no comment on Elliott wave counts. On the 25th of August 2015 Dow Theory also confirmed a bear market. The Elliott wave count sees that as part of cycle wave II. After Dow Theory confirmation of a bear market in August 2015, price went on to make new all time highs and the bull market continued.
DJIA: 23,344.52 – a close on the 19th of December at 23,284.97 confirms a bear market.
DJT: 9,806.79 – price has closed below this point on the 13th of December.
S&P500: 2,532.69 – a close on the 19th of December at 2,506.96 provides support to a bear market conclusion.
Nasdaq: 6,630.67 – a close on the 19th of December at 6,618.86 provides support to a bear market conclusion.
With all the indices having moved higher following a Dow Theory bear market confirmation, Dow Theory would confirm a bull market if the following highs are made:
DJIA: 26,951.81 – a close above this point has been made on the 3rd of July 2019.
DJT: 11,623.58 – to date DJT has failed to confirm an ongoing bull market.
S&P500: 2,940.91 – a close above this point was made on the 29th of April 2019.
Nasdaq: 8,133.30 – a close above this point was made on the 26th of April 2019.
Published @ 07:37 p.m. EST.
—
Careful risk management protects your trading account(s).
Follow my two Golden Rules:
1. Always trade with stops.
2. Risk only 1-5% of equity on any one trade.
—
New updates to this analysis are in bold.
Sorry I’m here a bit late today, just got into Austin.
I’m going to label intermediate (A) over, tentatively, because of the long lower wick and strong close into the green today.
Austin rocks!!!
🙂
keep Austin weird
any guesses as to how high B goes?
If this wave down is finished, 3180-ish is a previous 4 and 61.8 retracement of the entire drop so would be a beautiful target.
Lara: is there a count under which the drop this week is all if wave 4, and we are back in the bull market? Or do we absolutely need BC.
(I read this A as a 5 wave, so I guess I can answer my own question….)
In other words, if the market rallies to 3180 next week, is short the best trade?
Have a good weekend
consider some timing here, there are rumors of some kind of bailout this weekend, that could take care of B, then the likelyhood of more bad virus news to knock us back down to the end of 4. also rumors that the fed will lower rates significantly to put us back into bull mode. next fed meeting is mid March
also,, Israel has reported they will have a vaccine in a few weeks, about the same time as Fed meeting
If this hits the street Monday and backed by tire official statements, ride back up will be fast and furious.
Meant true official… autocorrect damm
Yep! Second waves up at this degree always are. Believe it or not, we could even see a new VIX low! If that happens on divergence it would be the most ominous thing I have ever seen in all my trading days…!
Lara – am I understanding correctly that B can go as high as 3393 and it will still be acceptable. I am wondering given the aggressive down move, if a similar if not more aggressive up move might unfold given FED weighed in late afternoon yesterday.
We are right in the middle of the channel which is still down, but at least we are off the bottom of the channel. Some progress already:)
By the way, VIX is the second highest in history since 2008 crisis.
Wow, last minute push to the top of the channel is amazing. They always wait till the last minute.
I managed to reload on UWM before the close as it started spiking. Maybe we finally get a gap up and go on Monday.
BTW, news from unnamed sources who do logistics for unnamed mega-cap products company, “situation is much better in China”, said individual started exiting a month ago, and starting buying back today.
Keep an eye on the case rate at the website coronavirus.app. While China may be getting better, that’s only after draconian measures. The rest of the world might catch on fire, and if it’s draconian measures everywhere…watch out below in the stock market.
But by then maybe it will get warmer and virus could die on its own:)
I must say I’m concerned with the lack of a reversal in VIX. I figured at levels near 50 it wouldn’t just stay here and hang out.
$VIX has a long upper wick and a Shooting Star. That’s a bearish reversal pattern. Just not the strongest one possible… that’d be a bearish engulfing pattern.
Can the first move up be counted as a leading diagonal? Cause I can’t count a 5 up…..
As Lara says all subwaves of Expanding Diagonals must be zig zags, thus 3 waves.
Primary 1 from the Dec 18 low to the April high must be a 3 wave zig zag.
The breakdown isn’t as clear as Primary 3 but I have the top of (A) at the top of the week of Mar 4 and (B) at the bottom of the same week and obviously (C) at the April high.
Here’s an amusing hedge strategy a friend of mine is using: buying calls on cemetery companies, and buying puts on retirement home companies. Creative thinking I guess.
Kevin, dont let Mr Market twist your thoughts. We need to clear headed!
Twisted indeed.
Speaking of which, I used the little double bottom in RUT to get in via UWM with super super tight stops. I’ve tripled up since and now have a break even stop on that. If it gets to above the recent hourly highs I’ll double up again. We’ll see…it probably stops out but it’s a free trade now.
If you want to keeps tabs on actual data (vs. “news reports”), coronavirus.app has the raw data on infections levels etc. Watch for any indication of the start of exponential rising levels…
A good long set up in RUT is structuring itself here. I’m watching /RTY (RUT futures) specifically, and the trigger level is marked with the blue dashed line.
Just the moment you said it, SPX changed its mind and reversed direction down again. Let’s see what it does next. It might be just retesting the middle of the channel and will come back up again.
Market is indecisive of where to go at around 2900 level.
Lara’s statement is that the trend is up, and per her measures that is true.
My measurement technique (a unique usage of DMI and CCI) on the other hand indicates the monthly trend is now DOWN at the monthly time frame, with a “mild down” reading (out of strong down, mild down, neutral, mild up, and strong up set of levels, which I color code as red, orange, purple, blue, and greens respectively).
There are a couple of other things of note on this chart. First, the lows to date are at a significant cluster of Fibonacci levels, and at a significant prior pivot low level. Additionally, price tagged the 21 ema (green line) but didn’t not penetrate through it. If it had (or does), my expectation goes way up that price is heading to the lower volatility band (lower purple line around 2526 right now).
Just some different perspectives.
Looks like the market is trying hard to break from the middle to the top of the down channel now. Let’s see if they are able to push it there. Looks like the bounce might start from here.
Well, there was a 4/5 left on the daily chart ….. one more down? I have that chicken dinner in the freezer still …
Test #1 passed: the market fell after yet another big gap, but turned back up after “only” about a 100 point further fall.
Test #2 approaching: can the market GAP FILL for the first time this week? Or do we see the exact same behavior of reaching the gap, maybe a small put in…and a roll over and die?
GOLD leverage ETFs (check NUGT) getting pounded…lots of margin calls I suppose
What is this sharp fall in Gold telling us? It’s doing what my technical analysis from a few weeks ago suggested (would hit the recent high levels and turn down), but given the market meltdown…isn’t gold the “safe haven” that capital should be flowing to (among a few others)? Scratching my head about gold’s sharp reversal here.
That’s why I was asking Lara last day why GLD and SLV are down. She said they are not correlated which is true but safe heaven is still there. However, maybe the market doesn’t think its’ end of the world yet.
Lara has been calling for a large gold pullback/reversal in her gold analysis for some time now… since it first hit 1,600 actually… but it just kept going up as commodities do in their 5th waves.
Here’s the reversal!
Thanks, Ari. So according to Lara, Gold is going down for good or is it just a correction?
I think it may have found a Super Cycle degree high four days ago.
There must be millions of margin calls this week that need to be fulfilled overnight. I think people are selling their gold to put proceeds into margin calls on equities. Trouble is they may also be seeing margin calls on their gold positions as well. Leverage can unwind very quickly and make matters profoundly worse. I am guessing we have seen a lot of this for the past several days.
Traders long Gold forced to liquidate to meet margin calls on equities.
Happens every time…
Repo action pretty quite so far only $26 billion…
If the FED is indeed withdrawing the liquidity from the markets, this will get very very ugly in a wink of an eye.
Yet another VIX bull flag.
On the way up reversal signs kept getting violently negated as banksters crushed bearish traders and stymied every market attempt to execute a normal correction.
On the way down the OPPOSITE appears to be happening, the obvious result of shorts being driven from the market. No one left to cover…
I cannot believe this is still regarded as a correction.
Surely the biggest 1 day points drop in history signals a change of direction and the start of a bear market?
Nick – My thoughts but I am sure the powers to be will manipulate the current situation well as they have in the past.
I am not sure if and when an action might be taken but the speed of the drops tells me updated low per lara’s post below might also be at risk of violation pretty soon.
What’s the definition of a bear market? -20% isn’t it? Not at that level…yet.
Could it lead to that? I think we’ve all learned to never say never!!!
Is this price collapse discounting in a vast exponential spread of this virus around the world, and so if/as that happens, price will behave per the latest main?
Or…if this thing goes exponential over the next few weeks, might we see a continuation of a GSC wave 2 event? With price eventually plunging over, oh, say 61.8% total?
Idle speculation, but if this has taught me ANYTHING, it’s to not be surprised by the vastly unexpected.
If the world “shuts down” to protect itself as best it can, business largely stops. Is it possible this is only the small beginning?
Crazy times.
Kevin – you are right – never say never – that’s for sure. Just several days ago we were talking about ATHs on a daily basis and you were drawing new projections higher. And I was thinking fundamentals don’t support this move and there was a strong multi-year resistance line that SPX kept hitting and eventually collapsed. Now I think this move down is also overreaction. And I might be wrong as we all are a lot of times. However, technically there is a multi-year support trendline right under current price action (currently at around 2810s). And we might go under it temporarily but as long as monthly candle closes above it, then we are still in a bull environment. I believe market will go below it to test us all, but will not break it yet. And if it does, then that’s when we can say that bears took over for sure.
I just wonder what happens to this market if CV infection rate blooms exponentially. Does this market tank another 1000 points or more? I think there is potential for that. The technical and EW count, should that happen, will “adapt” appropriately. Technical and EW do not predict anything. They are only roadmaps of what is likely. CV has the potential to be similar, for example, to a surprise large meteor strike that causes some significant short term global cooling; a shock event that is largely unpredictable and blows away the current roadmaps of what is likely.
I will be put on some ratio back spreads. But I really, really want a B wave set up for that.
Updated weekly and daily charts:
Kinghts below has pointed out quite correctly that the way I have the diagonal labelled primary 1 was actually longer than primary 3.
That labelling is invalid.
For the diagonal to be valid the end of primary 1 must be moved left. Now primary 1 is < primary 3, and primary 2 is < primary 4. This changes the invalidation point and the calculation of where primary 5 must begin for the structure to end before the limit.
Updated daily chart
Thanks and welcome to the States in the midst of this storm.
Just to be clear, those arrows aren’t doing the required move justice. Price is below 2900 already without any B yet, and the final arrow low above is pointing to about 2900, whereas it should be pointing about 100 points lower than that. Not that arrows matter much but I was confused for a moment by it.
Is there going to be a B up next week folks? Or might this go down one or two or more hundreds of points first? These are the times that try men’s souls…got tough decisions to make.
*solemnly walks to the woodshed
yea, some of that, but more than that, when’s the time to put on a put back ratio to take advantage of the potential of a total meltdown here?
the propensity of the market now to make massive moves in the overnight futures market instead of the day session makes it particularly challenging. I would be surprised ZERO to see the market down 300 more points over the weekend, for example. And I would be surprised zero to see it up 100 points as well.
It’s a wild beast right now.
Thank you, Lara. This looks much better now. I hope you enjoy your time in TX!
Oh well… Someone on FED just stated coronavirus impact unknown so premature to plan any action…EVANs
Different members say different things, but at the end they do it anyway. Don’t look too much into what they say. I clearly remember how they were saying all along they won’t cut, and they still did. So it’s all speculation. Reality will be when they realize they have to do something regardless. It’s like a drug that any market cannot leave without nowadays.
Shooting star in VIX.
ES trying to hammer out a bottom.
Are the banksters finally stirring?
RR on remaining trades.
Wow! Trades absolutely EXPLODED! I was a bit worried about the triply leveraged as they can bite both ways and that was some insane position sizing. (I don’t recoomend it!)_
Was that dumb luck?
I am not doing that again anytime soon…except for the upcoming short vol trade of course! 😀
Today might provide a bottom if the NYSE’s McClellan Oscillator reading for yesterday (-379.97) is considered in comparison to Dec. 2018 reading (-330). However, these numbers could still head lower as we have seen from last few days.
Getting to 2,800s was unimaginable last week but here we are knocking at the door for 2800s.
Probably Monday. Fridays not generally friendly to capitulation moves…
There is rumour fed funds rate cut is coming and some say close to 1/2 basis points plus repo activity will increase to support the financial markets.
Rishi
I was watching the business in Sydney some hours ago and the commentator did mention central banks were probably going to step in this weekend if I heard correctly too prop the market. How these guys know when is beyond me
Yep! Looks like you’re right about a possible turn today. Rare over-night VIX gap higher with shooting star. Looks like capitulation…
Verne – I noticed MSFT and markets turn coincides with fair accuracy. I recall mentioning MSFT short a few weeks back as charts were pointing to 135ish range for MSFT by May/June. Got scared by the bullish sentiment and passed the opportunity. Next time will pay closer attention.
It will be when GS tells them as they run the markets.
Lara- I measured primary wave 1 (as you have labeled) from Dec 2018 low to July 2019 high as 676.88 points. I do agree primary wave 3 is 571.42 points … but…
“This ending diagonal would be expanding. Primary wave 3 is longer than primary wave 1, and primary wave 4 so far is longer than primary wave 2. Primary wave 5 would need to be longer than primary wave 3 for all rules regarding wave lengths of expanding diagonals to be met.”
would mean wave 3 is actually the shortest wave.
Please clarify how you measured primary wave 1 to make it shorter than wave 3. I don’t see it. Or am I missing something?
Thanks for your help
Very good point knight.
I think it can still work if u change the labelling to consider 2954 top as 1, then 2728 as low of 2 then 3393 as high of 3..
thanks for you help!
I don’t believe it… you’re right.
I’m wrong. And the count needs to be fixed.
Primary 1 needs to be moved left to 1st May 2019.
That’s what you get when you try and do a wave count after a 13 hour flight.
thank you for your help! Your awesome. please enjoy your stay here in the U.S.!
Thank you, this was a big catch!
This analysis is an awesome road map for what may come. Suddenly things start makes a bit of sense… dare I say!
Much happier with this count-both from an EW point of view as well as the future trading potential.
Well done Lara.
Thanks Peter.
Now of course I’m wishing that I had this count as an alternate for you all for weeks now.
But then EDs are not nearly as common as impulses. So I have to go with the most common structures, until it’s not that.
Taking some contingency trade profits off the table. Those are trades that make you sweat just a tad…! Went in a bit too heavy…yikes! (definitely not for the faint of heart )! 😉
2923 so far
Is hourly chart target 2898 correct?
Target for (A) of Primary 4 only.
Target for (C ) of Primary 4 presumably would be less than 2898 to avoid a truncation.
Thanks.
I am certainly no EW guru but wonder, if (A) target is 2898 how can (C) end slightly below 2905.99 ?
I don’t think Lara said anywhere that the target should be slightly below 2905. She said for the wave length to be proper the whole structure has to complete below 2905 but above invalidation price of 2822. So it could be anywhere within this range for that count to play out.
Yep.
Hi everyone.
Could we see 2906 and would that be a good entry
Anyone’s guess would be as good as anyone else’s. You have to wait to see signs is a reversal in 5, 15, 60, 120, 240 minute charts. And then daily.
I’ll go with daily for confidence. And preferably then also a 90% up day or two back to back 80% up days.
So we may know within a very few days when a sustainable low is in.
If primary 5 has to be at least 571.40 points long, what a ride to the top this is going to be.
That won’t be anything compared with the ride down afterward!!!
Ha ha yes that’s for sure but first things first !
well said Kevin.
🙂
Still gives me chills every-time you chart what I am thinking!
Bingo! 🙂
The ending diagonal structure we now have seems to fit pretty well with the widespread social discord we’ve been seeing for quite a while. It all makes more sense to me now.
Very interesting. Let’s hope it plays out exactly that way