
Downwards movement continues as last analysis expected. Next identified support has not yet been reached.
Summary: The trend is up. Consolidations and pullbacks may last a few weeks but should be viewed in the bigger context of an ongoing bull market. At support they may provide opportunities to join the trend.
Intermediate wave (4) has arrived and is forming deeper than expected but remains above the invalidation point. It may continue lower or sideways for another one to few weeks before the bullish trend resumes. Next support may be about 3,075 and below that 3,040. Use the narrow channel on the hourly chart to indicate when this first wave down may be complete.
Two more large pullbacks or consolidations (fourth waves) during this year and possibly into next year are expected: for intermediate (4) (which is now underway) and then primary 4.
If price makes a new high by any amount at any time frame above 3,477.39 (even a fraction of a point on a tick chart), then this analysis switches to one of the very bullish alternate monthly charts. The next cycle degree target would then be either 4,092 or 4,213.
The biggest picture, Grand Super Cycle analysis, is here.
Last monthly charts analysis is here with video here.
ELLIOTT WAVE COUNTS
FIRST WAVE COUNT
WEEKLY CHART
Click chart to enlarge.
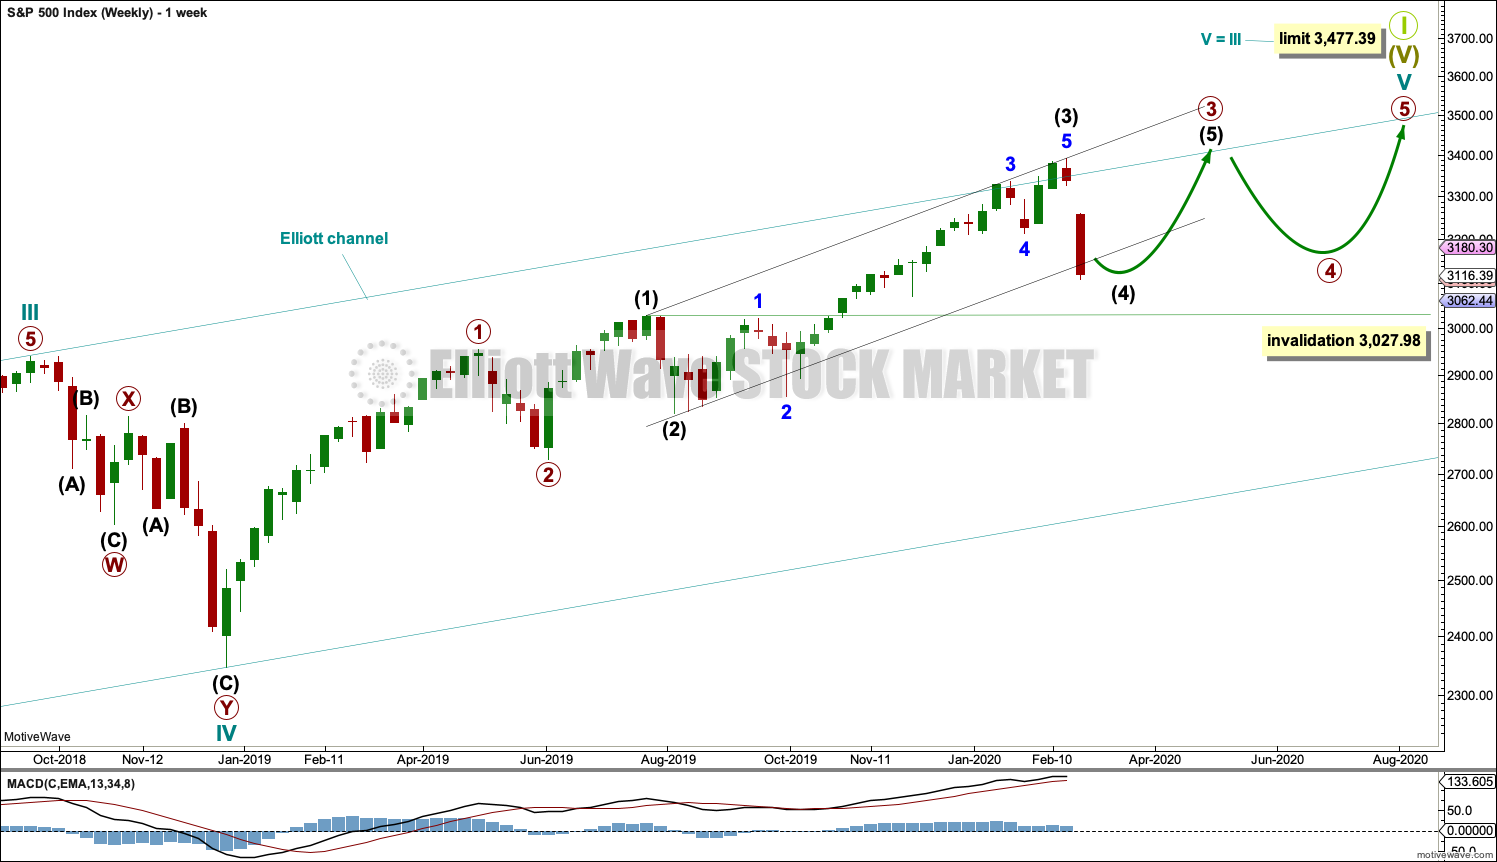
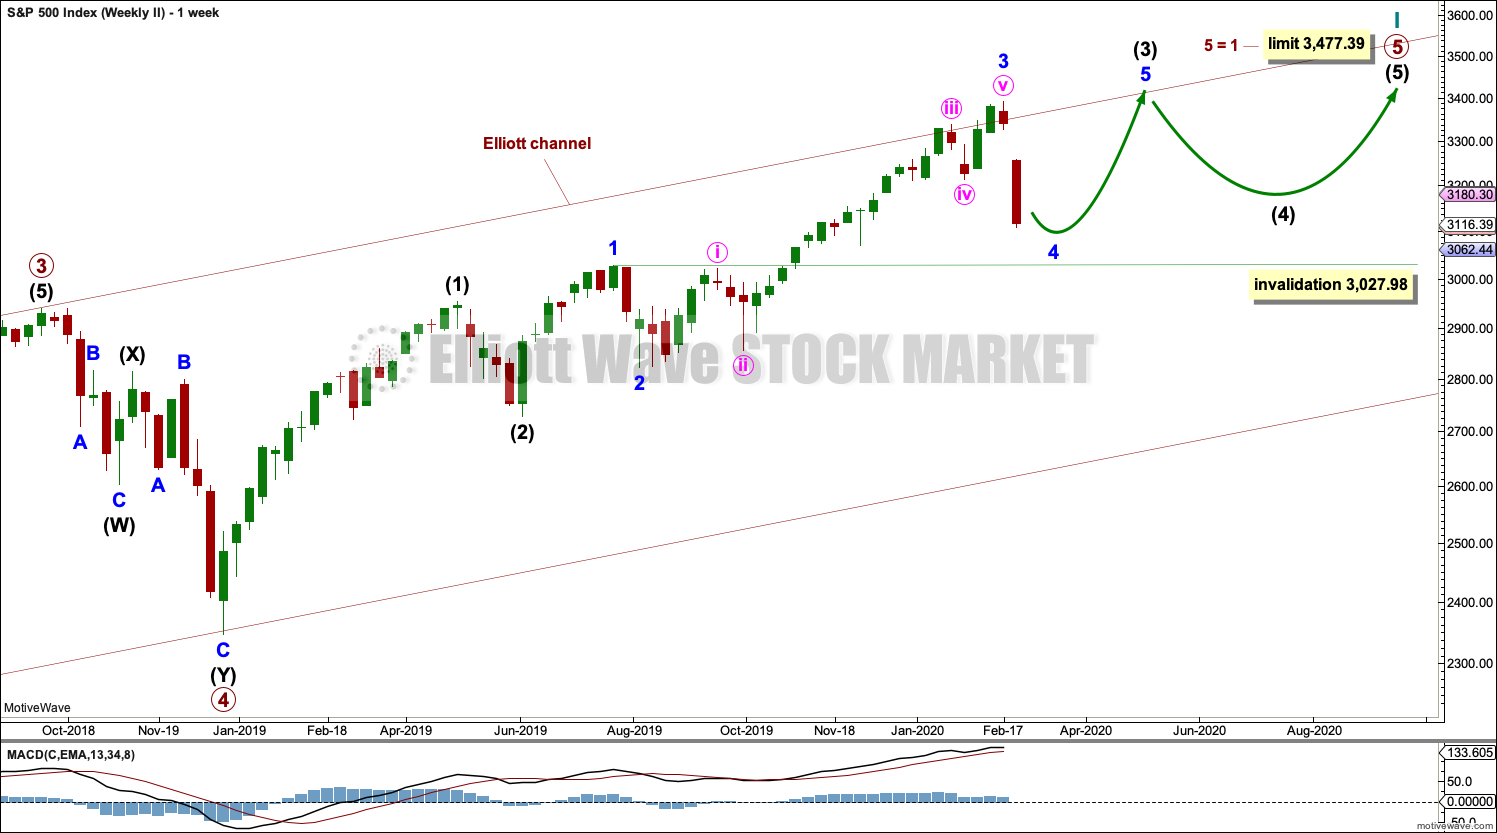
Cycle wave V may subdivide either as an impulse or an ending diagonal. Impulses are much more common, and it is clear at this stage that cycle wave V is an impulse and not a diagonal.
At this stage, cycle wave V may end within this year or possibly into next year.
A channel is drawn about the impulse of Super Cycle wave (V) using Elliott’s first technique. Draw this channel first from the high of 2,079.46 on the 5th of December 2014 to the high of 2,940.91 on the 21st of September 2018, then place a parallel copy on the low at 1,810.10 on the 11th of February 2016. Cycle wave IV found support about the lower edge.
Within Super Cycle wave (V), cycle wave III may not be the shortest actionary wave. Because cycle wave III is shorter than cycle wave I, this limits cycle wave V to no longer than equality in length with cycle wave III at 3,477.39. A new high by any amount at any time frame above this point would invalidate this main wave count in favour of one of the two alternate wave counts in the monthly chart analysis which are much more bullish.
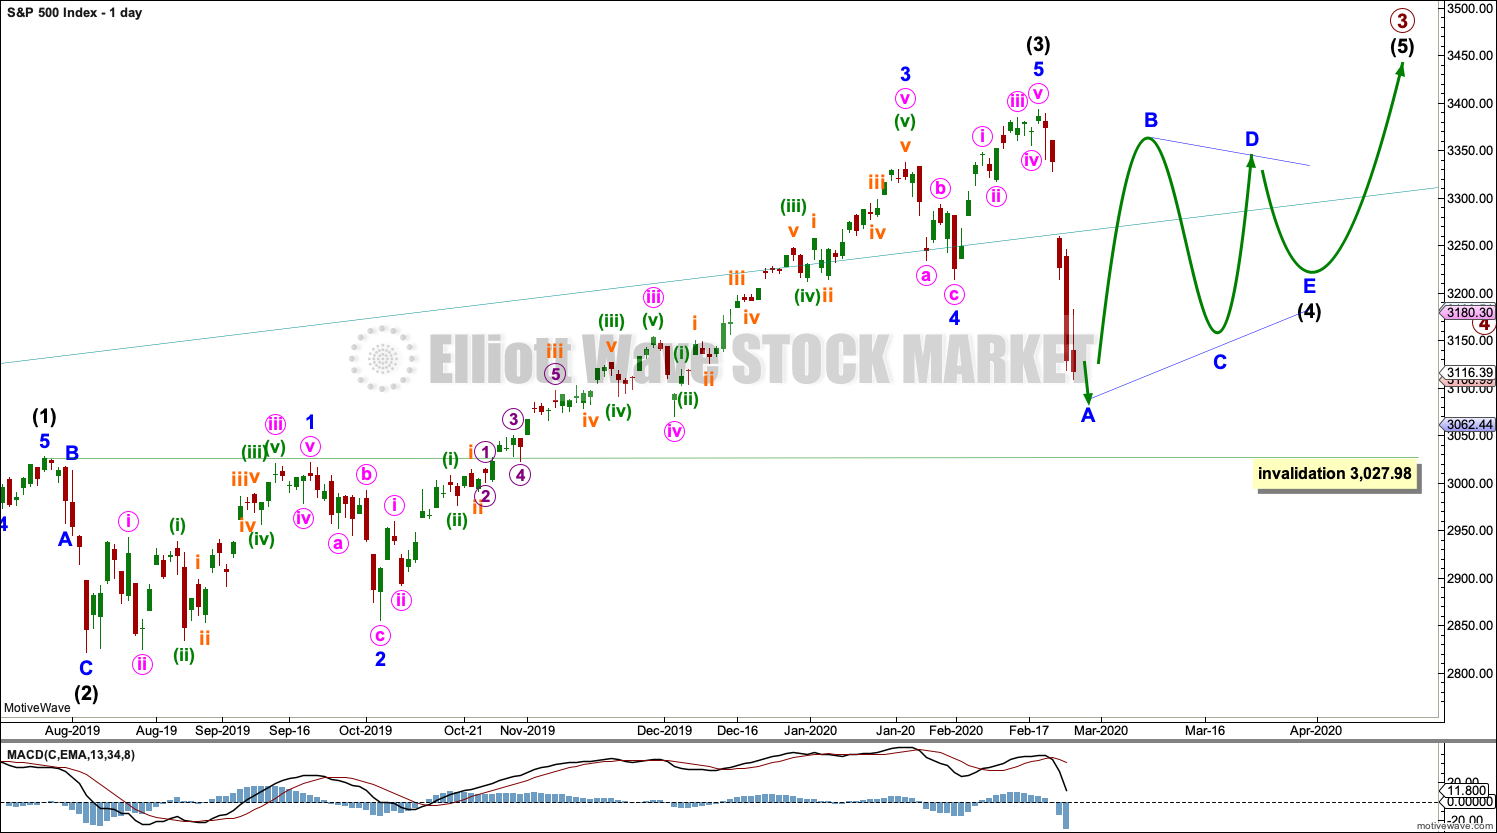
The daily chart below will focus on movement from the end of intermediate wave (1).
Within cycle wave V, primary waves 1 and 2 may be complete. Within primary wave 3, intermediate waves (1) through to (3) may be complete. Intermediate wave (4) may not move into intermediate wave (1) price territory below 3,027.98.
Within cycle wave V, the corrections of primary wave 2, intermediate wave (2) and minor wave 2 all show up clearly on the weekly chart. For cycle wave V to have the right look, the corresponding corrections of minor wave 4, intermediate wave (4) and primary wave 4 should also show up on the weekly chart. Minor wave 4 now shows up on the weekly chart, and so now two more large multi-week corrections are needed as cycle wave V continues higher, and for this wave count the whole structure must complete at or before 3,477.39.
DAILY CHART
Click chart to enlarge.
Minor waves 2 and 4 for this wave count both subdivide as zigzags; there is no alternation in structure. Minor wave 2 is deep at 0.83 the length of minor wave 1, and minor wave 4 is shallow at 0.26 the length of minor wave 3; there is alternation in depth. Minor wave 2 lasted 10 sessions and minor wave 4 lasted 7 sessions; the proportion is acceptable and gives the wave count the right look.
There is no adequate Fibonacci ratio between minor waves 1 and 3. Minor wave 5 is 5.21 points short of 0.382 the length of minor wave 3.
Intermediate wave (2) subdivides as a zigzag that lasted 6 sessions and was deep at 0.69 of intermediate wave (1). Intermediate wave (4) may subdivide as any corrective structure, most likely one of either a flat, combination or triangle. It may also unfold as a zigzag.
Intermediate wave (4) should show up on the weekly chart, so it should last at least one week and possibly as long as three or four weeks if it is a more time consuming structure such as a triangle or combination.
A channel drawn using Elliott’s first technique has not shown where intermediate wave (4) is finding support, so it is removed. When intermediate wave (4) may be complete, then the channel may be redrawn using Elliott’s second technique.
There are two broad groups of Elliott wave corrective structures: sharp pullbacks and bounces are the zigzag family, and sideways consolidations are all of flats, combinations and triangles. Two hourly charts will now be provided for each of these groups.
HOURLY CHART
Click chart to enlarge.
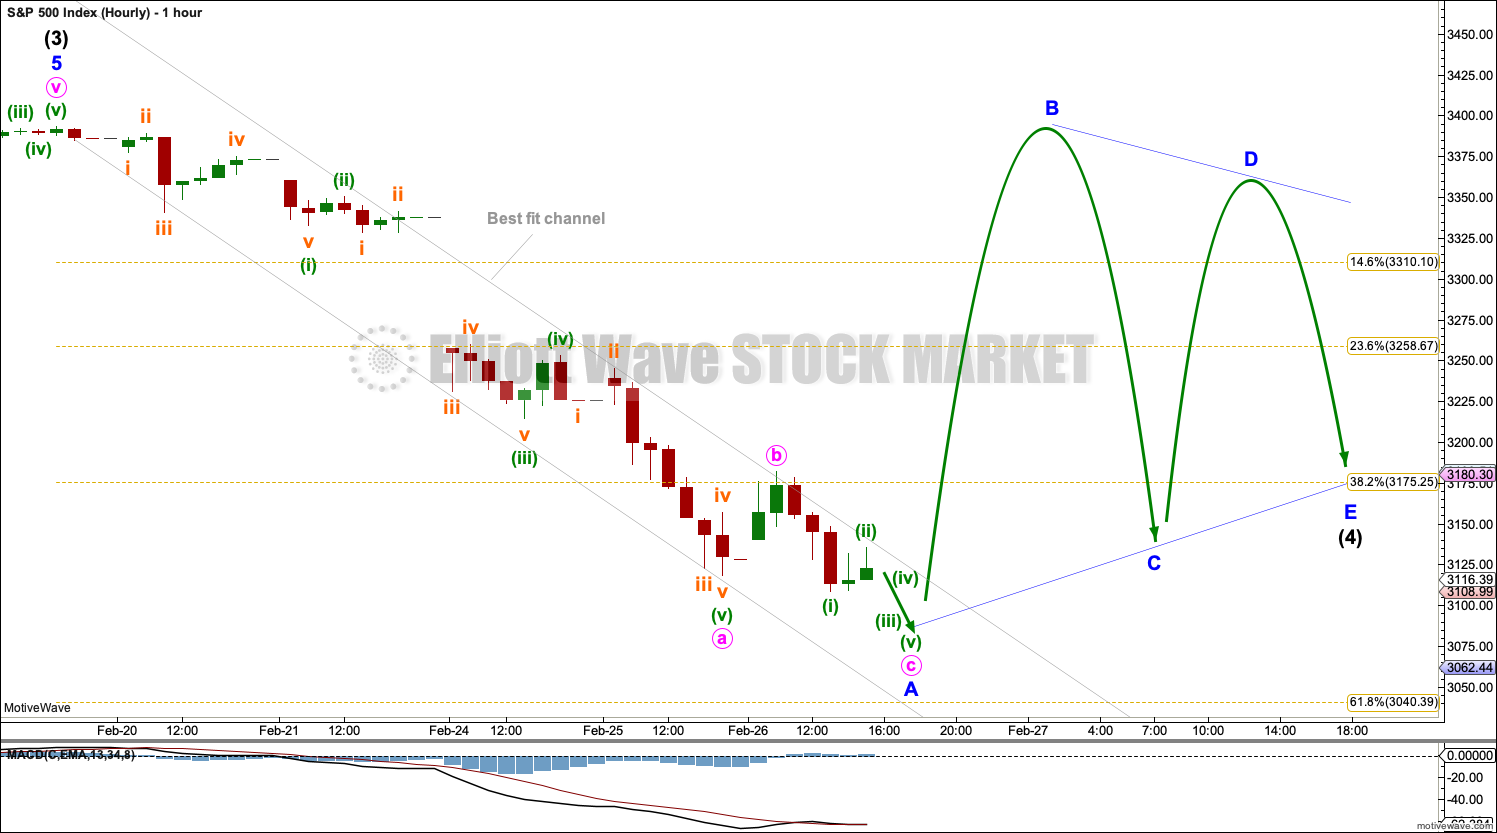
This first hourly chart covers the sideways group of Elliott wave corrective structures: flats, combinations and triangles.
Within all of flats, combinations and triangles, the first wave must subdivide as a three wave structure, most likely a zigzag. That may now be almost complete and is labelled minor wave A (it may also be labelled minor wave W).
If intermediate wave (4) subdivides as a triangle (as labelled today), then the first wave within the triangle may be an almost complete zigzag labelled minor wave A. Minor wave B should then move higher and may make a new price extreme beyond the start of minor wave A at 3,393.52 as in a running triangle. Minor wave B would most likely subdivide as a zigzag.
If intermediate wave (4) subdivides as a flat correction, then minor wave A may be almost complete. Minor wave B must retrace a minimum 0.9 length of minor wave A. Minor wave B may make a new price extreme beyond the start of minor wave A at 3,393.52 as in an expanded flat. There is no upper invalidation point for this wave count for this reason.
If intermediate wave (4) subdivides as a combination, then the first structure may be almost complete and may be a zigzag labelled minor wave W. The double should then be joined by a three in the opposite direction labelled minor wave X, which would most likely subdivide as a zigzag. There is no minimum requirement for the length of minor wave X and it may make a new price extreme beyond the start of minor wave W at 3,393.52.
Draw a best fit channel as shown about this downwards movement. Assume price may continue to fall while price remains within the channel. If the channel is breached by a full hourly candlestick above and not touching the upper edge (preferably by upwards movement and not a small range sideways candlestick), then that may be taken as an indication that minor wave A (or W) may be complete and minor wave B (or X) may have begun.
ALTERNATE HOURLY CHART
Click chart to enlarge.
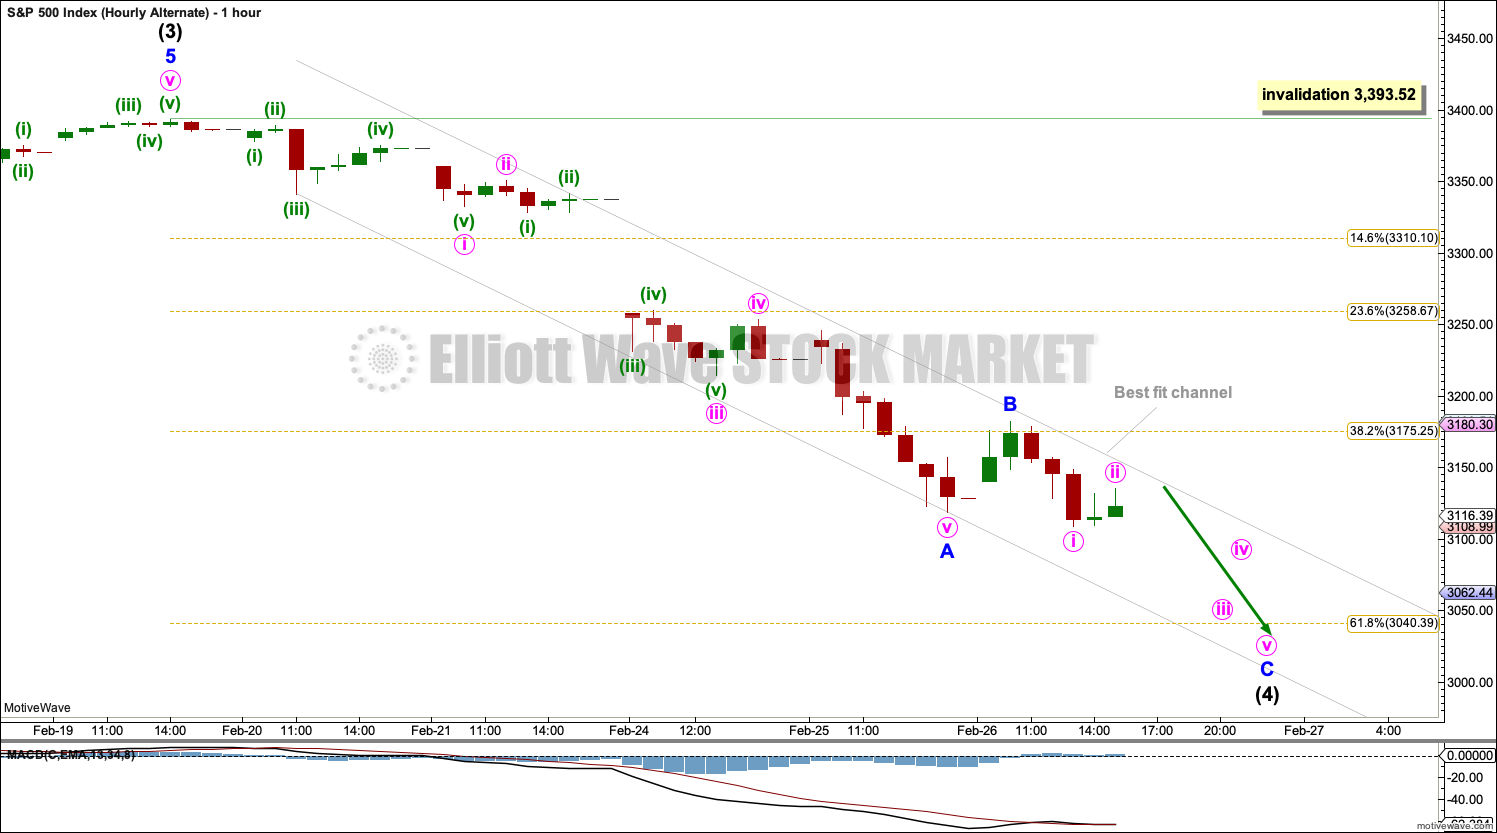
This alternate hourly wave count covers the other group of Elliott wave corrective structures, the zigzag family. This includes single, double and triple zigzags. The most common are single zigzags by a very wide margin.
If intermediate wave (4) unfolds as a zigzag, then it would exhibit no alternation in structure to the zigzag of intermediate wave (2). Alternation is a guideline, not a rule, and it is not always seen. When there is no alternation in structure between a second and fourth wave, they are most commonly both zigzags.
If intermediate wave (4) unfolds as a zigzag, then minor wave A within it may be an almost complete five wave impulse. When minor wave A may be complete, then minor wave B may unfold over one to a few days and may not make a new price extreme above the start of minor wave A at 3,393.52.
SECOND WAVE COUNT
WEEKLY CHART
Click chart to enlarge.
This second wave count sees all subdivisions from the end of the March 2009 low in almost the same way, with the sole difference being the degree of labelling.
If the degree of labelling for the entirety of this bull market is all moved down one degree, then only a first wave at cycle degree may be nearing an end.
When cycle wave I is complete, then cycle wave II should meet the technical definition of a bear market as it should retrace more than 20% of cycle wave I, but it may end about either the 0.382 or 0.618 Fibonacci Ratios of cycle wave I. Cycle wave II may end close to the low of primary wave II within cycle wave I, which is at 1,810.10. It is also possible that cycle wave II could be fairly shallow and only barely meet the definition of a bear market.
The impulse is still viewed as nearing an end; a fifth wave is still seen as needing to complete higher. This wave count labels it primary wave 5. Primary wave 5 may still need another year to two or so to complete, depending upon how time consuming the corrections within it may be.
Primary wave 5 may be subdividing as an impulse, in the same way that cycle wave V is seen for the first weekly chart.
TECHNICAL ANALYSIS
WEEKLY CHART
Click chart to enlarge. Chart courtesy of StockCharts.com.
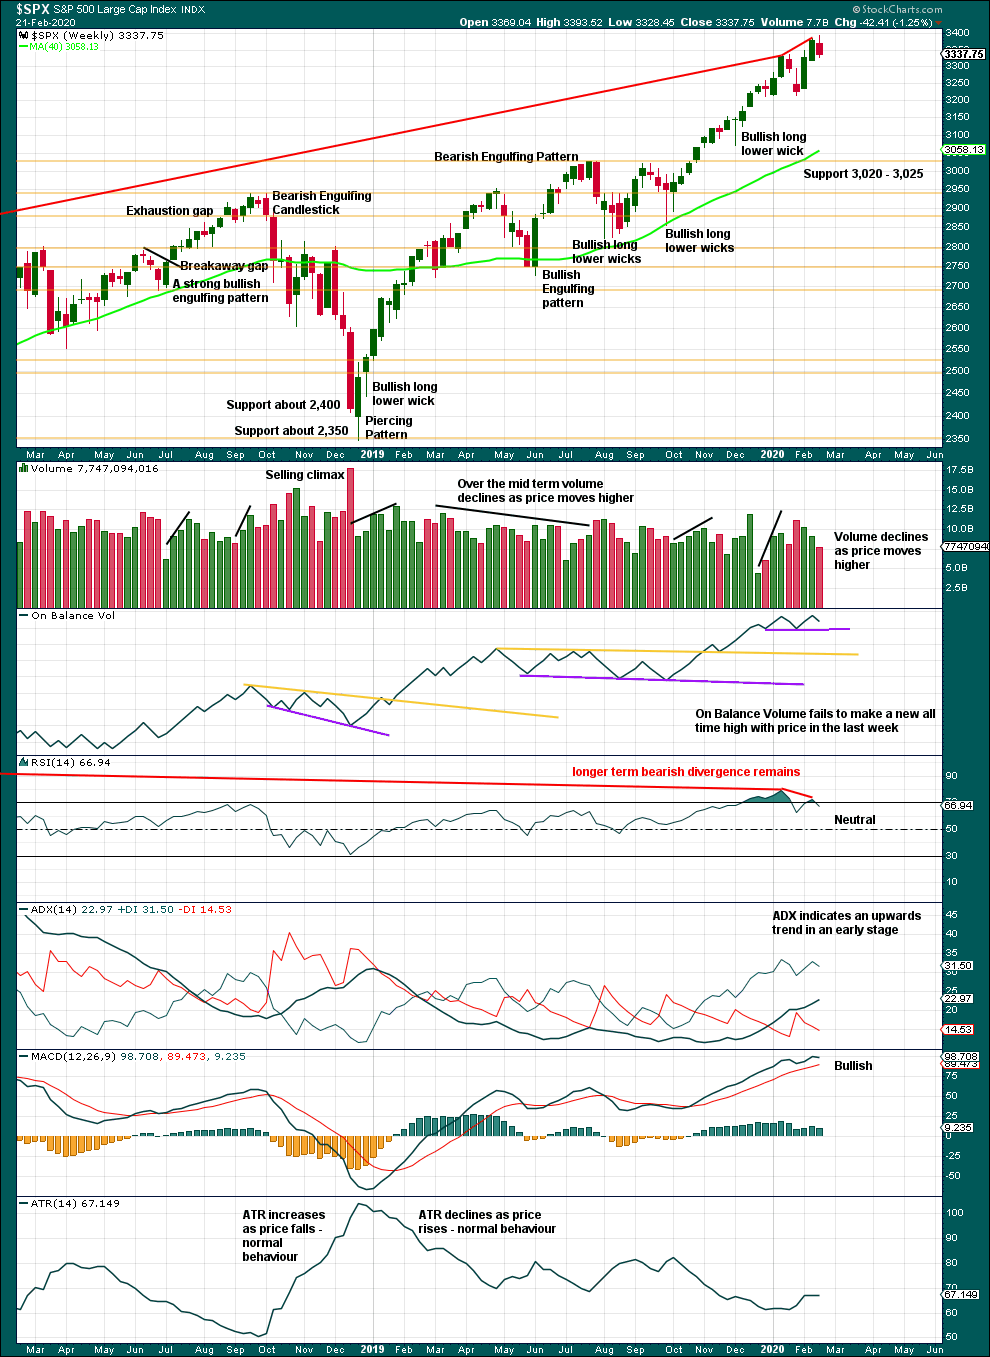
It is very clear that the S&P is in an upwards trend and the bull market is continuing. Price does not move in straight lines; there will be pullbacks and consolidations along the way.
This chart is overall bullish. There are no signs of weakness in upwards movement.
This bull market beginning in March 2009 has been characterised now for many years by rising price on declining volume. Despite all technical textbooks stating this is unsustainable, it has now been sustained for over a decade. This is concerning for an eventual bearish move as it may mean that support below is thin and weak, but for now the bull market continues. A decline in volume in current market conditions shall not be read necessarily as bearish.
Further pullbacks or consolidations will unfold. Do not expect price to move in a straight line. Pullbacks to support in a bull market may be used as opportunities to join an established trend.
Continued bearish divergence for the short term between price and RSI suggests the risk of a pullback remains high.
Last week sees upwards movement, but this is not confirmed by On Balance Volume.
DAILY CHART
Click chart to enlarge. Chart courtesy of StockCharts.com.
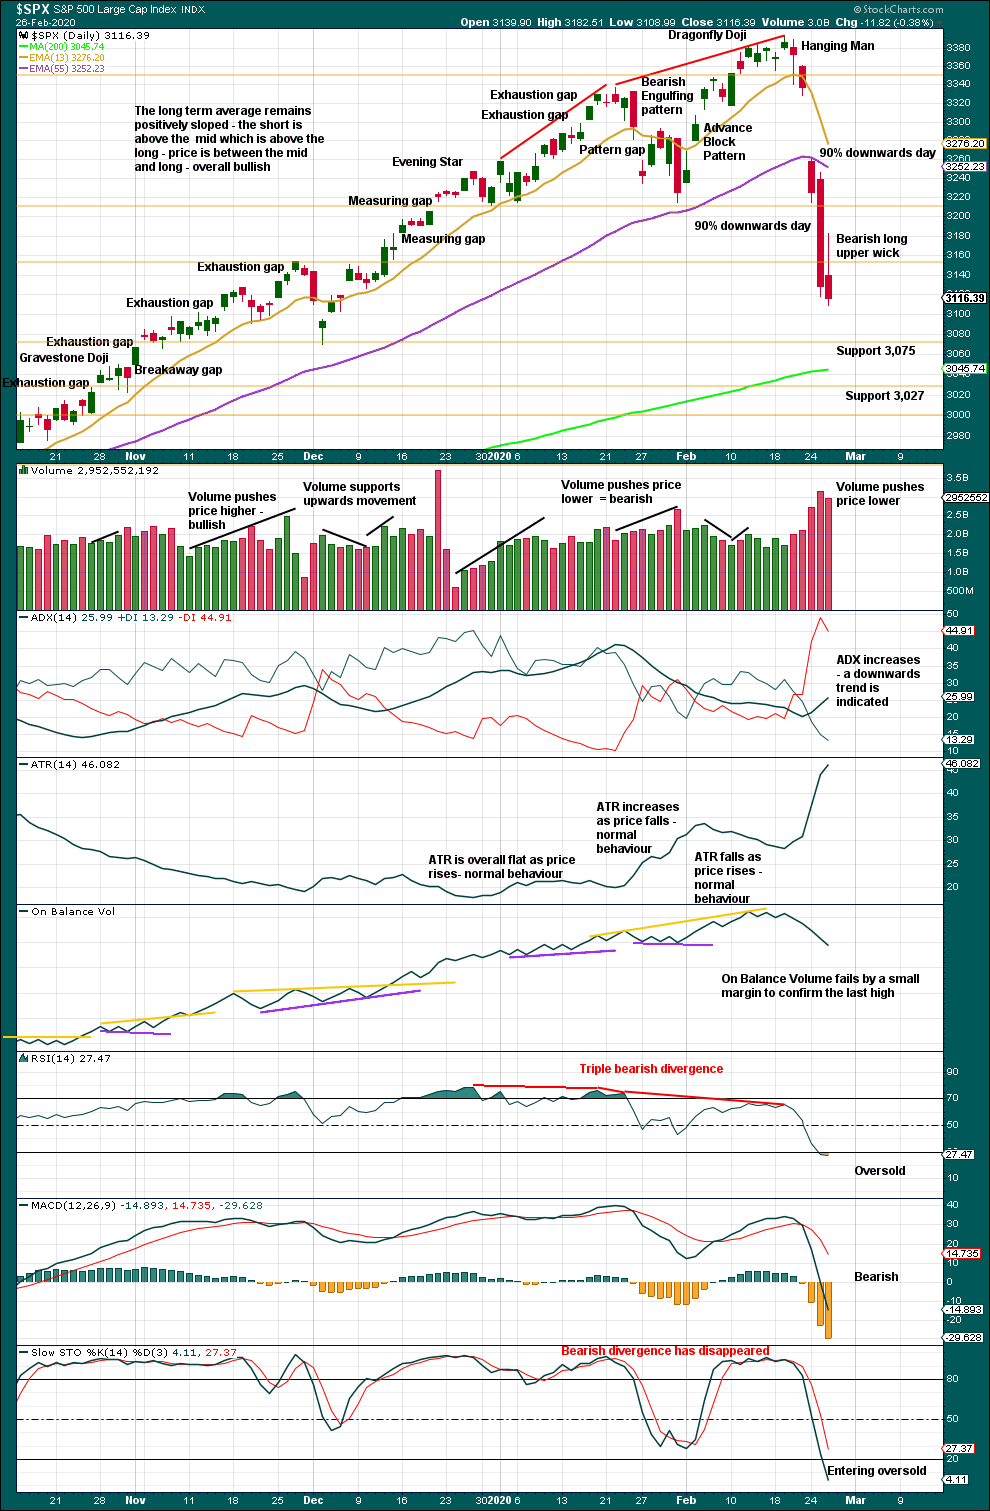
The larger trend, particularly at the monthly time frame, remains up. Expect pullbacks and consolidations to be more short term in nature although they can last a few weeks.
The two sessions of the 24th and 25th of February both meet the requirements for 90% downwards days within Lowry’s Operating Companies Only issues.
Following a 90% downwards day, either a 90% upwards day or two back to back 80% upwards days within 3 sessions would be required to indicate a 180°reversal in sentiment and indicate a sustainable low may be in place.
With RSI remaining oversold today, it would be reasonable to expect a bounce here or very soon.
BREADTH – AD LINE
WEEKLY CHART
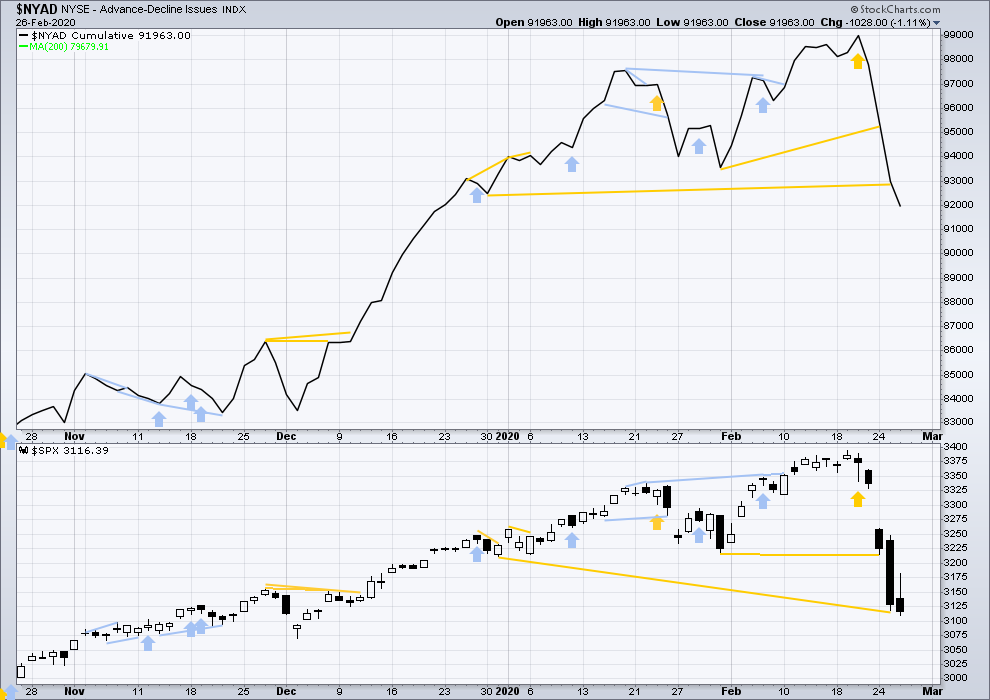
Click chart to enlarge. Chart courtesy of StockCharts.com. So that colour blind members are included, bearish signals
will be noted with blue and bullish signals with yellow.
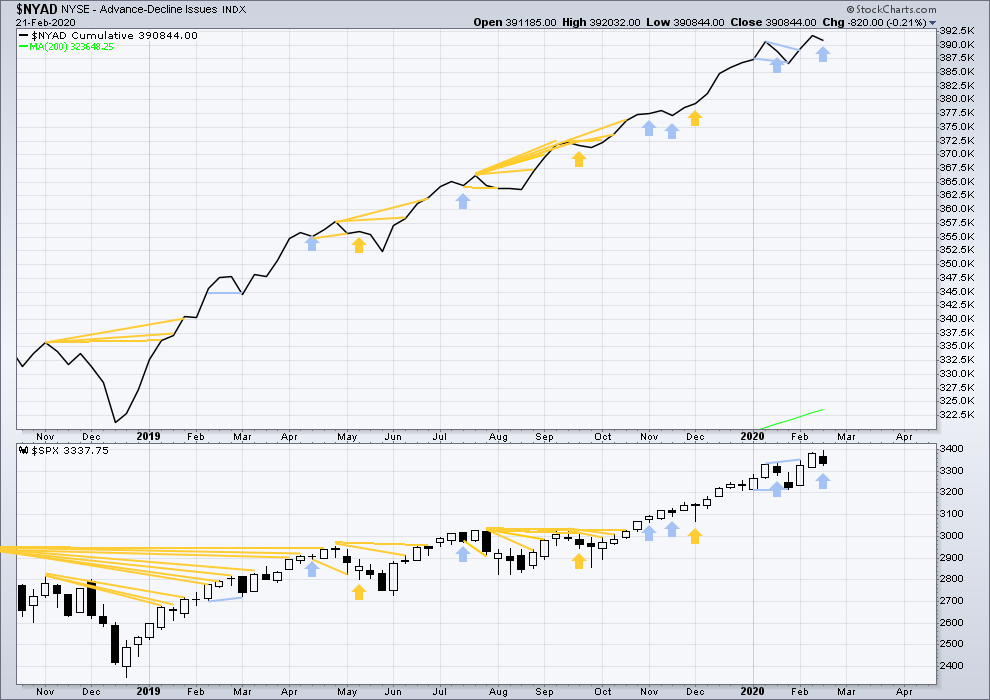
Bear markets from the Great Depression and onwards have been preceded by an average minimum of 4 months divergence between price and the AD line with only two exceptions in 1946 and 1976. With the AD line making new all time highs last week, the end of this bull market and the start of a new bear market is very likely a minimum of 4 months away, which is mid June 2020.
In all bear markets in the last 90 years there is some positive correlation (0.6022) between the length of bearish divergence and the depth of the following bear market. No to little divergence is correlated with more shallow bear markets. Longer divergence is correlated with deeper bear markets.
If a bear market does develop here, it comes after no bearish divergence. It would therefore more likely be shallow.
Last week price has moved higher, but the AD line has moved lower. This single week instance of bearish divergence supports the main Elliott wave count.
Large caps all time high: 3,393.52 on 19th February 2020.
Mid caps all time high: 2,109.43 on 20th February 2020.
Small caps all time high: 1,100.58 on 27th August 2018.
DAILY CHART
Click chart to enlarge. Chart courtesy of StockCharts.com. So that colour blind members are included, bearish signals
will be noted with blue and bullish signals with yellow.
Breadth should be read as a leading indicator.
Bullish divergence noted in last analysis has not been followed by any upwards movement, so it is considered to have failed.
Today both price and the AD line have declined. There is no new divergence.
VOLATILITY – INVERTED VIX CHART
WEEKLY CHART
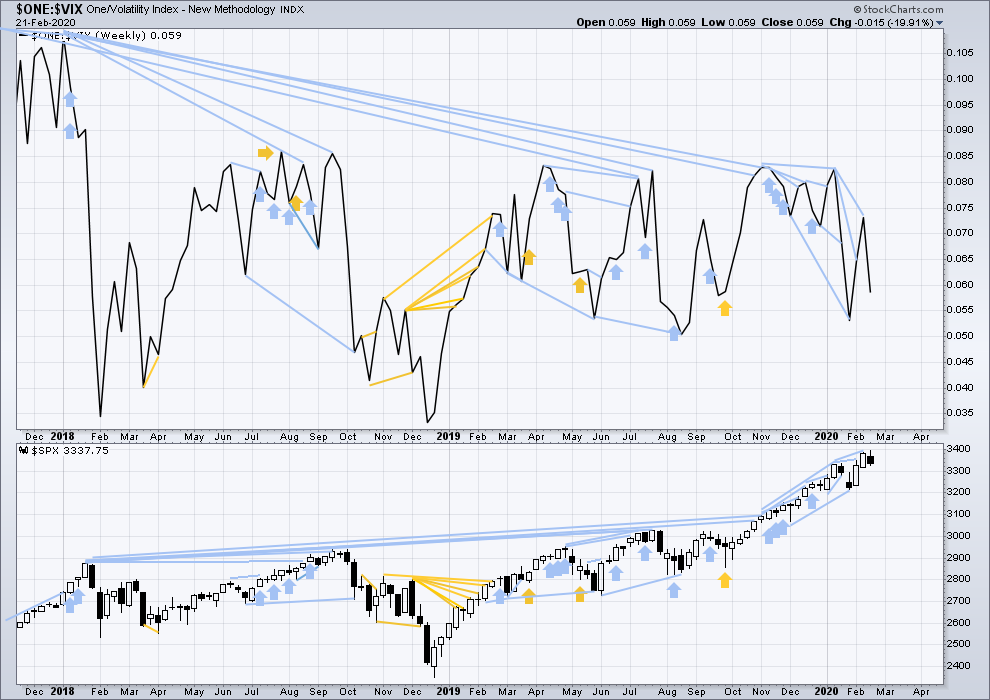
Click chart to enlarge. Chart courtesy of StockCharts.com. So that colour blind members are included, bearish signals
will be noted with blue and bullish signals with yellow.
The all time high for inverted VIX was on 30th October 2017. There is now over two years of bearish divergence between price and inverted VIX.
The rise in price is not coming with a normal corresponding decline in VIX; VIX remains elevated. This long-term divergence is bearish and may yet develop further as the bull market matures.
This divergence may be an early warning, a part of the process of a top developing that may take years. It is clearly not useful in timing a trend change from bull to a fully fledged bear market.
Last week both price and inverted VIX have moved lower. There is no new short-term divergence.
DAILY CHART
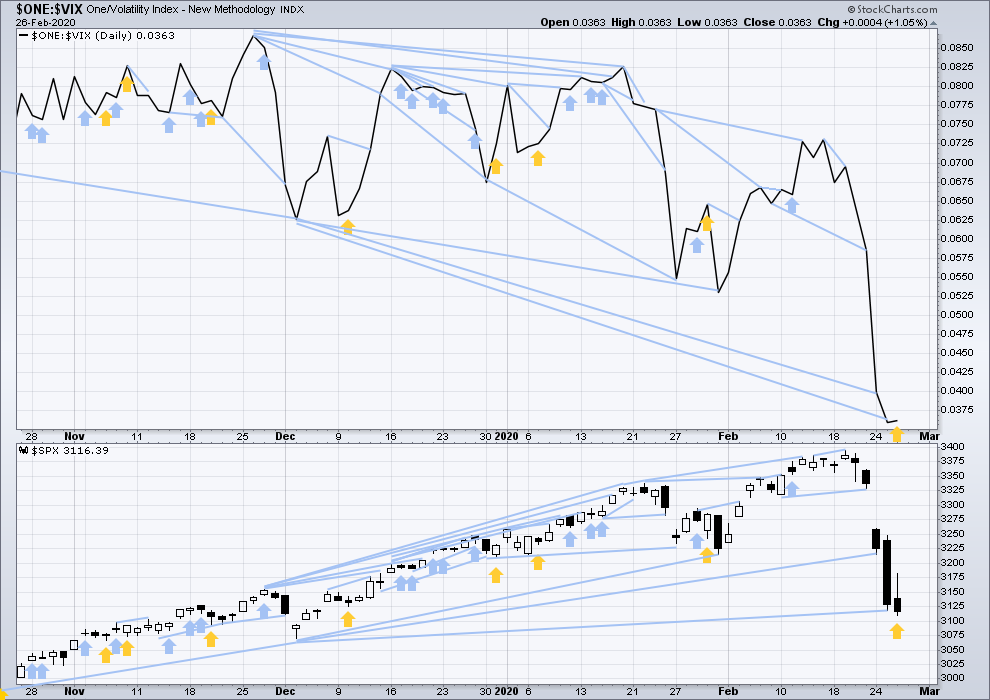
Click chart to enlarge. Chart courtesy of StockCharts.com. So that colour blind members are included, bearish signals
will be noted with blue and bullish signals with yellow.
Today price has moved lower, but inverted VIX has slightly increased. This divergence is bullish and may offer a little support to the view that a bounce may occur sooner rather than later now.
DOW THEORY
Dow Theory confirmed a bear market in December 2018. This does not necessarily mean a bear market at Grand Super Cycle degree though; Dow Theory makes no comment on Elliott wave counts. On the 25th of August 2015 Dow Theory also confirmed a bear market. The Elliott wave count sees that as part of cycle wave II. After Dow Theory confirmation of a bear market in August 2015, price went on to make new all time highs and the bull market continued.
DJIA: 23,344.52 – a close on the 19th of December at 23,284.97 confirms a bear market.
DJT: 9,806.79 – price has closed below this point on the 13th of December.
S&P500: 2,532.69 – a close on the 19th of December at 2,506.96 provides support to a bear market conclusion.
Nasdaq: 6,630.67 – a close on the 19th of December at 6,618.86 provides support to a bear market conclusion.
With all the indices having moved higher following a Dow Theory bear market confirmation, Dow Theory would confirm a bull market if the following highs are made:
DJIA: 26,951.81 – a close above this point has been made on the 3rd of July 2019.
DJT: 11,623.58 – to date DJT has failed to confirm an ongoing bull market.
S&P500: 2,940.91 – a close above this point was made on the 29th of April 2019.
Nasdaq: 8,133.30 – a close above this point was made on the 26th of April 2019.
Published @ 08:09 p.m. EST.
—
Careful risk management protects your trading account(s).
Follow my two Golden Rules:
1. Always trade with stops.
2. Risk only 1-5% of equity on any one trade.
—
New updates to this analysis are in bold.
Verne- your expectations on close came true now the ramp to the moon is what is remaining…
2940, man Verne you know how to make money!
Wow. What a move. And a close near lows suggests this is not done.
The ending diagonal is now the main count. Working on next analysis now from Houston.
Hope you had an enjoyable flight Lara!
I think you are right about not being done.
Looks like we need a four and five down with corresponding lower high in VIX to confirm the fifth down.
I did have quite a nice flight and managed a fair few hours sleep. I do quite like Air New Zealand, they’re pretty friendly.
I hope you wore a mask !
2954 invalid point ? top of 1
After hour futures already at 2,950
Verne…. Lara’s post earlier re expanding diagonal(not an ending diagonal as per your wave 5 comment)….
“The diagonal would be expanding; 3 is longer than 1, 4 is already longer than 2, so 5 needs to be longer than 3.”
Right…Pete. Lara does mention ‘expanding ‘ diagonal. Though her alt: chart shows P5c poss. stopping at acceleration channel, she is suggesting entire move for V would have a ‘megaphone type look if expanding, so P5c would measure at least slightly longer.
Avi G. has put out a Free Feb 24 update showing an Alt: for an ED. Eventual level for a Low, 2855ish
I stand corrected Peter H! 🙂
Ha ha no worries Verne!
Avi G. just put out a chart showing ED as an alt. Looks like we are in it. His charts are too large to upload. See @:
https://www.elliottwavetrader.net/marketupdate/Finally-A-Pullback-202002245767321.html
Lara shows a P5c climbing only to the acceleration channel and not as high as P3c which would account for a short ‘5’ than ‘3’.
Okay, the top of the primary 1 is breached as well…
Which means the “simple” count has the cycle V complete at the recent highs, which completes EVERYTHING of a Grand Super Cycle wave 1.
Not that simple is “right”.
Let’s see, the last major flu epidemic to hit the US killed about 60,000 people, just two years ago. This flu has killed what, a few in the US? And the market has sold off -12% now?
Something’s just not adding up for me. And I don’t buy that “the market is always right”, it was far from right in the Dec 2018 sell off for example.
Oh my! That is HUGE, Kevin…!
Good point.
The bromide about the market always being right fails to account for the kind of CB distortion that now afflicts true price discovery. Frankly, there was something profoundly ‘un-natural” about the kind of market-run-up we saw this past year.
We are seeing the mother of all reversion trades. As it turns out, this time was “not different”!
If the count of an expanding diagonal is the one, then the top of Primary 1 being breached is compulsory.
On a monthly chart we are now back to the break-out shelf…interesting!
If the count is the ED, Primary 5 up has to start below 2905.99 in order to be longer than Primary 3 but still remain below 3477.39.
For an ED wave 5 has to be SHORTER than wave three or the ED is invalidated…
Just Incredible!
Still very bullish as long as 2850 holds but DJI is very close to Oct lows, so it may very well be ending diagonal… Open to all scenarios… be safe guys.
You mean not below 2855.94 swing low in Oct’19 to be precise?
Open VIX gap just above so looks lke we are going to fill it. WOW!
Here is hoping I don’t get violently stopped out overnight…YIKES!
Also, people tend to forget that there were millions of gaps left by the market on a way up. It is finally filling up – took quite a long time, but it is finally covering all those gaps. It’s like a domino effect.
Sure didn’t see this close coming after a 90 point reversal earlier…
This is market twilight zone to me… good luck everyone!
Btw, good to see Verne and Doc posting again 🙂 Where’s Olga??!
Good to see you Ari!
Lara said she was subscribed to her weekly analysis.
I sure miss her!
I need to talk to Lara about getting her an honarary membership.
I would offer to cover it but Olga would probably smack me if I did…. 🙂
howdy Verne,, from what I am hearing you took some time off too? all this volatility sucked me back in.
Hiya Doc!
I did.
My old mentor Bryan Bottarelli started a new trading group and I went along for the ride.
I don’t think its a cost issue for Olga, I think its a time issue. Which we can’t solve.
Higher high in VIX!
We are in the middle of a third down….
Some traders are going to chase this end-of-day move. A very bad idea imho.
If we do have more downside there will be many opportunities to short the market.
It’s a long, lomg way to Tipparary…
What happens tomorrow is going to be pivotal.
Remember it is going to be the last trading day of the month and we are going to need one helluva rally to negate that gigantic monthly shooting star.
These longer time signals tend to be more reliable as regards furure price action imho…
also remember that the first 2 trading days of a month have a strong upward bias…Mon/Tues.
For now it does look like we are going to breach 3000 below.
A new low could still be an expanded flat…especially if VIX prints a lower high…
We do have a lot of over-lapping waves….
The real question is what is the current count. I’m now completely confused as to where we are in a big picture of things. Any ideas?
There are two possibilites.
Either we have a historic market top…OR, we are in an intermediate or primary degree corrective move….
Lara’s ED count as posted below is now the count because the top of (1) was breached.
Unlikely to be “The Top”due to the lack of AD divergence as per Lowrys.
Exactly.
And if it is, then the following bear market would very likely be relatively brief and shallow.
Looking like a corrective flat with a C up to come followed, by more plungerooni…
This is starting to look ominous people…!
Here is what I think they are going to do.
They are going to breach 3000.00 intra-day and then ramp futures to the moon…you just watch…!
Very possible. So far it’s been bouncing between 76% levels for the day on both bull and bear sides.
that’s what the alternate says
I am thinking over the weekend a massive ramp in futures as tomorrow might be another shake the tree day in store..Check the options volume of high beta stocks…too many calls for tomorrow…not going to happen as much as market is oversold in short term JMHO
Oh yeah!
Smart money on a monster buying spree for April calls….
I picked up a few calls for tomorrow as well and I suspect I am going to turn ’em in bear spreads…
Gold down in this market…here comes the breach of 3,000 and another ton of stop loss going to kicking….
Toronto Stock Exchange closed due tom technical issues…
“Technical” huh?He! he!
Careful folk; looks like an A,BC upward correction. Tight stops on longs are in order…
If the next wave down breaks 3000.00 it could be a big five down….
Note that we may have a bottom in oil (/CL) and a top in bonds (/ZB).
My bonds chart says this general area SHOULD be a top (but not that it WILL be a top!).
This was the second head fake when the price action “breached” the channel on top for the second time – it did it once yesterday too and went back down below it. I wouldn’t be so certain that we hit the bottom yet in this market. The down channel has not been breached yet.
I would not bet on it. The FED is going to ease; no doubt about, it and the long bond is going higher…!
FED mentioned that they were watching the coronavirus impact at the last update so now will be the time to act…maybe they will after the market close or open to calm the markets.
Yep! They are trapped.
They created this mess.
Now they are going to have to live with it.
*&%##$$ banksters!
OK, kinda late to the show but long at 3060…..
What are we thinking for the bounce, couple weeks to close the gap at 3337 and back down?
I think CV fears will keep the bounce on the smaller side myself. I expect backing/filling in the range below that gap.
I’m day trading my ass off today, reducing my losses from “too early” positional trades I had to bail on because ya just got to respect your stop levels. Working out okay…
same story here, but im up so far!
actually per the alternate we should see a new low vC(4)
I think it all depends on the 3000.00 line in the sand. If that goes…time to get out of Dodge…!
are you shorting off that or just waiting to go long?
I have contingent orders to short the market on any break of 3000.00
Futures, options on futures, and triply leveraged ETFs…..
I like the Ciovacco proposition: “a retest of the break out of the 20 month consolidation area”. So far, yup.
Yeah, hence I think it’s minor 2, and the ATH was the minor 1 & we have multiple 1-2 on the daily chart… an impulsive & explosive move up would confirm
Sorry I meant to say it MAY be minor 2, just an option. 🙂
It certainly has the look and feel of a 2, I’ve been thinking that for the last 48 hours.
So if it’;s minor 2, we will see huge minor 3 up and Lara’s count should be switched one degree down?
Yeah that means way bullish… but that to consider ciovacco’s analysis and considering the monthly breakout… it would most probably mean a major low… 🙂
This kind of carnage more likely a higer degree move, imho…
Agreed, definitely not a minor degree move. Intermediate at the very least.
Look for a sizeable wick on VIX by the close to confirm an (at least) interim low.
I am calling it an early day. Have fun everyone!
NICE BOUNCE in /ES off the 61.8% at 3012.
One interesting opportunity: MRK fell hard BEFORE this all started. Through it all, it’s has barely moved at all, forming a solid base. I’ve sold a put spread for next friday just under it 80/77 for $0.70 each.
Also quite long TQQQ UWM and UPRO now…
Ringing the register on a boat-load of short trades. Wow!
Opening massive buy -stop and other contingent orders to be triggered by any move below SPX 3000.00. I suspect we should see a sizeable relief rally at this juncture.
What a ride!!
So are we officially switching from the main count to alt as 3020 as invalidation was breached?
Or I guess does it have to close below 3027 for it to be invalidated? Otherwise, we are still in the main count?
oh no, the main is invalidated. Can’t have a 4 cross into the area of the 1 whatsoever.
But I’m looking now at Lara’s weekly alternate and it is shown to be invalidated at 3027 too. So we don’t have a correct count now?
The count is Lara’s Ending Diagonal posted below.
I am taking a half position here at 3017 via spy at 301.90. tagged trend line and very close to the 38% fib retracement off Dec lows. Putting a stop in at primary 1 high at 2955 ish. I think this is primary 4 unfolding until that level is breached.
Let see how much “juice” remains in the banksters’ tanks. If the bears breach 3006.96 by even one penny….GAME OVER!
If they gap below 3000.00, I am leaving…! 🙂
Why exactly 3006.96?
Look at today’s daily candle and you will see… 🙂
Another 30 billion in overnight repo was added as well this morning…expecting more through the day on repos. I believe all index in official correction territory of 10% drop…
They spent much more than that….a LOT more!!
It only paper and they can print a much as they like…at some point liquidity will take over.
Rishi you have put your finger on the ultimate question.
While I am not sure I agree with your conclusion, I think you have really nailed the core issue, which is:
“Can banksters bail out the global economy??!!!”
I have no idea….
If we are indeed approaching a 500 year cycle top, they are substantially over-matched…!
Verne – I am confused as at some point this will all cause a massive bubble burst but until that time, we have got to survive and avoid the hazards in the deep dark waters of financial markets.
Well my friend, the bubble is ALREADY massive, and I am not even talking about equities. Case in point? Japan’s 200% debt to GDP ratio…
The thesis of central bank influence in equities markets for some time now has been “control”. It was the notion of CB invincibility that promted some traders to push margin debt to all time highs despite the ridiculous evaluations we were seeing in equities due to multiple expansion (via share buy-backs) and relentless CB liquidity injections.
Nothing would more summarily destroy the preception of CB invincibility that would a break of the all-important SPX 3000.00 fire-wall. My prediction is that, if possible, that is where they will draw a line in the sand.
A break there, imho means they no longer have control….
If Lara’s ED count is the one then 3000 must be broken in order for the eventual Primary 5 to be longer than Primary 3 and still stay below 3477.39.
Primary 5 is limited to being shorter than primary 3 since primary 3 was shorter than primary 1…above 3477.39 that count is invalidated….
Verne – hope you are still holding TSLA shorts….
You betcha! We’re nowherer near the downside target… 🙂
Thae other day I said 3050 SPX would make an excellent entry for a long position. Any one taking the the bait? It looks like a falling / plunging knife.
SPX now testing both a 61.8% and the 200 day MA, around 3042.
Dare I say…”should turn it”???
make or break….tick tok..
Tic toc, hi ya doc. Glad to see you back.
and it breaks …now more selling likely into 3020s
Higher VIX print suggesting a third wave not yet done…!
Think about implications…
Megaphone.
I think this is a good depiction what will happen eventually during recession. But I don’t think we are there yet. If you draw that top line on top, it crosses monthly at around 3070-3080. That’s where we are now. If monthly closes above that number, it is not breached yet.
That’s EWI’s “expanding triangle” call from about a year ago.
Not high on the list of probable futures IMO.
I have not read anything from Prechter and company in years. They are sadly, according to Hulbert’s, one of the most untrustworthy sources of technical analysis when judged on the accuracy of their calls.
Keep in mind that the rules for EW theory and classic T.A. are not necessarily identical so blithely calling a megaphone pattern an EW triangle is not always accurate. The same is true for EDs vs rising wedges with the former having very specific rules to qualify as such. We recently had specatcular examples in virtually all the indices with a plethora of rising wedges that did not qualify as EW ending diagonals, though the patterns are similar. Hope that helps a bit.
Markets at a critical juncture today. I would point to two possible tells.
First is my VIX indicator that some long-term members ( hiya Rod) know quite well. A lower VIX high would suggest a fifth wave down.
The other interesting thing is a megaphone pattern charted by Sven Heinrich aka NorthmanTrader. I will post later with his permission.
Price blew past the top boundary of the pattern when the FED unleashed REPO-calypse. The top line sits at about 3148 and price did pause there initially. Sven thinks that boundary dilineates options on the markets immediate future.
I personally think the next line in the sand if VIX blows past 30.25 would be the 3000.00 round number. If that gives, we could see 2250.00.
2250 wow.
Verne – Appreciate the info and possible targets for the markets. Since your note mentioned FED Repo, I noted for past few days that the repo market action has been fairly quite. I would hazard a guess that Fed can not risk loosing control and would start the injection fairly shortly to bring back more liquidity. If the drop was due to liquify constraints, we would have seen a much violent reaction over the past few days. Let’s see what today brings to the market participants.
I guess I should have checked repo action as they just posted a repo deal for maturity in TWO weeks Mar. 12 over 25 billion (posted at 8:15 AM), more to come Fed will likely be active and smart money will likely be looking to leverage the liquidity.
“Somebody” has been frantically buying to preent the market going into free-fall. If you look closely you will see several failed attempts to hammer out a bottom. At this rate we are going to trigger circuit breakers for sure. A break of 3000 would suggest to me the middle of a third wave down and a 1.618 extension of wave one means a DJIA decline of 4K.
I am not saying this is going to happen, just that it is a possibility….
The next target below 3000 is 2950 as Kevin pointed out correctly.
Economy in good shape to handle coronavirus impacts:
theotrade.com/economy-in-solid-shape-to-handle-a-coronavirus-shock/
Claim backed up by a variety of recent economic report data.
Which economy…China? U.S? Global?
Think about what they are asserting…
Hi everybody. And Doc, nice to see you back!
I’m flying from New Zealand to Houston tonight. I land after 4pm CST and so will not be able to post an updated chart in these comments prior to market close of the next session.
If in the unlikely event the wave count is invalidated with a new low below 3,027.98 within the next 24 hours then here is an alternate possibility. The subdivisions fit, but it has a lower probability than the main count. This alternate sees cycle wave V as an ending diagonal.
The diagonal would be expanding; 3 is longer than 1, 4 is already longer than 2, so 5 needs to be longer than 3. For an ending diagonal all sub-waves must subdivide as zigzags and 4 must overlap 1.
Just in case, you’ll have a road map.
Kiwis can fly!
Great. Thanks Lara.
It could very well be the main count very soon.
I’ve never liked 4th waves tracing back more than 50% of 3rd waves as, more often than not, they end up not being 4th waves..
I’ve applied Lara’s alternate to ES 60 mins which other than a triangle can now IMO be the only other count as we are too close to overlapping (1) to be anything else.
Fibonacci levels of 0.618 (3) and C of (4) being 0.5 A end around the 3040 level, still above (1) but very close and still “legal”.
/ES potential pivot zones below. Daily bars with overnight.
That 3028 level is awfully significant; below that and there’s serious wave count rework needed, as the intermediate 1 high is busted, and this becomes a primary 4. Then the invalidation level becomes 2961. If THAT is busted…then I do believe that indicates that cycle wave 5 completed. Which completes the entire grand super cycle wave 1…right???
Or maybe there’s a different interpretation should that all come to pass here. One level at a time.
Where are the buyers??? Most everything is on a blue light special sale!!!
Futures below 3,090…
I used to always be first. I recognize a few names that are still posting
Well welcome back !
What’s up Doc!!! You’ve been missed. Long time… 🙂
Pratham