
Upwards movement to new all time highs continues exactly as the main Elliott wave count expects. The target remains the same.
Summary: The trend is up.
The target for the next interruption to the trend is at 3,415.
A new low now below 3,355.70 would indicate intermediate wave (4) may have arrived. A target for support would be about 3,252.
Two more large pullbacks or consolidations (fourth waves) during the next 1-2 years are expected: for intermediate (4) and then primary 4.
If price makes a new high by any amount at any time frame above 3,477.39 (even a fraction of a point on a tick chart), then this analysis switches to one of the very bullish alternate monthly charts. The next cycle degree target would then be either 4,092 or 4,213.
The biggest picture, Grand Super Cycle analysis, is here.
Last monthly charts analysis is here with video here.
ELLIOTT WAVE COUNTS
FIRST WAVE COUNT
WEEKLY CHART
Click chart to enlarge.
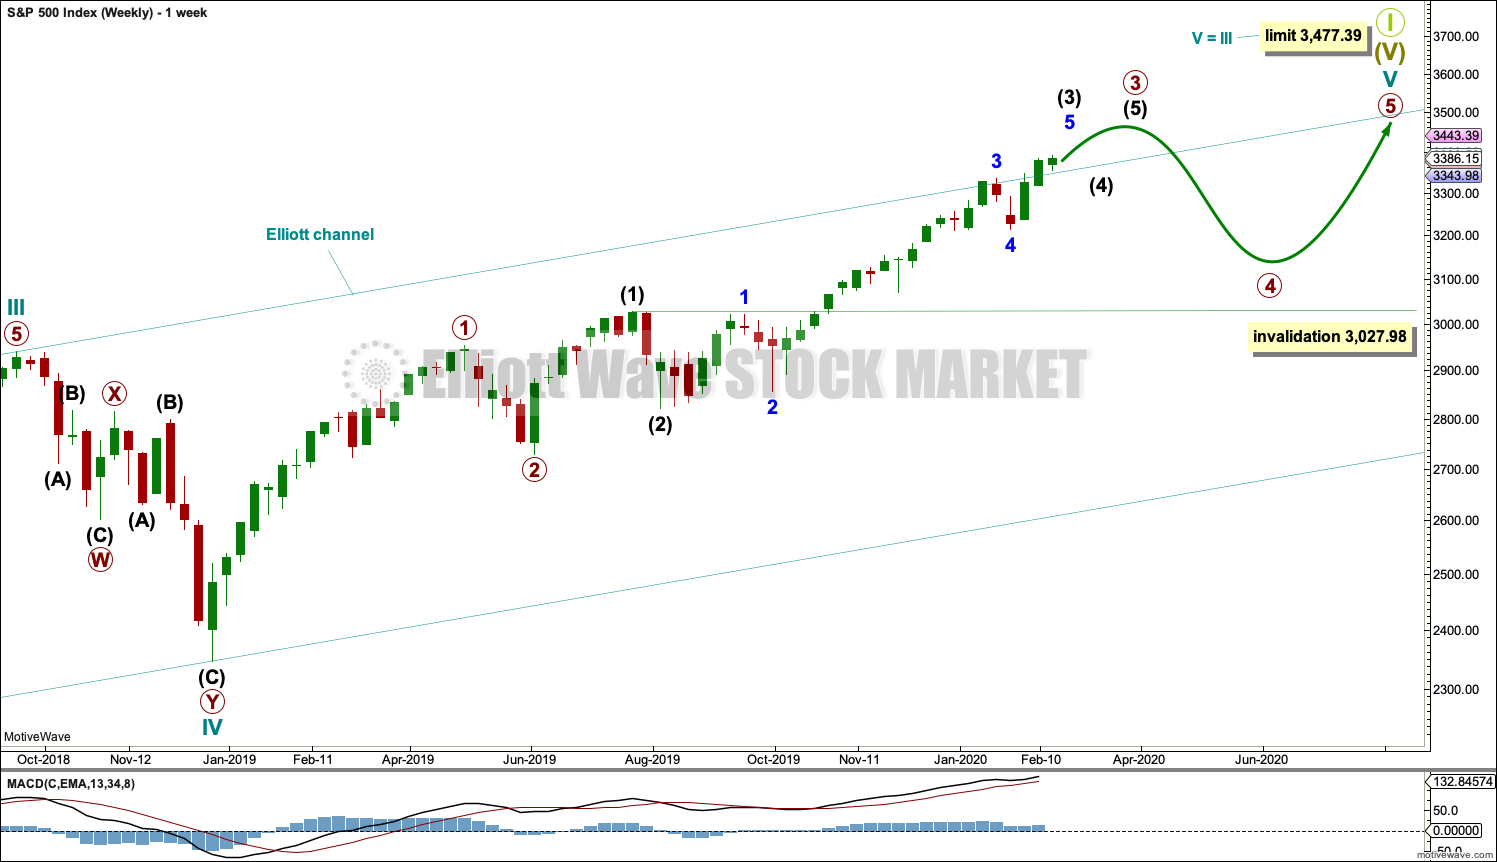
Cycle wave V may subdivide either as an impulse or an ending diagonal. Impulses are much more common, and it is clear at this stage that cycle wave V is an impulse and not a diagonal.
At this stage, cycle wave V may take another one to two or so years to complete.
A channel is drawn about the impulse of Super Cycle wave (V) using Elliott’s first technique. Draw this channel first from the high of 2,079.46 on the 5th of December 2014 to the high of 2,940.91 on the 21st of September 2018, then place a parallel copy on the low at 1,810.10 on the 11th of February 2016. Cycle wave IV found support about the lower edge.
Within Super Cycle wave (V), cycle wave III may not be the shortest actionary wave. Because cycle wave III is shorter than cycle wave I, this limits cycle wave V to no longer than equality in length with cycle wave III at 3,477.39. A new high by any amount at any time frame above this point would invalidate this main wave count in favour of one of the two alternate wave counts in the monthly chart analysis which are much more bullish.
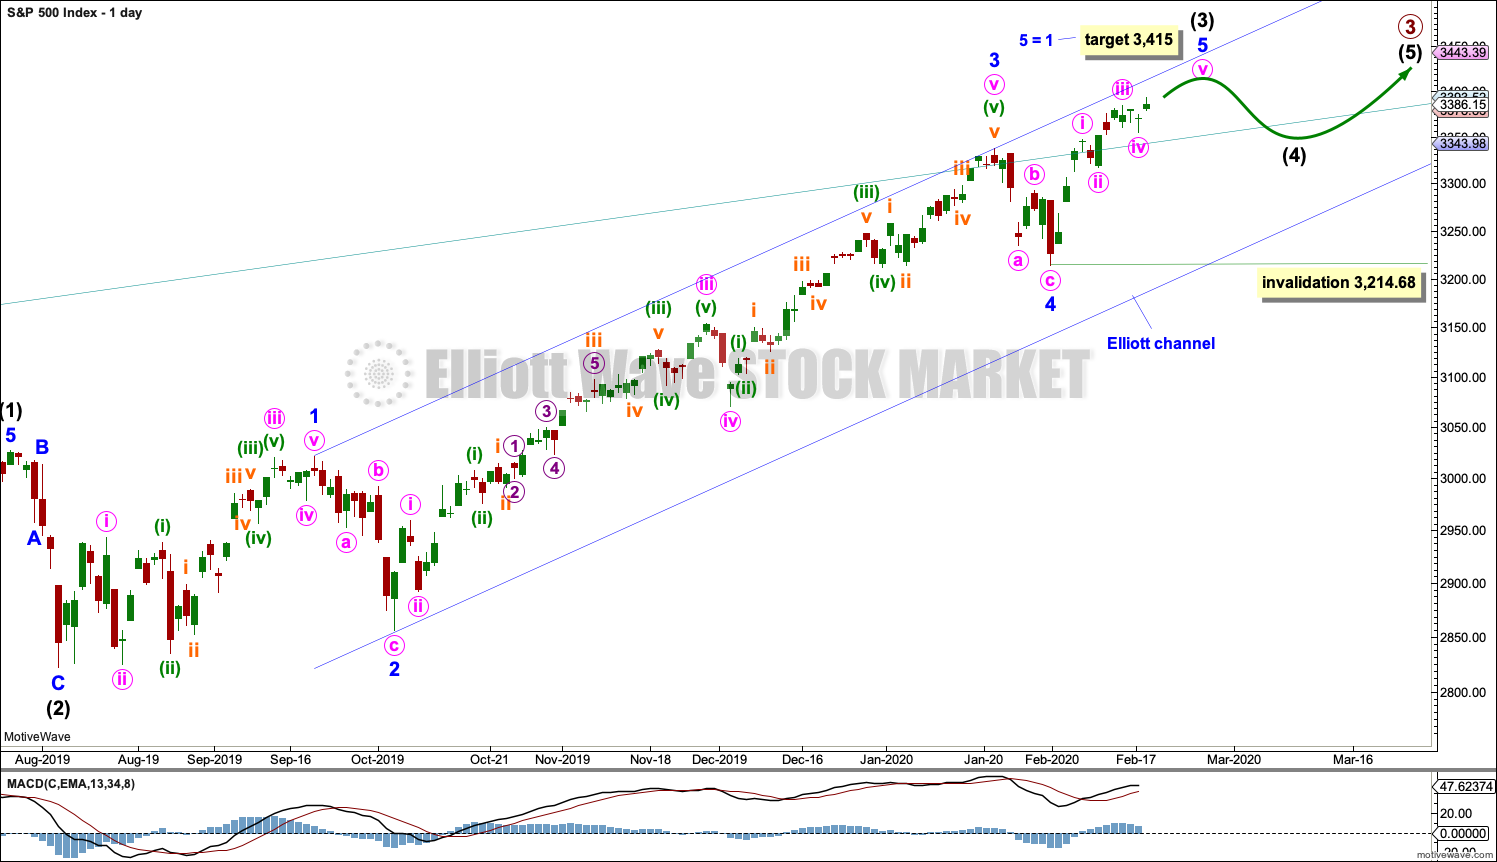
The daily chart below will focus on movement from the end of intermediate wave (1).
Within cycle wave V, primary waves 1 and 2 may be complete. Within primary wave 3, intermediate waves (1) and (2) may be complete. Intermediate wave (3) may be over at any stage now. Intermediate wave (4) may not move into intermediate wave (1) price territory below 3,027.98.
Within cycle wave V, the corrections of primary wave 2, intermediate wave (2) and minor wave 2 all show up clearly on the weekly chart. For cycle wave V to have the right look, the corresponding corrections of minor wave 4, intermediate wave (4) and primary wave 4 should also show up on the weekly chart. Minor wave 4 now shows up on the weekly chart, and so now two more large multi-week corrections are needed as cycle wave V continues higher, and for this wave count the whole structure must complete at or before 3,477.39.
DAILY CHART
Click chart to enlarge.
Minor waves 2 and 4 for this wave count both subdivide as zigzags; there is no alternation in structure. Minor wave 2 is deep at 0.83 the length of minor wave 1, and minor wave 4 is shallow at 0.26 the length of minor wave 3; there is alternation in depth. Minor wave 2 lasted 10 sessions and minor wave 4 lasted 7 sessions; the proportion is acceptable and gives the wave count the right look.
There is no adequate Fibonacci ratio between minor waves 1 and 3. This makes it more likely that minor wave 5 may exhibit a Fibonacci ratio. The target expects minor wave 5 to exhibit the most common Fibonacci ratio within an impulse.
Within minor wave 5, no second wave correction may move beyond its start below 3,214.68.
When intermediate waves (3) and (4) may be complete, then a target will again be calculated for primary wave 3.
Price is now above the upper edge of the teal channel, which is copied over from the weekly chart. This trend line may now be about where price may find some support.
HOURLY CHART
Click chart to enlarge.
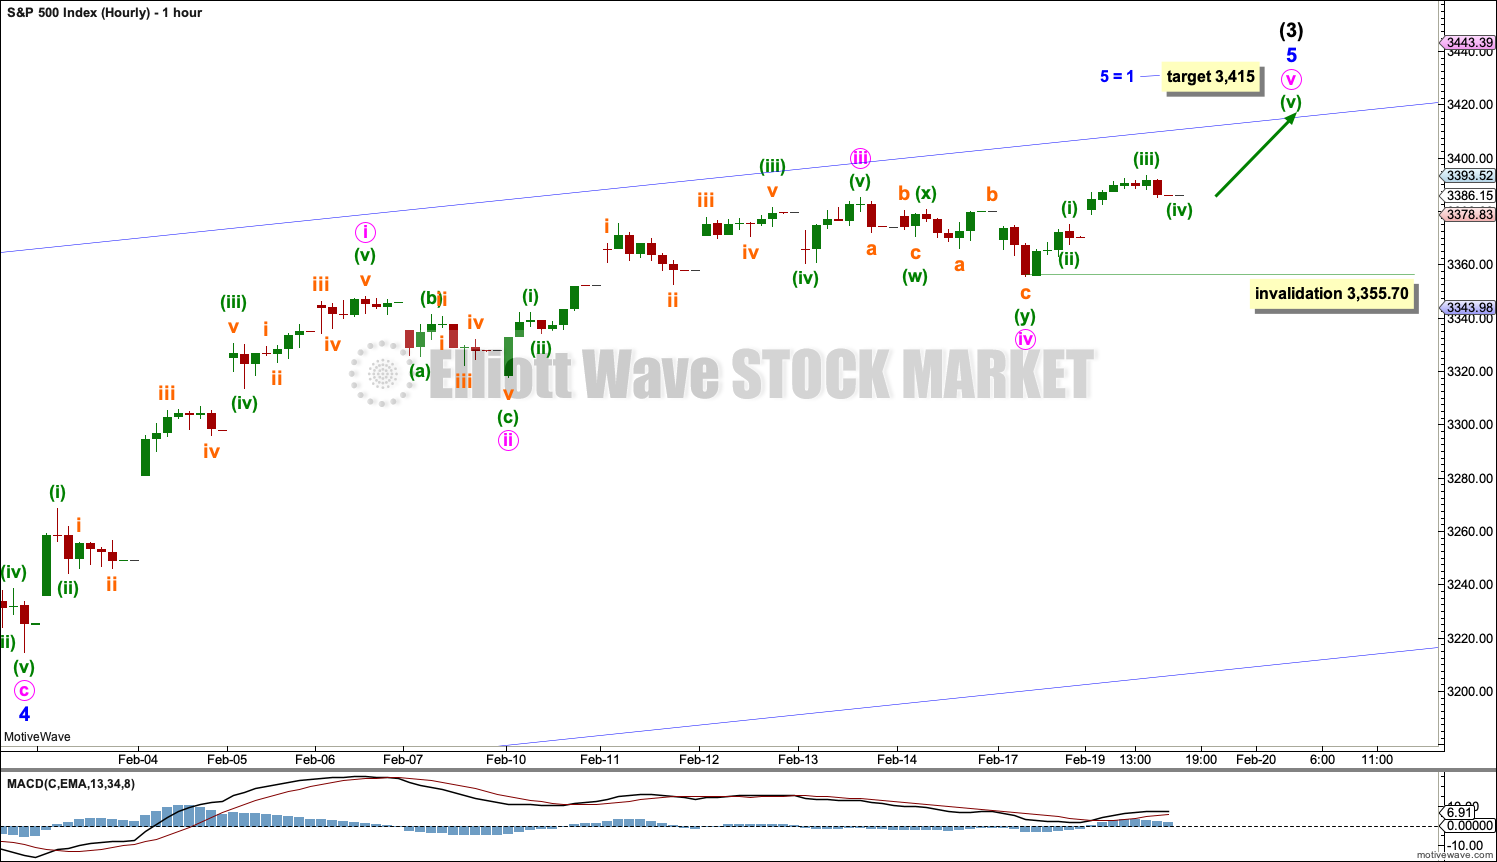
Minor wave 5 may subdivide as either an ending diagonal or an impulse. An impulse is much more common and so shall be charted unless overlapping suggests a diagonal.
So far within minor wave 5, minute waves i through to iv may be complete.
If this wave count is correct, then minute wave iii is shorter than minute wave i. This limits minute wave v to no longer than equality in length with minute wave iii at 3,423.02, so that minute wave iii is not the shortest actionary wave and the core Elliott wave rule is met.
Minute wave v may now be underway and subdividing as an impulse. Within minute wave v, no second wave correction may move beyond the start of its first wave below 3,355.70.
A new low now below 3,355.70 would indicate minor wave 5 and in turn intermediate wave (3) would most likely be over. At that stage, expect that a multi-week correction for intermediate wave (4) would most likely have arrived.
SECOND WAVE COUNT
WEEKLY CHART
Click chart to enlarge.
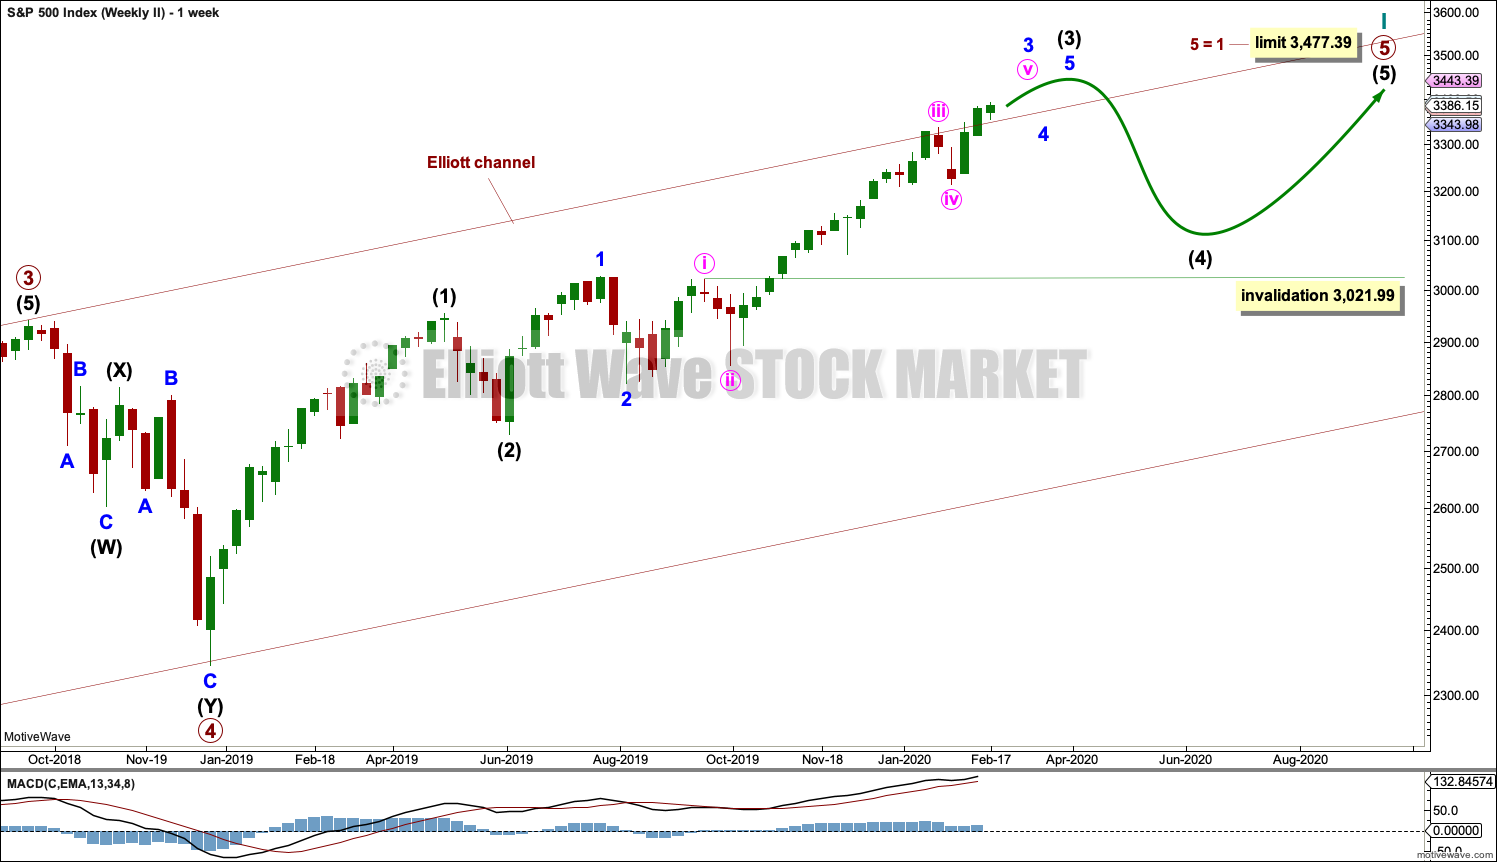
This second wave count sees all subdivisions from the end of the March 2009 low in almost the same way, with the sole difference being the degree of labelling.
If the degree of labelling for the entirety of this bull market is all moved down one degree, then only a first wave at cycle degree may be nearing an end.
When cycle wave I is complete, then cycle wave II should meet the technical definition of a bear market as it should retrace more than 20% of cycle wave I, but it may end about either the 0.382 or 0.618 Fibonacci Ratios of cycle wave I. Cycle wave II may end close to the low of primary wave II within cycle wave I, which is at 1,810.10. It is also possible that cycle wave II could be fairly shallow and only barely meet the definition of a bear market.
The impulse is still viewed as nearing an end; a fifth wave is still seen as needing to complete higher. This wave count labels it primary wave 5. Primary wave 5 may still need another year to two or so to complete, depending upon how time consuming the corrections within it may be.
Primary wave 5 may be subdividing as an impulse, in the same way that cycle wave V is seen for the first weekly chart.
TECHNICAL ANALYSIS
WEEKLY CHART
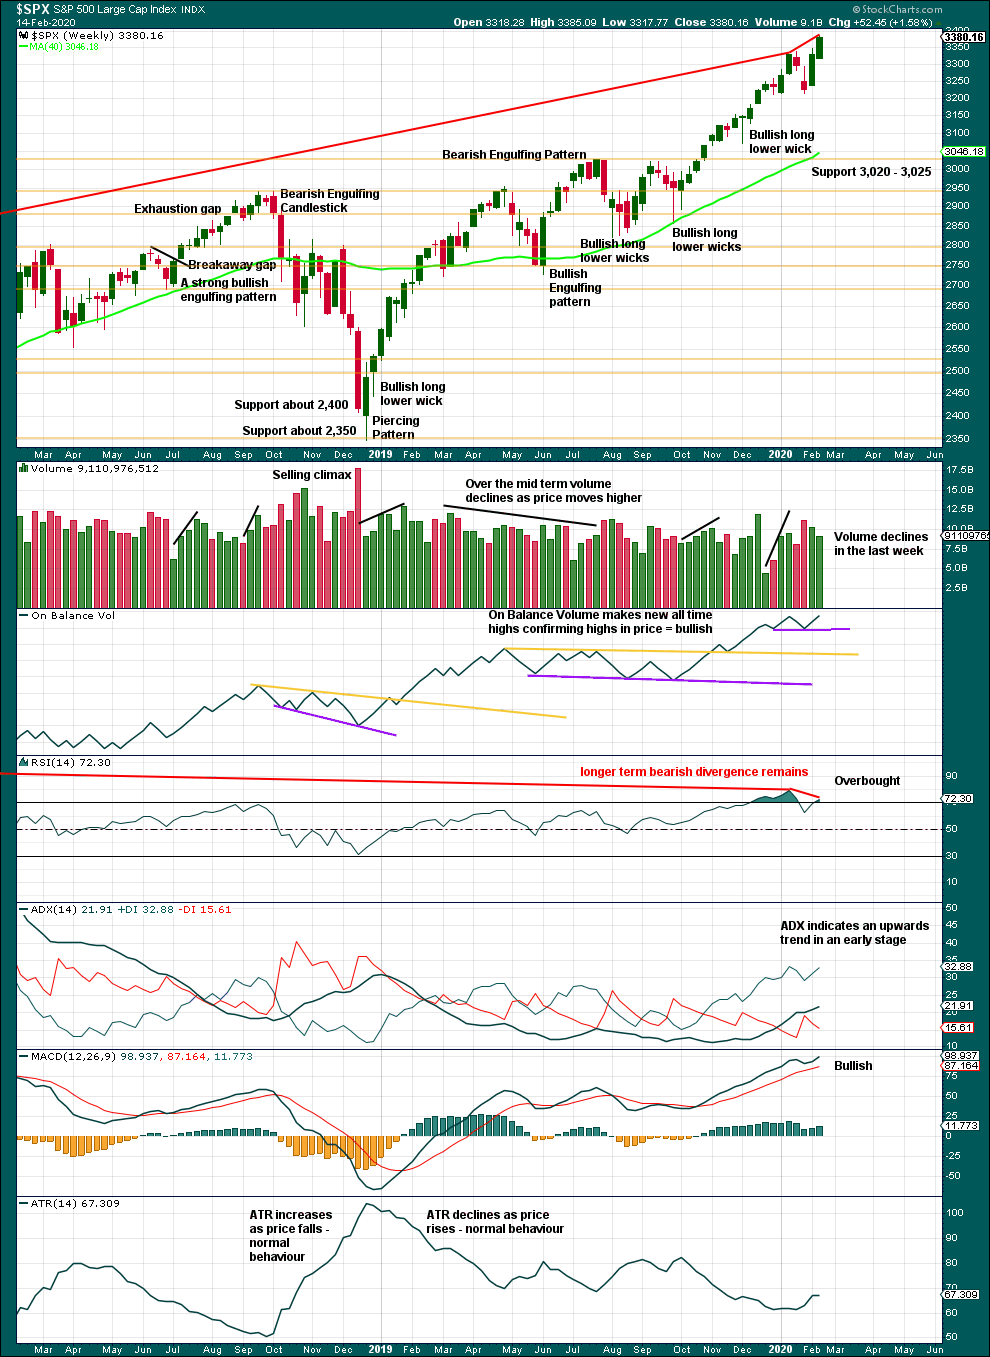
Click chart to enlarge. Chart courtesy of StockCharts.com.
It is very clear that the S&P is in an upwards trend and the bull market is continuing. Price does not move in straight lines; there will be pullbacks and consolidations along the way.
This chart is overall bullish. There are no signs of weakness in upwards movement.
A pullback or consolidation is complete and found strong support below about 3,020 to 3,025.
This bull market beginning in March 2009 has been characterised now for many years by rising price on declining volume. Despite all technical textbooks stating this is unsustainable, it has now been sustained for over a decade. This is concerning for an eventual bearish move as it may mean that support below is thin and weak, but for now the bull market continues. A decline in volume in current market conditions shall not be read necessarily as bearish.
Last week exhibits some strength in upwards movement with reasonable range, although a small decline in volume again is not of a concern here.
Further pullbacks or consolidations will unfold. Do not expect price to move in a straight line. Pullbacks to support in a bull market may be used as opportunities to join an established trend.
Continued bearish divergence for the short term between price and RSI suggests the risk of a pullback remains high.
DAILY CHART
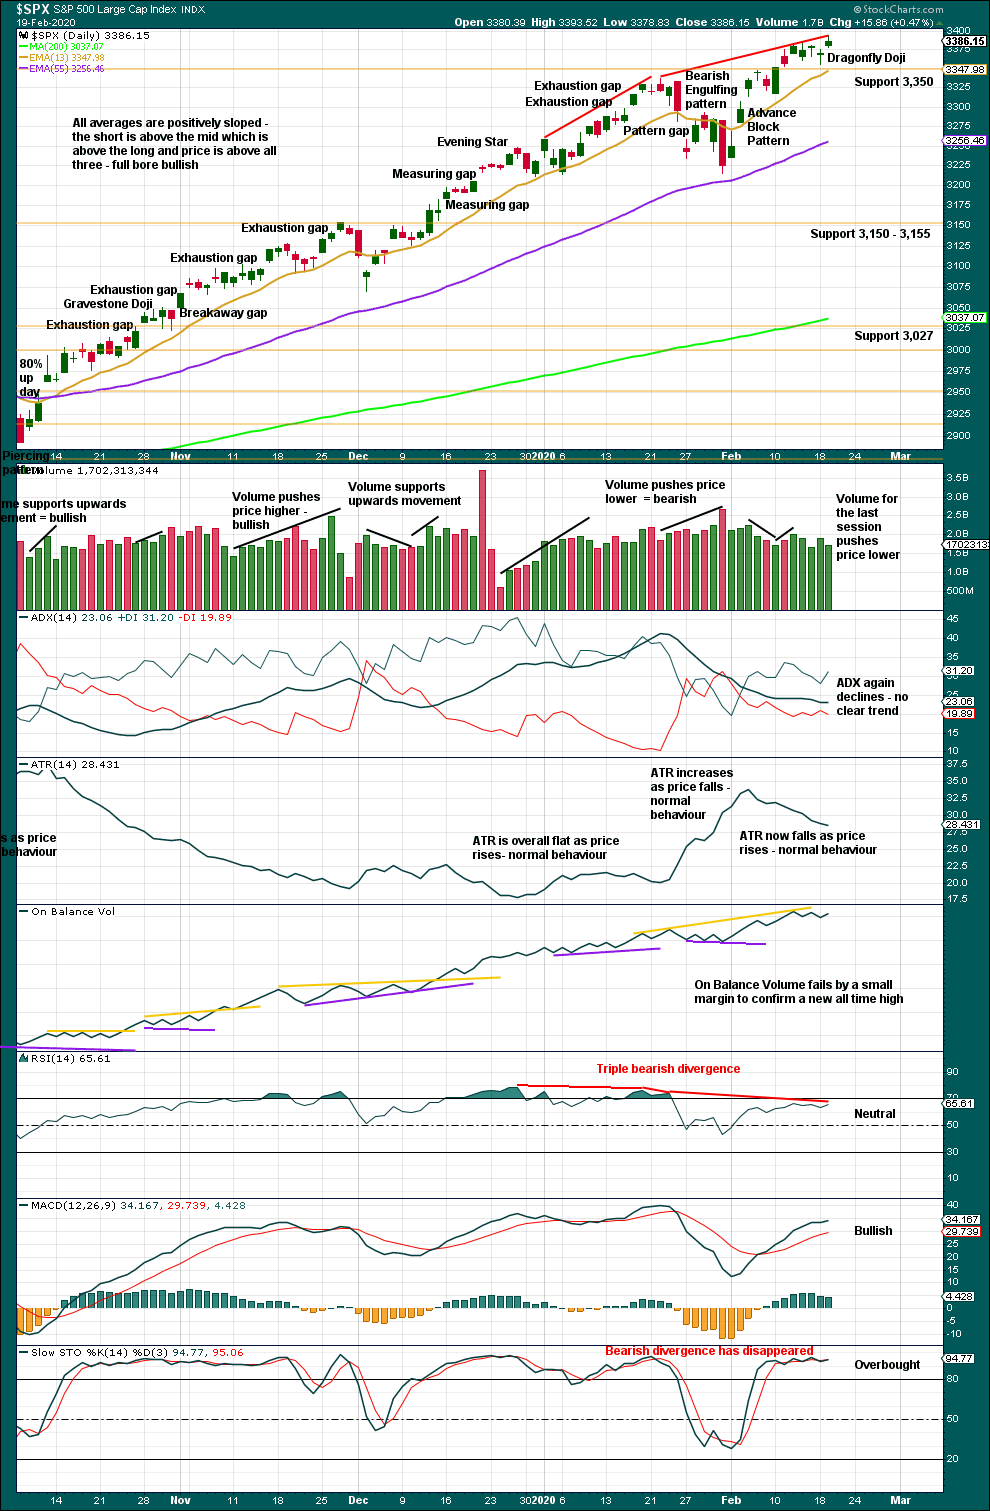
Click chart to enlarge. Chart courtesy of StockCharts.com.
The larger trend, particularly at the monthly time frame, remains up. Expect pullbacks and consolidations to be more short term in nature although they can last a few weeks.
Look for initial support for any pullbacks about 3,350.
The Elliott wave count expects a very little weakness may now be evident as a fifth wave unfolds. Volume is light, On Balance Volume exhibits very weak bearish divergence (although this is so weak, it may just disappear) and RSI still exhibits bearish divergence. This supports the Elliott wave count.
BREADTH – AD LINE
WEEKLY CHART
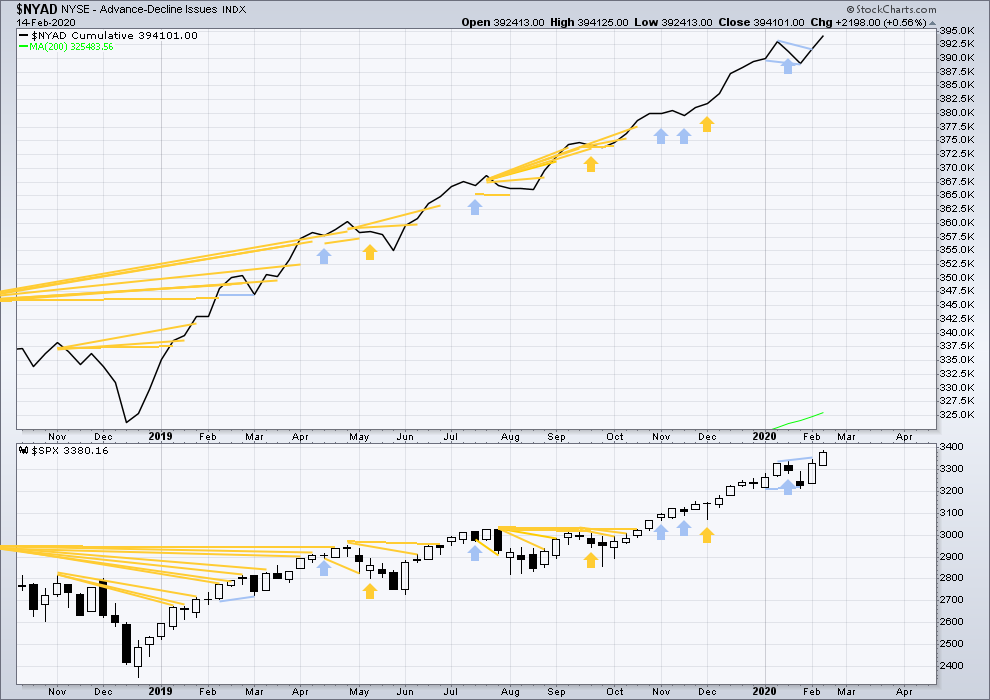
Click chart to enlarge. Chart courtesy of StockCharts.com. So that colour blind members are included, bearish signals
will be noted with blue and bullish signals with yellow.
Bear markets from the Great Depression and onwards have been preceded by an average minimum of 4 months divergence between price and the AD line with only two exceptions in 1946 and 1976. With the AD line making new all time highs last week, the end of this bull market and the start of a new bear market is very likely a minimum of 4 months away, which is mid May 2020.
In all bear markets in the last 90 years there is some positive correlation (0.6022) between the length of bearish divergence and the depth of the following bear market. No to little divergence is correlated with more shallow bear markets. Longer divergence is correlated with deeper bear markets.
If a bear market does develop here, it comes after no bearish divergence. It would therefore more likely be shallow.
Bearish short-term divergence noted last week has not been followed by any downwards movement. It is considered to have failed.
This week both price and the AD line have made new all time highs. Upwards movement has support from rising market breadth. This is bullish and supports the Elliott wave count.
Large caps all time high: 3,393.52 on 19th February 2020.
Mid caps all time high: 2,106.30 on 17th January 2020.
Small caps all time high: 1,100.58 on 27th August 2018.
For the short term, there is a little weakness now in only large caps making most recent new all time highs.
DAILY CHART
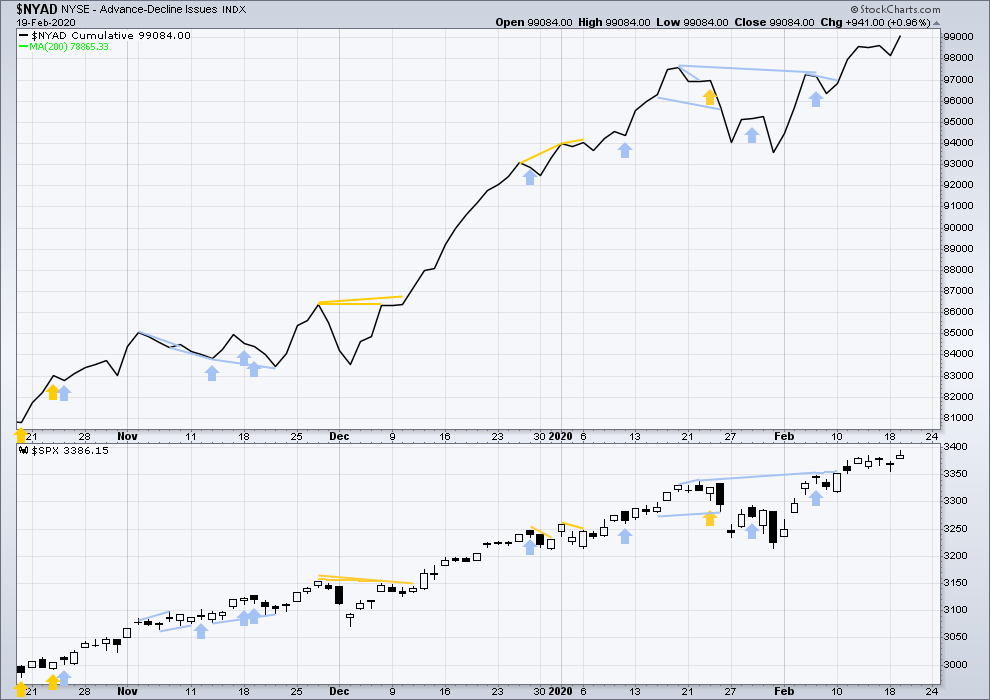
Click chart to enlarge. Chart courtesy of StockCharts.com. So that colour blind members are included, bearish signals
will be noted with blue and bullish signals with yellow.
Breadth should be read as a leading indicator.
A new all time high in price has support from a corresponding new all time high in the AD line. This supports the Elliott wave count.
VOLATILITY – INVERTED VIX CHART
WEEKLY CHART
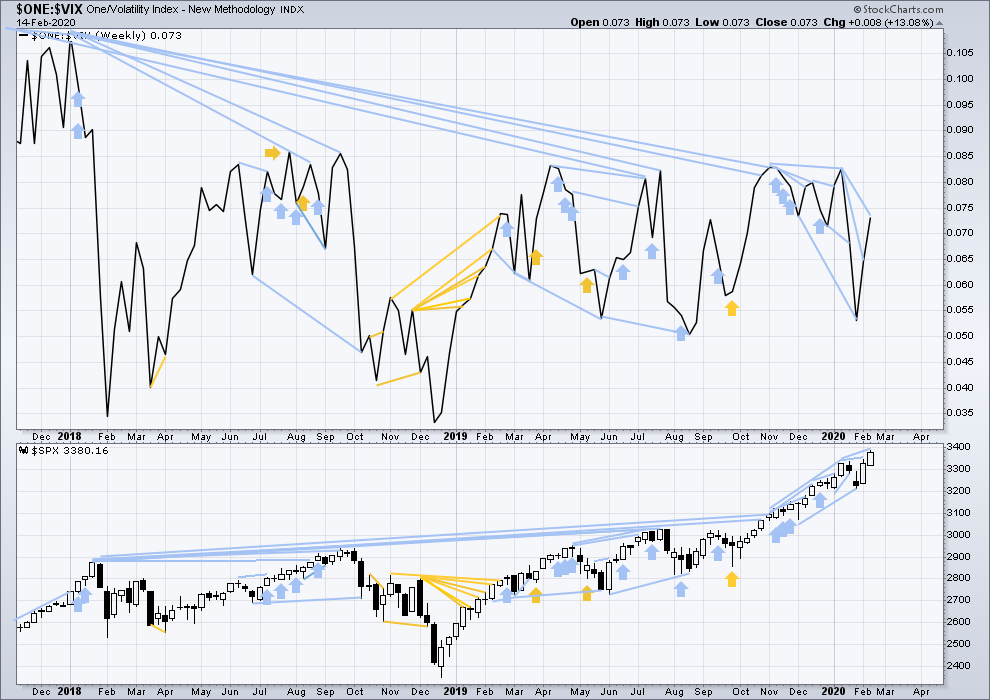
Click chart to enlarge. Chart courtesy of StockCharts.com. So that colour blind members are included, bearish signals
will be noted with blue and bullish signals with yellow.
The all time high for inverted VIX was on 30th October 2017. There is now over two years of bearish divergence between price and inverted VIX.
The rise in price is not coming with a normal corresponding decline in VIX; VIX remains elevated. This long-term divergence is bearish and may yet develop further as the bull market matures.
This divergence may be an early warning, a part of the process of a top developing that may take years. It is clearly not useful in timing a trend change from bull to a fully fledged bear market.
Price has moved higher and made a new high, but inverted VIX has not. There is again short, mid and long-term bearish divergence. This supports the main Elliott wave count.
DAILY CHART
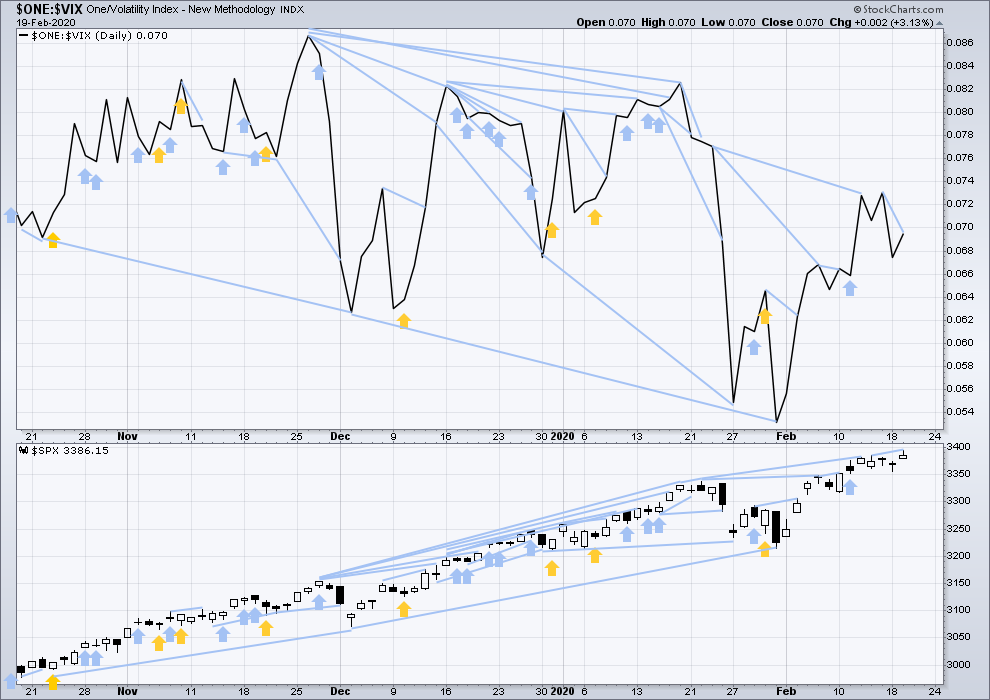
Click chart to enlarge. Chart courtesy of StockCharts.com. So that colour blind members are included, bearish signals
will be noted with blue and bullish signals with yellow.
A new all time high today in price does not come with a corresponding new high for inverted VIX. There is again all of short, mid and long-term bearish divergence between price and inverted VIX.
DOW THEORY
Dow Theory confirmed a bear market in December 2018. This does not necessarily mean a bear market at Grand Super Cycle degree though; Dow Theory makes no comment on Elliott wave counts. On the 25th of August 2015 Dow Theory also confirmed a bear market. The Elliott wave count sees that as part of cycle wave II. After Dow Theory confirmation of a bear market in August 2015, price went on to make new all time highs and the bull market continued.
DJIA: 23,344.52 – a close on the 19th of December at 23,284.97 confirms a bear market.
DJT: 9,806.79 – price has closed below this point on the 13th of December.
S&P500: 2,532.69 – a close on the 19th of December at 2,506.96 provides support to a bear market conclusion.
Nasdaq: 6,630.67 – a close on the 19th of December at 6,618.86 provides support to a bear market conclusion.
With all the indices having moved higher following a Dow Theory bear market confirmation, Dow Theory would confirm a bull market if the following highs are made:
DJIA: 26,951.81 – a close above this point has been made on the 3rd of July 2019.
DJT: 11,623.58 – to date DJT has failed to confirm an ongoing bull market.
S&P500: 2,940.91 – a close above this point was made on the 29th of April 2019.
Nasdaq: 8,133.30 – a close above this point was made on the 26th of April 2019.
Published @ 07:31 p.m. EST.
—
Careful risk management protects your trading account(s).
Follow my two Golden Rules:
1. Always trade with stops.
2. Risk only 1-5% of equity on any one trade.
—
New updates to this analysis are in bold.
I took a deep breath and added to my TSLA short yesterday. Took some off the table on today’s dive. Will reload on any reclaim of 900.00
Kevin was right about a possible double top it appears….
hey Verne! do you have a target?
At this point with about 45 minutes left in the day session, RUT is UP very slightly on the day! While /NQ is showing down -1.3%. /ES right in the middle at -0.6%. So RUT in the recently unusual position of being the leader by a long ways today, after being the laggard throughout the move up from the Jan 31 low.
Bonds up a lot, gold up a lot, but also oil up alot…so a rather mixed up market.
Yep. Silver lagging, as ususal, but not for long…!
Getting ready to RR on a new low into the close….
I hear Morgan Stanley is buying E-Trade.
That ought to be fun having the banksters trading against their clients…!
Thumbs up:) That’s the goal, I guess:)
Thank you for that timely update Lara
Just in case anyone missed my comment yesterday:
If members wish to cancel subscriptions you must do this yourself on your paypal account, or email me admin@elliottwavestockmarket.com or Cesar webmaster@elliottwavestockmarket.com.
Instructions on how to do this are in the welcome email and on the FAQ page.
DO NOT leave a comment underneath the analysis requesting a cancellation. It may not be found and so won’t be actioned.
Any members doing this and then expecting refunds may find themselves blacklisted.
who would cancel? Great guidance as usual Lara.
IKR
I’m always wondering the reasons. When the S&P is in a bullish move more people cancel. When it moves down, more people sign up.
It doesn’t seem to have much correlation to my accuracy or lack of it from time to time.
I think this and next year are crucial and thinking that bullish continues as easy as last year would be too naive. This service is great. While there are alternatives as there should be, you keep investors up-to-date on technicals and big picture.
We should get a lower low to complete a three wave correction down and then whooosh…!
Invalidation of the main count at the hourly chart level with a new low today below 3,355.70 indicates intermediate (3) may be over and intermediate (4) may have just begun.
Intermediate (2) lasted 5 weeks. Intermediate (4) may be of even duration, or it may be longer lasting.
Intermediate (2) was a zigzag, these tend to be quicker structures. Intermediate (4) may be any corrective structure, most likely a flat, triangle or combination. It may also be a zigzag.
If intermediate (4) ends within the price territory of the fourth wave of one lesser degree (that’s minor 4) then it may end close to the 0.236 Fibonacci ratio at 3,258.67.
I may need to move the degree of labelling within intermediate (4) down one degree.
Lara:
Minor 4 was at 3214 and i am trying to understand the rational behind your support level at 23.6 Normally, 4th wave retracement are expected at 38.2. Is this because S&P isnt giving the standard pull-backs that we expect during corrections lately? Thanks and appreciate the response.
Anyone noticed the gap higher in GLD and corresponding gap lower in SLV this morning?
Wassup wid dat??!!
I think sombody’s dumping naked short futures contracts…. hyuk!
Ain’t tradin’ fun???
I’ve been counting my profits on sold put spreads in NDX and RUT. Expire tomorrow morning. Almost closed them this morning, but hey, that would leave a few hundred $$ on the table, and what’s the risk the market tanks so hard I go from a full winner to a lower in these spreads? “That’s not going to happen…”
Well…price is almost 1/2 way there now. Gotta love that feeling of FEAR!!! Lol!!! So please market gods…NOT a >2% melt down in one day!!. 9400 in NDX and 1660 in RUT are my “transition” levels from fat profits to fatter losses. If things tank massively (again) over the next few hours and/or overnight…aich.
Sometimes greed can bite you in the ass hard. I hope this time I learn that lesson without teeth marks.
If GS came out with a call for 10% correction that explains why buffet was selling the stocks into the ramp. Guaranteed GS is positioned well for this drop. I suspect a lot of buy the dip folks will jump if the markets drop over 2% based on the recent past.
You can hedge with bear call spreads a few weeks out dude…. 🙂
I put on some bear call spreads the moment price started tanking this morning as a matter of fact Verne. For next Friday. I’ve also got some VIX calls.
But overall…I’M FEELING MUCH BETTER NOW!!! Lol!!!! Looks like those spreads are gonna be just fine by tomorrow’s open.
My take is a Very Big Player decided to light up/take profits dramatically. Some retail traders joined in, but not a bunch of additional big players, so now we are seeing “buy the dip” activity.
Maybe, Kevin. Or maybe it’s coming down more again. It just retraced close to 61.8 and can start going down. We’ll see
Oh, I suspect it is coming down again. But not substantially today or overnight, certainly not to my break even levels. Steady buying now all the way back up in RUT! Amazing. The bull is not easily deterred.
Yep!
Coronavirus effecting earnings on a lot of US companies. Is this possible that we might be starting Wave 4?
Plus China factories are no where near 100%
A lot of them are between 20 – 60%
Shipping containers to the US are down over 60%
3050 – 3150 completely out of the question?
10% correction will take you there ….let’s hope it goes down fast…:)
Now that we got a new low below 3,355.70, does that mean it will go lower before heading to 3415?
Probably a move just below 3337.77 and a final move up to the 3400+ target imho..
Hi Verne,
where did you see this number 3337.77?
Jan 22 high…
Likely some kind of fourth with one more move up to come. The fireworks start in March…
Like the vibes as feel things will get exciting over the next few days…you still in TSLA…I bought a few cheap ones earlier while it was above $900 ….
Hot mama!
WAM BAM!!!
Is there news? I can’t find any, except a GS call over an hour ago for an “upcoming” 10% correction; I don’t think that’s the driver here.
I’ve taken an IWM and a QQQ short via sold call spread for expiry next (not this) Friday. And the moment it started up I bought a couple of SPY puts too…
No news – just coronovirus impact on earnings – I was saying it all alone – this correction was due as fundamentals will be affected. The question was when, not if.
Here’s an alternative model. First, the wave degrees are “down one” from Lara’s main; just ignore that, what’s important is structure.
I note the strong similarity of price action leading to, and then occurring within, the first (left most) gray ellipse, relative to the price action leading to the right most (current) gray ellipse. This wave model maps to the thesis that this symmetry of price action will continue. And it is consistent with the general thesis that we are in a extraordinarily strong secular bull market phase that will generate a long sequence of monthly “up” candlesticks with consistently higher lows and highs.
It’s just a model, not a prediction. But if this car of a market keeps driving “up the road” as it has been instead of turning down soon, this model grows in probability.
Here’s a view of RUT that aligns with a starting now or very very soon intermediate 4 in SPX. Unlike SPX, RUT never got back to new highs after the Jan sell off. Thus, if it turns back down here, it’s a continuation of that correction ala what we thought for some time that SPX would do (a big flat or triangle). I can see the moves as a 3 down and 3 up as marked here, giving a possible combination, and there’s always the possibility of a triangle, particularly since the b wave (minute x on this chart) has reached that 76-78% retrace zone.
But I will not be surprised to see RUT blow this model out of the water next week with more push up. Absolutely not betting against the high time frame strong up trends unless/until there are plenty of confirming indicators that this model or something similar is in play.
I might be wrong but the multi week down move would mean significant economic event. I do see a swift down move that lasts a week or so. I see this happening before first week of March is out in alignment with seasonal weakness.
I think Intermediate 4 may have begun
That is entirely possible. Any day now…
Does it have to break 3355 below to be certain?
There’s nothing in the current action that indicates to me it’s started (though it may have). Not UNTIL it breaks below 3355 do I get remotely interested in price movement downward. The massively strong quarterly, monthly and weekly trends are UP. I’m not going to fight the tape.
I agree Kevin. patience is a virtue.
Just broke 3355
#1!!
#2