
Another new all time high was expected. Downwards movement within the session remains above the short-term invalidation point.
The bull market continues as this analysis has been expecting for months now.
Summary: The trend is up.
The target for the next interruption to the trend is at 3,415.
Two more large pullbacks or consolidations (fourth waves) during the next 1-2 years are expected: for intermediate (4) and then primary 4.
The biggest picture, Grand Super Cycle analysis, is here.
Last monthly charts analysis is here with video here.
ELLIOTT WAVE COUNTS
FIRST WAVE COUNT
WEEKLY CHART
Click chart to enlarge.
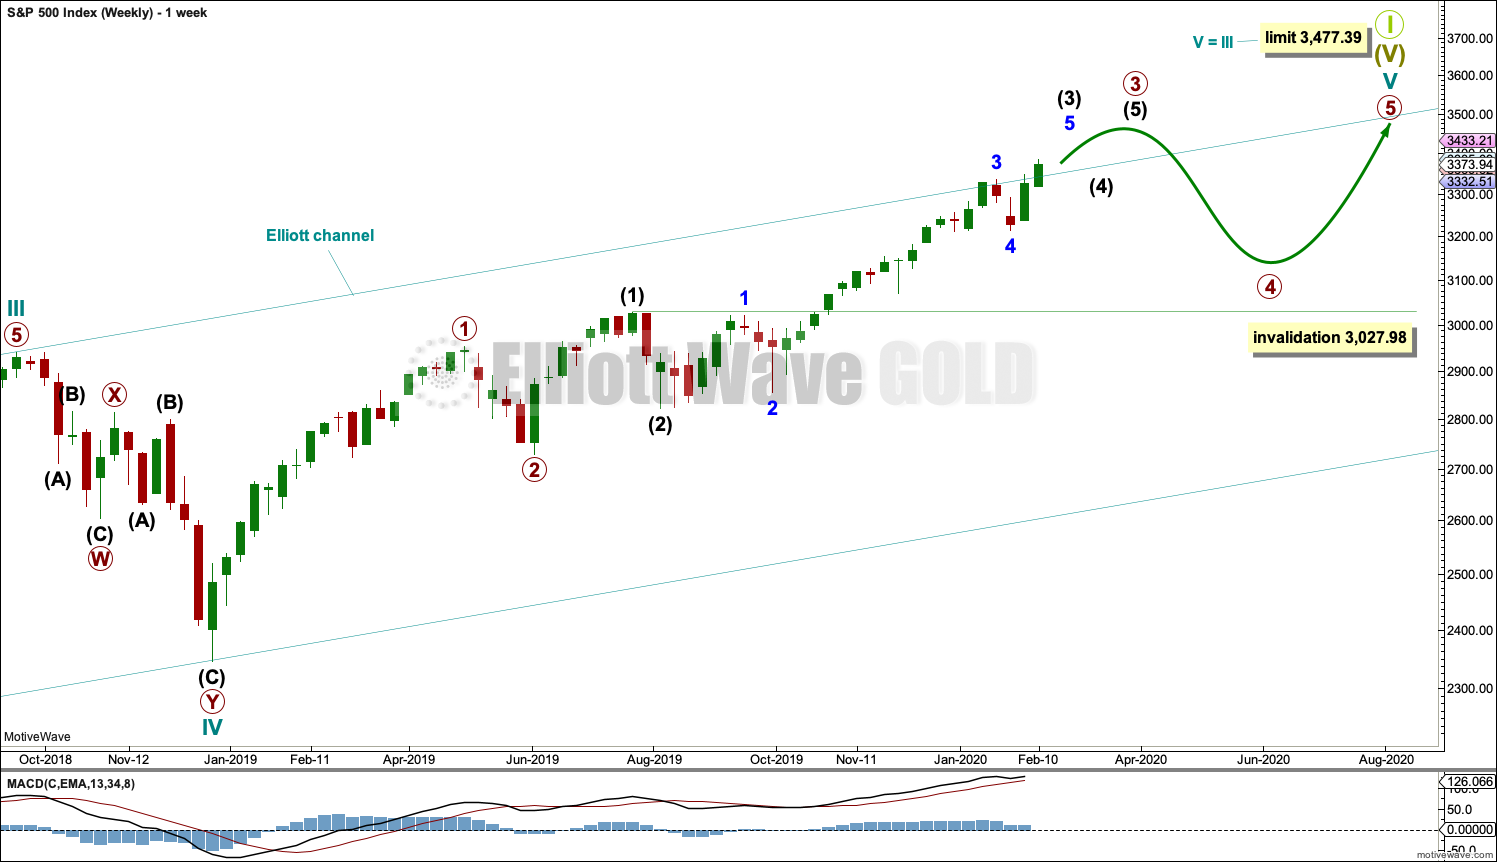
Cycle wave V may subdivide either as an impulse or an ending diagonal. Impulses are much more common, and it is clear at this stage that cycle wave V is an impulse and not a diagonal.
At this stage, cycle wave V may take another one to two or so years to complete.
A channel is drawn about the impulse of Super Cycle wave (V) using Elliott’s first technique. Draw this channel first from the high of 2,079.46 on the 5th of December 2014 to the high of 2,940.91 on the 21st of September 2018, then place a parallel copy on the low at 1,810.10 on the 11th of February 2016. Cycle wave IV found support about the lower edge.
Within Super Cycle wave (V), cycle wave III may not be the shortest actionary wave. Because cycle wave III is shorter than cycle wave I, this limits cycle wave V to no longer than equality in length with cycle wave III at 3,477.39. A new high by any amount at any time frame above this point would invalidate this main wave count in favour of one of the two alternate wave counts in the monthly chart analysis which are much more bullish.
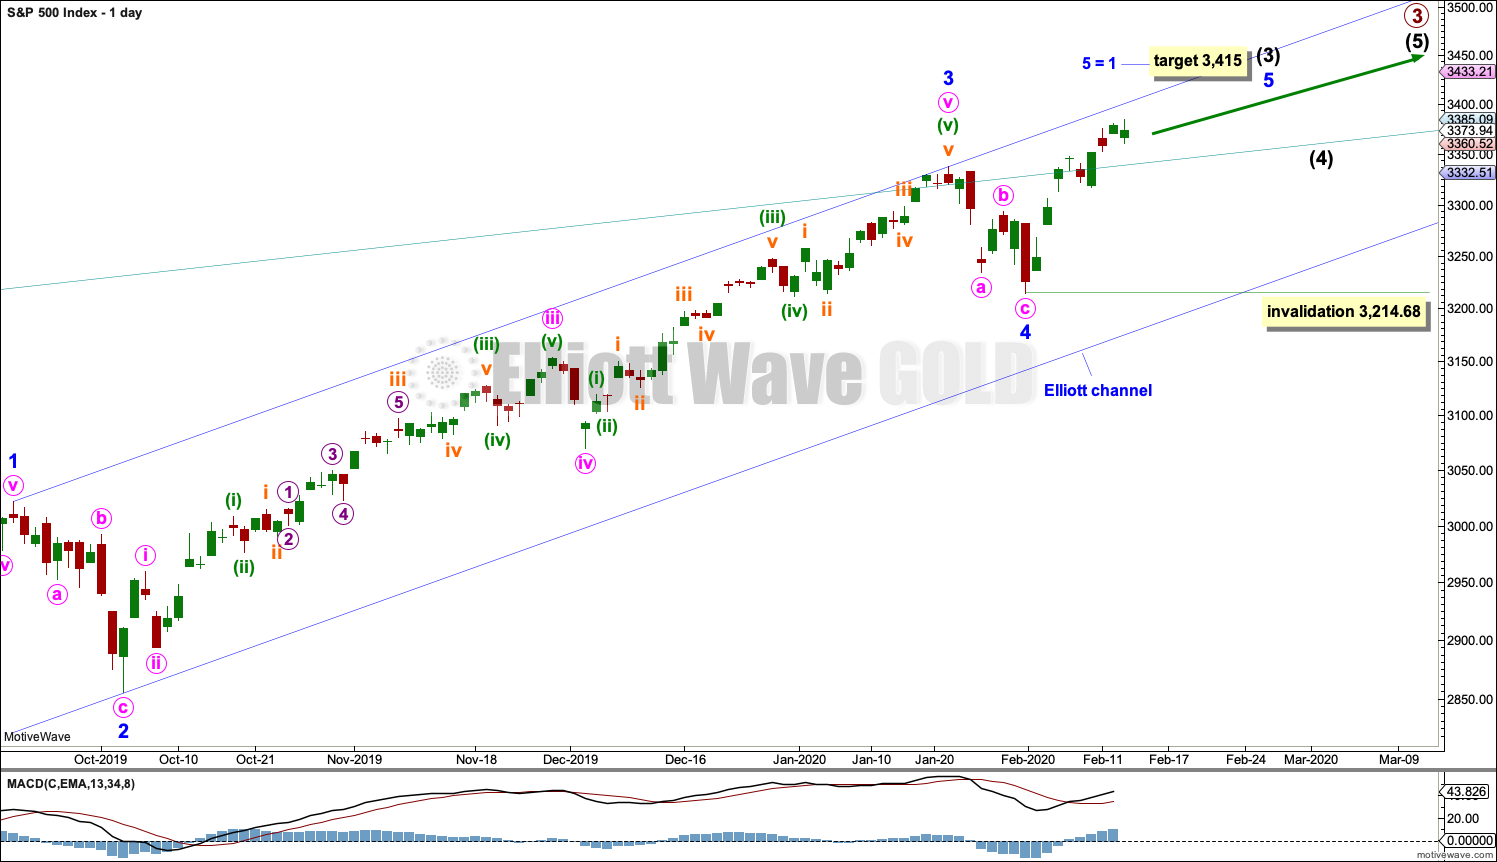
The daily chart below will focus on movement from the end of minor wave 1 within intermediate wave (3).
Within cycle wave V, primary waves 1 and 2 may be complete. Within primary wave 3, intermediate waves (1) and (2) may be complete. Intermediate wave (3) may be over at any stage now. Intermediate wave (4) may not move into intermediate wave (1) price territory below 3,027.98.
Within cycle wave V, the corrections of primary wave 2, intermediate wave (2) and minor wave 2 all show up clearly on the weekly chart. For cycle wave V to have the right look, the corresponding corrections of minor wave 4, intermediate wave (4) and primary wave 4 should also show up on the weekly chart. Minor wave 4 now shows up on the weekly chart, and so now two more large multi-week corrections are needed as cycle wave V continues higher, and for this wave count the whole structure must complete at or before 3,477.39.
DAILY CHART
Click chart to enlarge.
Minor waves 2 and 4 for this wave count both subdivide as zigzags; there is no alternation in structure. Minor wave 2 is deep at 0.83 the length of minor wave 1, and minor wave 4 is shallow at 0.26 the length of minor wave 3; there is alternation in depth. Minor wave 2 lasted 10 sessions and minor wave 4 lasted 7 sessions; the proportion is acceptable and gives the wave count the right look.
There is no adequate Fibonacci ratio between minor waves 1 and 3. This makes it more likely that minor wave 5 may exhibit a Fibonacci ratio. The target expects minor wave 5 to exhibit the most common Fibonacci ratio within an impulse.
Within minor wave 5, no second wave correction may move beyond its start below 3,214.68.
When intermediate waves (3) and (4) may be complete, then a target will again be calculated for primary wave 3.
Price is now above the upper edge of the teal channel, which is copied over from the weekly chart. This trend line may now be about where price may find some support.
HOURLY CHART

Click chart to enlarge.
Minor wave 5 may subdivide as either an ending diagonal or an impulse. An impulse is much more common and so shall be charted unless overlapping suggests a diagonal.
So far within minor wave 5, minute waves i and ii may be complete. Minute wave iii may have begun. Within minute wave iii, minuette waves (i) and (ii) may be complete.
Within minuette wave (iii), subminuette waves i and ii may be complete. Within subminuette wave iii, micro wave 1 may be complete and micro wave 2 may not move beyond the start of micro wave 1 below 3,360.52.
This wave count now expects the next upwards movement may be a third wave at four small degrees. Some increase in momentum may be expected.
SECOND WAVE COUNT
WEEKLY CHART
Click chart to enlarge.
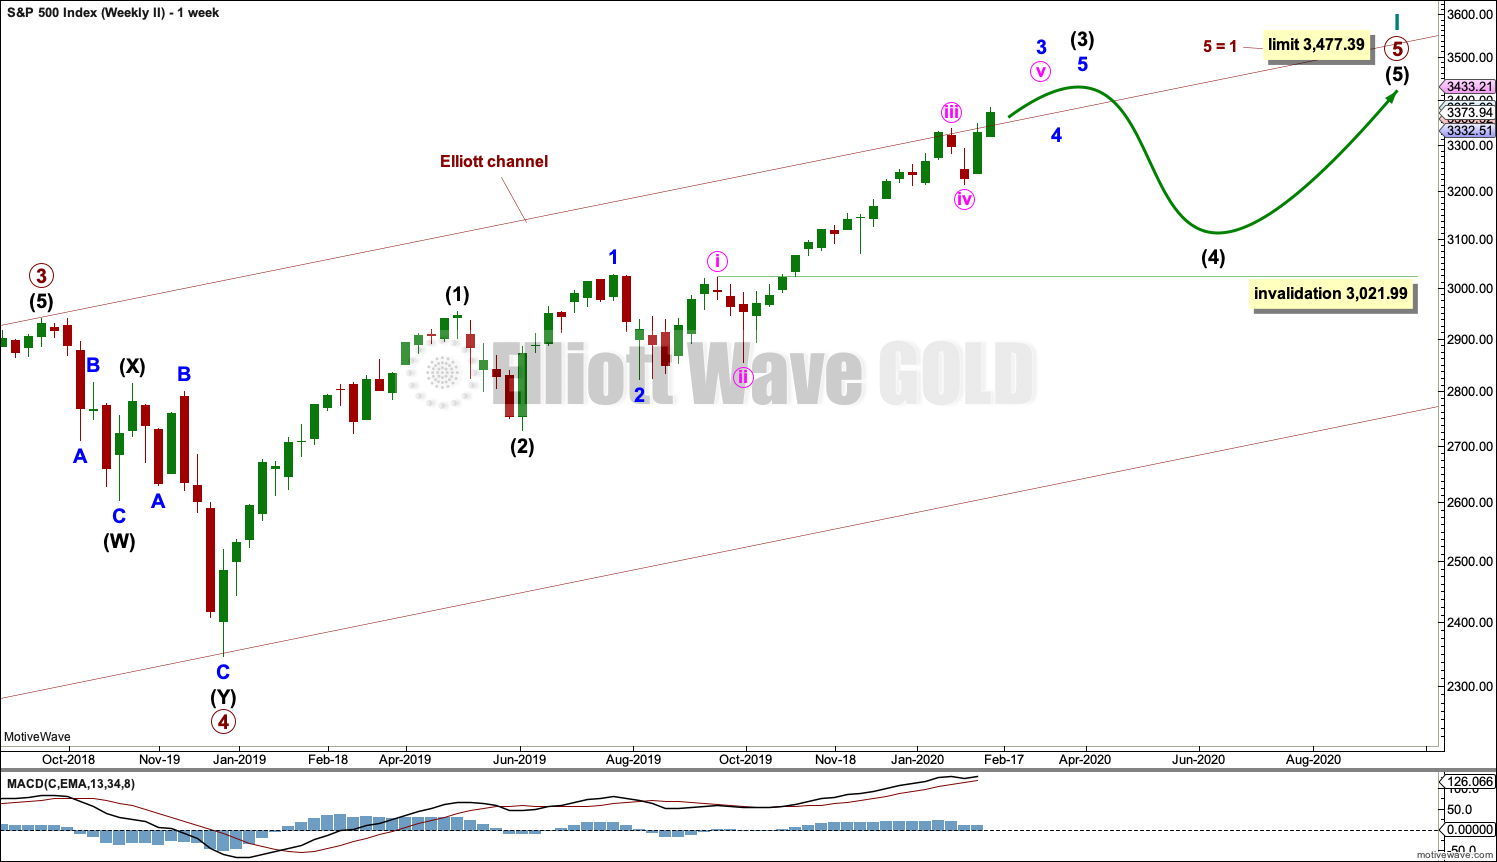
This second wave count sees all subdivisions from the end of the March 2009 low in almost the same way, with the sole difference being the degree of labelling.
If the degree of labelling for the entirety of this bull market is all moved down one degree, then only a first wave at cycle degree may be nearing an end.
When cycle wave I is complete, then cycle wave II should meet the technical definition of a bear market as it should retrace more than 20% of cycle wave I, but it may end about either the 0.382 or 0.618 Fibonacci Ratios of cycle wave I. Cycle wave II may end close to the low of primary wave II within cycle wave I, which is at 1,810.10. It is also possible that cycle wave II could be fairly shallow and only barely meet the definition of a bear market.
The impulse is still viewed as nearing an end; a fifth wave is still seen as needing to complete higher. This wave count labels it primary wave 5. Primary wave 5 may still need another year to two or so to complete, depending upon how time consuming the corrections within it may be.
Primary wave 5 may be subdividing as an impulse, in the same way that cycle wave V is seen for the first weekly chart.
TECHNICAL ANALYSIS
WEEKLY CHART
Click chart to enlarge. Chart courtesy of StockCharts.com.
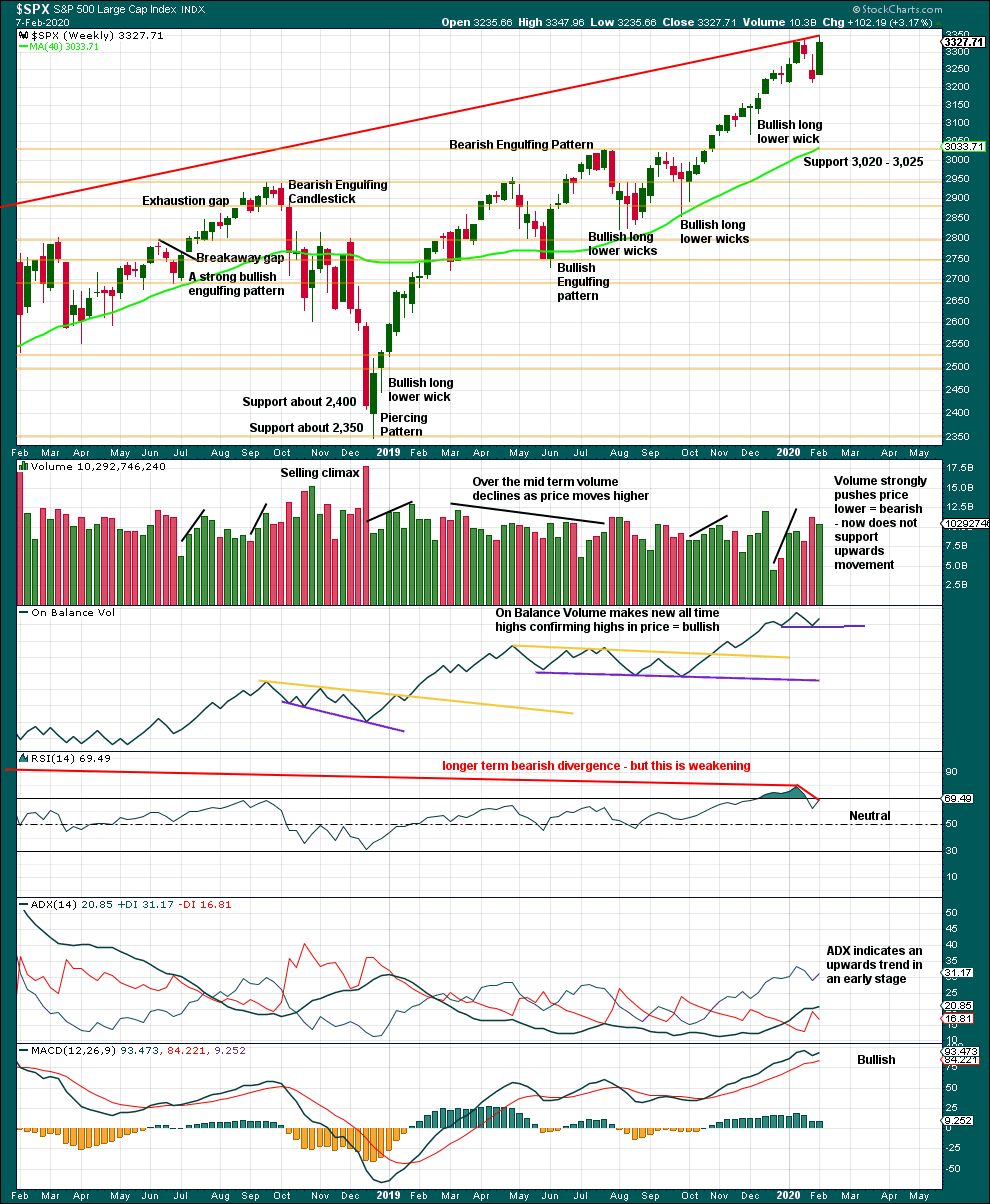
It is very clear that the S&P is in an upwards trend and the bull market is continuing. Price does not move in straight lines; there will be pullbacks and consolidations along the way.
This chart is overall bullish. There are no signs of weakness in upwards movement.
A pullback or consolidation is complete and found strong support below about 3,020 to 3,025.
Although price has made a slight new high last week, it has not done so with conviction. Volume is weaker than the prior downwards week, and RSI and On Balance Volume exhibit short-term bearish divergence.
DAILY CHART
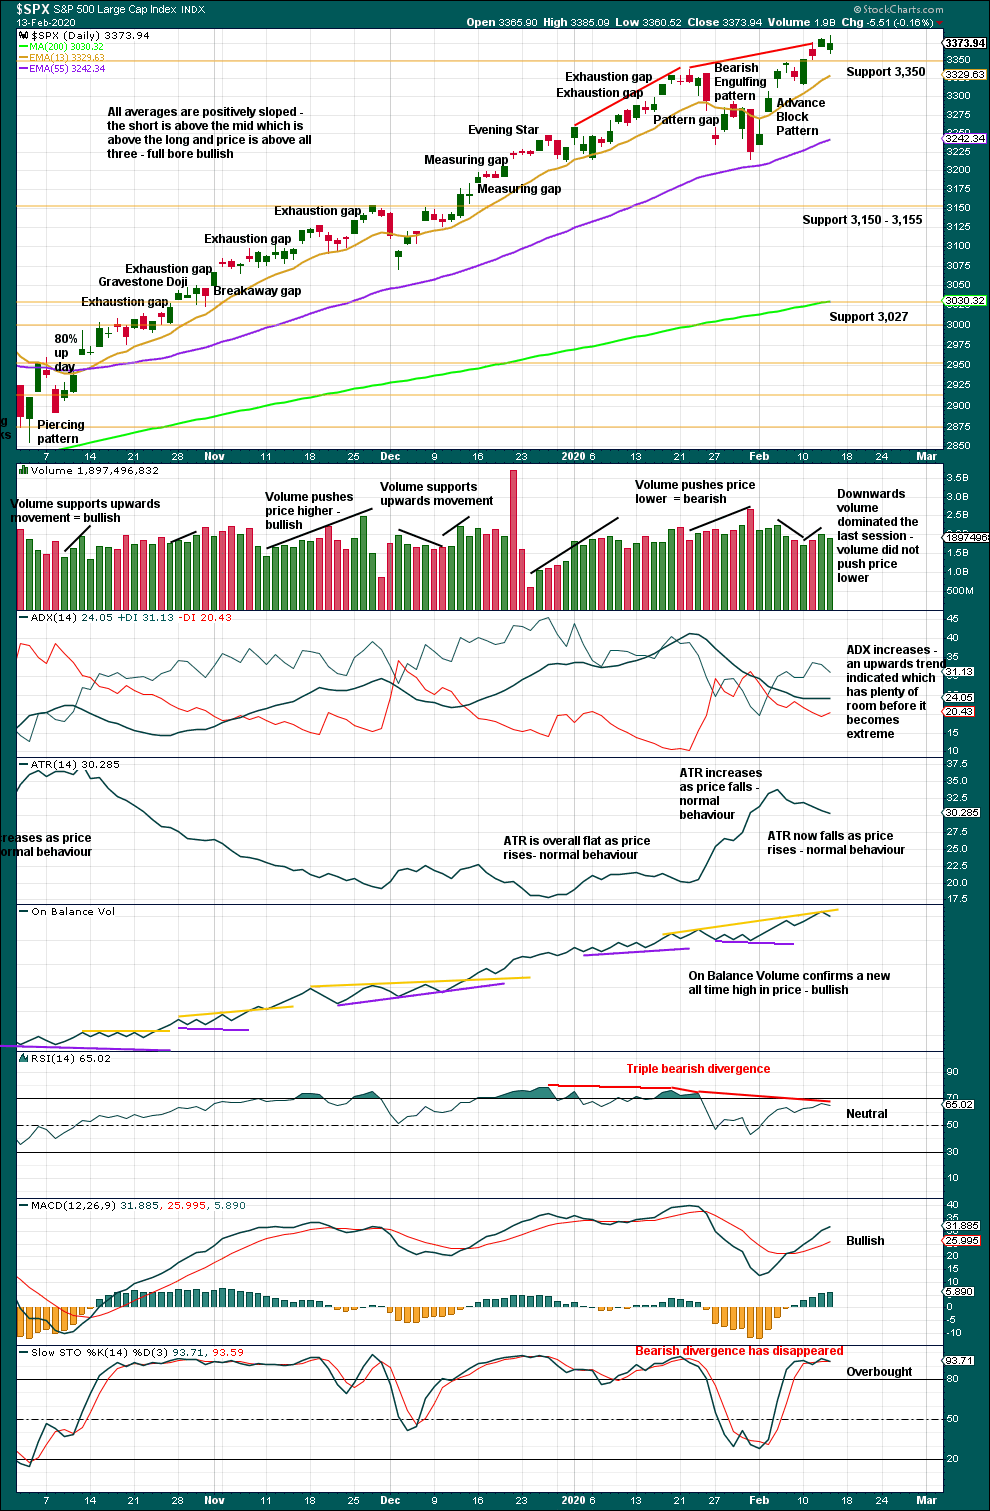
Click chart to enlarge. Chart courtesy of StockCharts.com.
The larger trend, particularly at the monthly time frame, remains up. Expect pullbacks and consolidations to be more short term in nature although they can last a few weeks.
An outside day closes green, the balance of volume is down, and downwards volume dominated the session at 70% of total up/down volume (data from Lowry’s). With some decline in volume, this downwards movement is weak and suggests pullbacks here may be brief and shallow.
BREADTH – AD LINE
WEEKLY CHART
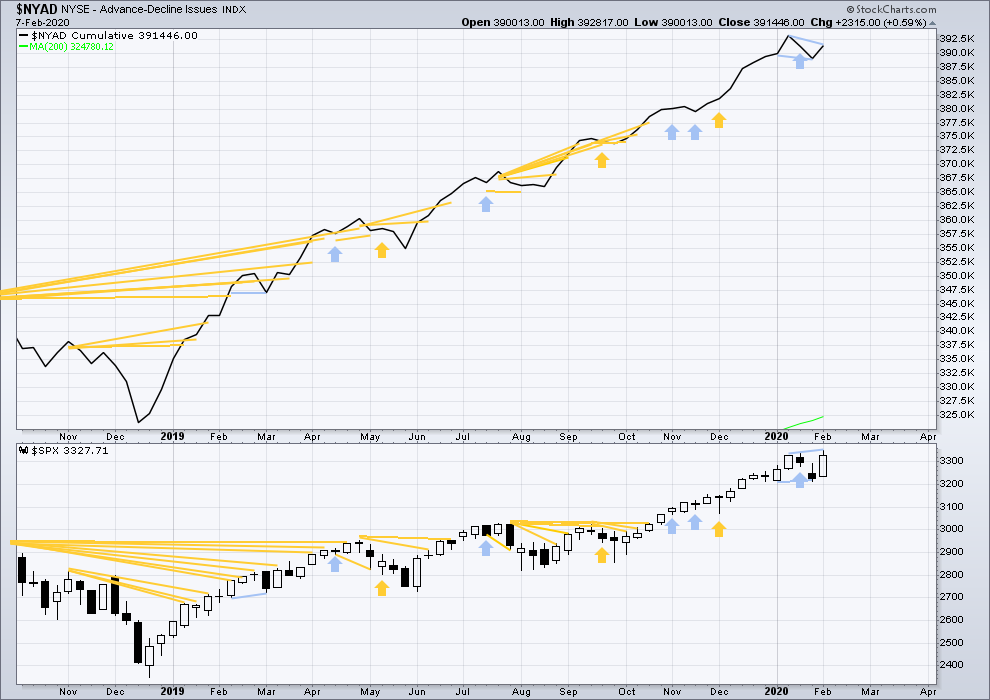
Click chart to enlarge. Chart courtesy of StockCharts.com. So that colour blind members are included, bearish signals
will be noted with blue and bullish signals with yellow.
Bear markets from the Great Depression and onwards have been preceded by an average minimum of 4 months divergence between price and the AD line with only two exceptions in 1946 and 1976. With the AD line making new all time highs last week, the end of this bull market and the start of a new bear market is very likely a minimum of 4 months away, which is mid May 2020.
In all bear markets in the last 90 years there is some positive correlation (0.6022) between the length of bearish divergence and the depth of the following bear market. No to little divergence is correlated with more shallow bear markets. Longer divergence is correlated with deeper bear markets.
If a bear market does develop here, it comes after no bearish divergence. It would therefore more likely be shallow.
Last week price has made a new high, but the AD line has not. There is now short-term bearish divergence that supports the main Elliott wave count.
Large caps all time high: 3,375.63 on 11th February 2020.
Mid caps all time high: 2,106.30 on 17th January 2020.
Small caps all time high: 1,100.58 on 27th August 2018.
For the short term, there is a little weakness now in only large caps making most recent new all time highs.
DAILY CHART
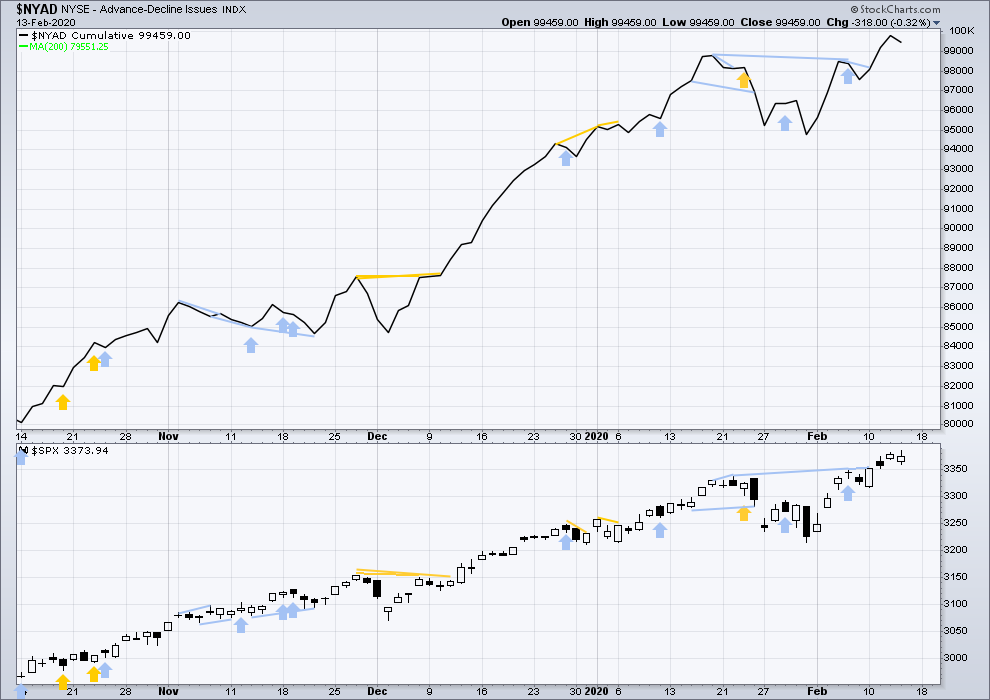
Click chart to enlarge. Chart courtesy of StockCharts.com. So that colour blind members are included, bearish signals
will be noted with blue and bullish signals with yellow.
Breadth should be read as a leading indicator.
Price has completed an outside day. The AD line has declined. This will not be considered divergence. Neither price nor the AD line have made new short-term swing lows.
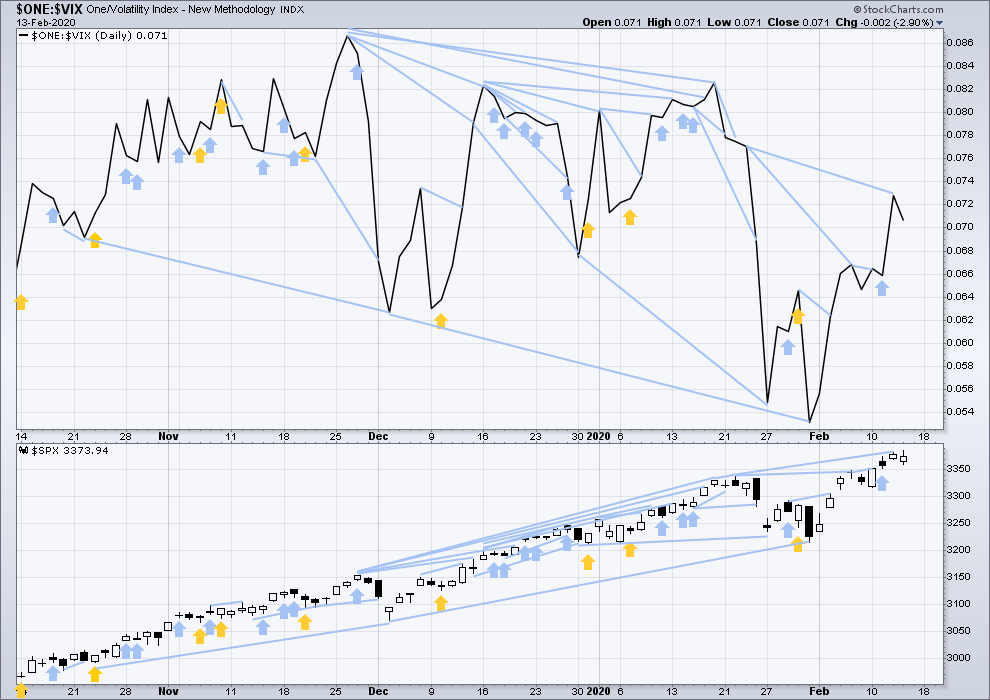
VOLATILITY – INVERTED VIX CHART
WEEKLY CHART
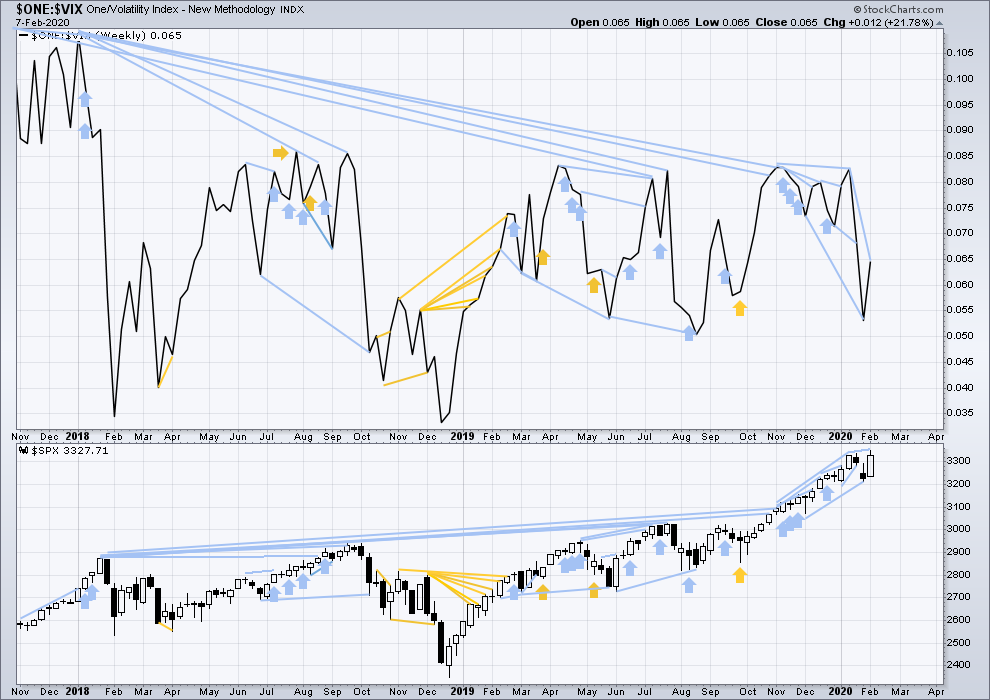
Click chart to enlarge. Chart courtesy of StockCharts.com. So that colour blind members are included, bearish signals
will be noted with blue and bullish signals with yellow.
The all time high for inverted VIX was on 30th October 2017. There is now over two years of bearish divergence between price and inverted VIX.
The rise in price is not coming with a normal corresponding decline in VIX; VIX remains elevated. This long-term divergence is bearish and may yet develop further as the bull market matures.
This divergence may be an early warning, a part of the process of a top developing that may take years. It is clearly not useful in timing a trend change from bull to a fully fledged bear market.
Price has moved higher and made a new high, but inverted VIX has not. There is again short, mid and long-term bearish divergence. This supports the main Elliott wave count.
DAILY CHART
Click chart to enlarge. Chart courtesy of StockCharts.com. So that colour blind members are included, bearish signals
will be noted with blue and bullish signals with yellow.
Price has completed an outside day. Inverted VIX has declined. This will not be considered divergence. Neither price nor inverted VIX have made new short-term swing lows.
DOW THEORY
Dow Theory confirmed a bear market in December 2018. This does not necessarily mean a bear market at Grand Super Cycle degree though; Dow Theory makes no comment on Elliott wave counts. On the 25th of August 2015 Dow Theory also confirmed a bear market. The Elliott wave count sees that as part of cycle wave II. After Dow Theory confirmation of a bear market in August 2015, price went on to make new all time highs and the bull market continued.
DJIA: 23,344.52 – a close on the 19th of December at 23,284.97 confirms a bear market.
DJT: 9,806.79 – price has closed below this point on the 13th of December.
S&P500: 2,532.69 – a close on the 19th of December at 2,506.96 provides support to a bear market conclusion.
Nasdaq: 6,630.67 – a close on the 19th of December at 6,618.86 provides support to a bear market conclusion.
With all the indices having moved higher following a Dow Theory bear market confirmation, Dow Theory would confirm a bull market if the following highs are made:
DJIA: 26,951.81 – a close above this point has been made on the 3rd of July 2019.
DJT: 11,623.58 – to date DJT has failed to confirm an ongoing bull market.
S&P500: 2,940.91 – a close above this point was made on the 29th of April 2019.
Nasdaq: 8,133.30 – a close above this point was made on the 26th of April 2019.
Published @ 09:33 p.m. EST.
—
Careful risk management protects your trading account(s).
Follow my two Golden Rules:
1. Always trade with stops.
2. Risk only 1-5% of equity on any one trade.
—
New updates to this analysis are in bold.
Has anyone read the 1981 novel by Dean Koontz ( under the pseudonym of Lee Nichols)
titled “Eyes of Darkness”?
Hey everybody, I just wanted to say, I did a google search on “Lara Iriarte” yesterday (as I do from time to time to check if anyone out there is breaching copy right) and a few other terms, and I found a couple of really nice comments Verne and Kevin had left for me in different places.
Thank you very much for your support guys! That’s so nice to have. I’m very honoured.
Lara you provide great value. I’m happy to share recommendations to others to take advantage of it where I can.
Lara, you’re the best…hands down! 🙂
I agree – so far this service was very helpful.
I echo the same. Lara your analysis is valued always.
I am very lucky to have a good bunch of appreciative members. Thanks guys!
Hourly chart updated:
Minor 5 still has not passed the middle. It needs to do that, and then unfold a series of fourth and fifth waves. The fourth waves need to all remain above first wave price territory.
It’s looking now that if my target is wrong it may not be high enough.
And the closer we get to the limit of the main count at 3,477.39 the more bullish the outlook gets.
Hi Lara,
could you please explain what the last sentence means: “And the closer we get to the limit of the main count at 3,477.39 the more bullish the outlook gets.” Does it mean you have to re-evaluate the whole 3477.39 limit as the whole monthly count might be wrong or that we could be approaching this target sooner than you expected and big corrections would come sooner?
Thank you,
The market looks and feels a bit toppy to me. NDX pinged an ATH 3 times in the last day or two, and turned down each time, including “now”. RUT is showing similar weakness. So I took profits on my NDX and RUT sold put spreads, with a very real intention of selling them again fairly soon (Monday?) for higher prices. Or selling a bit lower spread for the same price (and less risk). But when I get sold spreads up to over 50% of max value, I just hate to see that value drop quickly, particularly while I’m in the “hot seat” (at risk of big losses should the market seriously tank).
Liking my decision more and more here!!….Peter S you got hot put cakes going up in value fast? I suspect you do.
Being out with a firm resolve to reenter long is effectively going short…every $ “saved” is a $ earned later!
Watching patiently …
I’m a bit suspicious this is setting up some significant selling over the weekend and into Monday and perhaps a bit beyond.
I’m not gonna get caught with another surprise to the upside … if we go down I’ll jump on the train Tuesday
Trader’s dilemma: is it rolling over, or is it a bull flag. Lol.
Nominally, yes.
But with RUT, NDX and SPX options expiring next Friday morning, if price moves up per Lara’s counts, a great opportunity to aggressively sell more premium underneath and cash in the “high decay” period of the final week on Monday!!! If price goes down, I’ve got >50% of what was my max profits in hand, and can wait for the next good floor to start up the same type of trades for next Friday or a month out depending on when a pivot low sets up.
Also this crossed my mind when I wanted to turn on the oven on ….
With the S&P now only 100 points away from the 3477.39 target, doesn’t it seem like cycle wave V will be hit sooner than 1-2 years?
I think that the count will end up a lot more bullish because 3477.39 won’t be the ultimate “top”.
As in the alternate monthlies.
I recently saw 3700 levels being mentioned. We shall see how this plays out but plenty to watch out for in the market.
Well, the Chinese gov’t isn’t overtly terminating citizens. But they are only a step or two down from that: they are aggressively rounding up anyone and everyone who is remotely sick (“haphazardly seizing patients who have not yet test positive for CV”), and putting them into conditions where they are exposed to the virus (if they in fact didn’t have it), are exposed to other infections that thrive in those conditions on already sick people, and get very poor to no medical care. Or they are locked up in places like hotel rooms, without any medical care. This per the front page article in the NYTimes today. The word that comes to mind is “barbaric”.
Kevin, it is far worse than that…you are STILL being too charitable, imho..
Lara the hourly chart shows the target as 5=3 not 5=1 as on the daily.
Oops!
Will fix. Thanks Peter.
Hello folks 🙂
Hello ari
Hi Ari. I’ll be back in Texas Feb 27th. Hopefully see you again there!
Oh heck yes!!! My sister and bro in law are also visiting that wknd. Looking forward to it Lara 🙂
Yay! I have a big celebration and will be booking dinner and drinks after…
I’m turning 50 next week. I’ve reached the half way mark! I consider it an achievement and so let the celebration begin!
Saturday 28th Feb. 6pm. Will whats app the location. All are welcome!