
All week upwards movement has been expected, which is exactly what has happened.
Price is closing in on the target zone of 2 points, which is calculated from a gap and using Fibonacci ratios in the Elliott wave structure.
Summary: The next target is now at 3,238 to 3,240, which now looks reasonable. About this target a fourth wave correction may begin which should last about two weeks or so and may end somewhere within the range of 3,154.26 to 3,070.49 (the upper edge of this range is preferred).
Thereafter, the next target is at 3,302 for a larger fourth wave correction and then 3,336 for an even larger fourth wave correction.
Three large pullbacks or consolidations (fourth waves) during the next 1-2 years are expected: for minor wave 4 (coming soon), then intermediate (4), and then primary 4. Some weakness prior to each of these corrections may be evident in technical analysis. Today there is no weakness, but conditions are becoming extreme. Extreme conditions warrant more careful attention to risk management at this time.
The biggest picture, Grand Super Cycle analysis, is here.
Monthly charts were last published here, with video here. There are two further alternate monthly charts here, with video here.
ELLIOTT WAVE COUNTS
The two weekly Elliott wave counts below will be labelled First and Second. They may be about of even probability. When the fifth wave currently unfolding on weekly charts may be complete, then these two wave counts will diverge on the severity of the expected following bear market. To see an illustration of this future divergence monthly charts should be viewed.
FIRST WAVE COUNT
WEEKLY CHART
Click chart to enlarge.
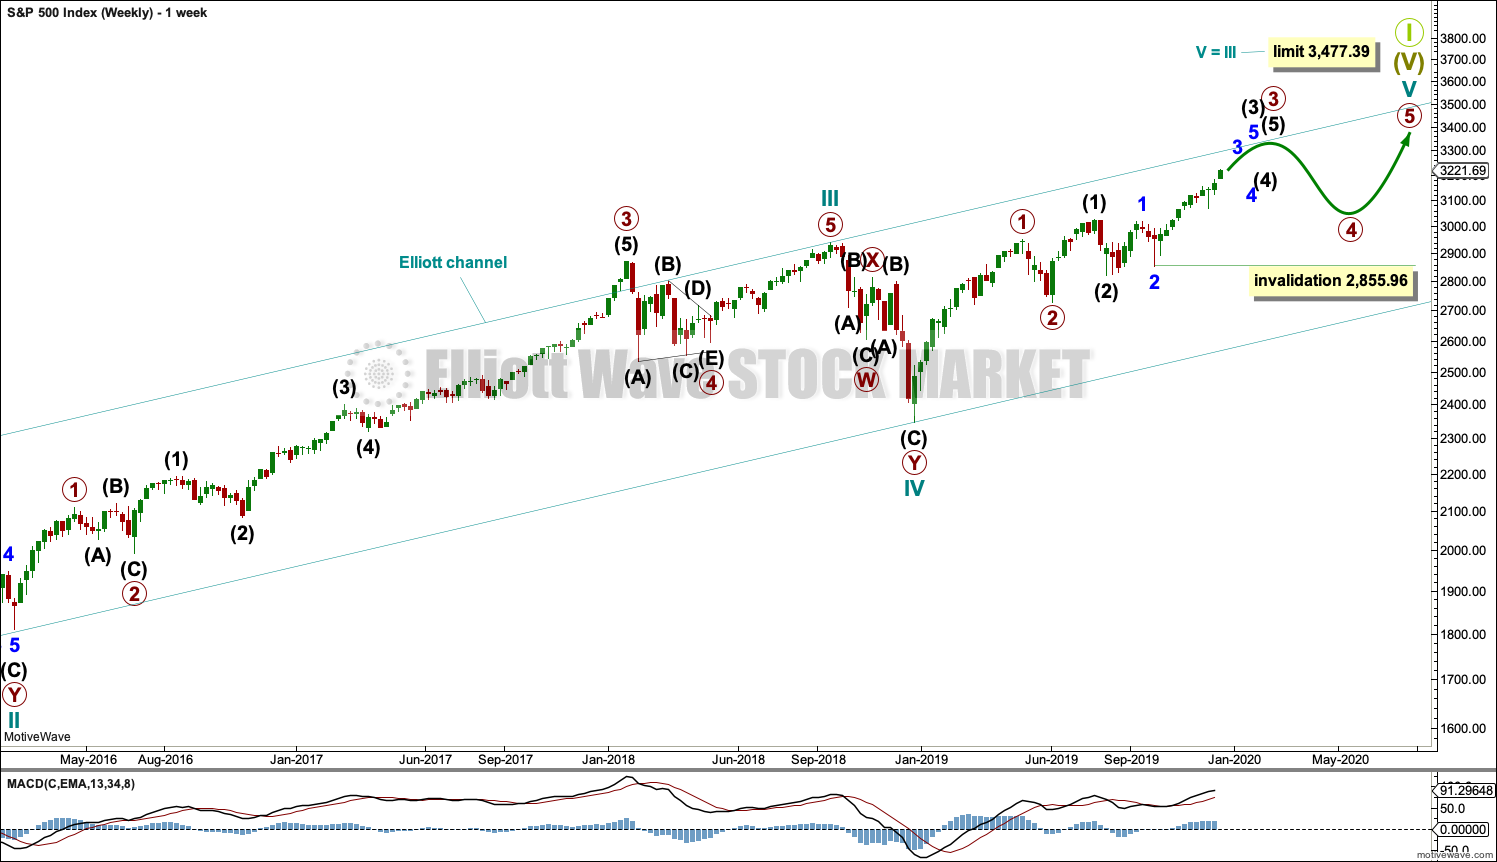
The basic Elliott wave structure consists of a five wave structure up followed by a three wave structure down (for a bull market). This wave count sees the bull market beginning in March 2009 as an incomplete five wave impulse and now within the last fifth wave, which is labelled cycle wave V. This impulse is best viewed on monthly charts. The weekly chart focusses on the end of it.
Elliott wave is fractal. This fifth wave labelled cycle wave V may end a larger fifth wave labelled Super Cycle wave (V), which may end a larger first wave labelled Grand Super Cycle wave I.
The teal Elliott channel is drawn using Elliott’s first technique about the impulse of Super Cycle wave (V). Draw the first trend line from the end of cycle wave I (off to the left of the chart, the weekly candlestick beginning 30th November 2014) to the end of cycle wave III, then place a parallel copy on the end of cycle wave II. This channel perfectly shows where cycle wave IV ended at support. The strongest portion of cycle wave III, the end of primary wave 3, overshoots the upper edge of the channel. This is a typical look for a third wave and suggests the channel is drawn correctly and the way the impulse is counted is correct.
Within Super Cycle wave (V), cycle wave III is shorter than cycle wave I. A core Elliott wave rule states that a third wave may never be the shortest. For this rule to be met in this instance, cycle wave V may not be longer in length than cycle wave III. This limit is at 3,477.39.
Cycle wave V may subdivide either as an impulse or an ending diagonal. Impulses are much more common. An alternative wave count which considered an ending diagonal has been invalidated. While it is possible a diagonal may become an alternate wave count in coming weeks or months, at this stage the structure does not fit.
At this stage, cycle wave V may take another one to two or so years to complete.
The daily chart below will focus on movement from the end of intermediate wave (2) within primary wave 3.
In historic analysis, two further monthly charts have been published that do not have a limit to upwards movement and are more bullish than this wave count. Members are encouraged to consider those possibilities (links below summary) alongside the wave counts presented on a daily and weekly basis. It is my judgement that the two weekly wave counts published in this analysis have the highest probability, so they shall be the only wave counts published on a daily basis.
Within cycle wave V, primary waves 1 and 2 may be complete. Within primary wave 3, intermediate waves (1) and (2) may be complete. Within the middle of intermediate wave (3), no second wave correction may move beyond its start below 2,855.96.
DAILY CHART
Click chart to enlarge.
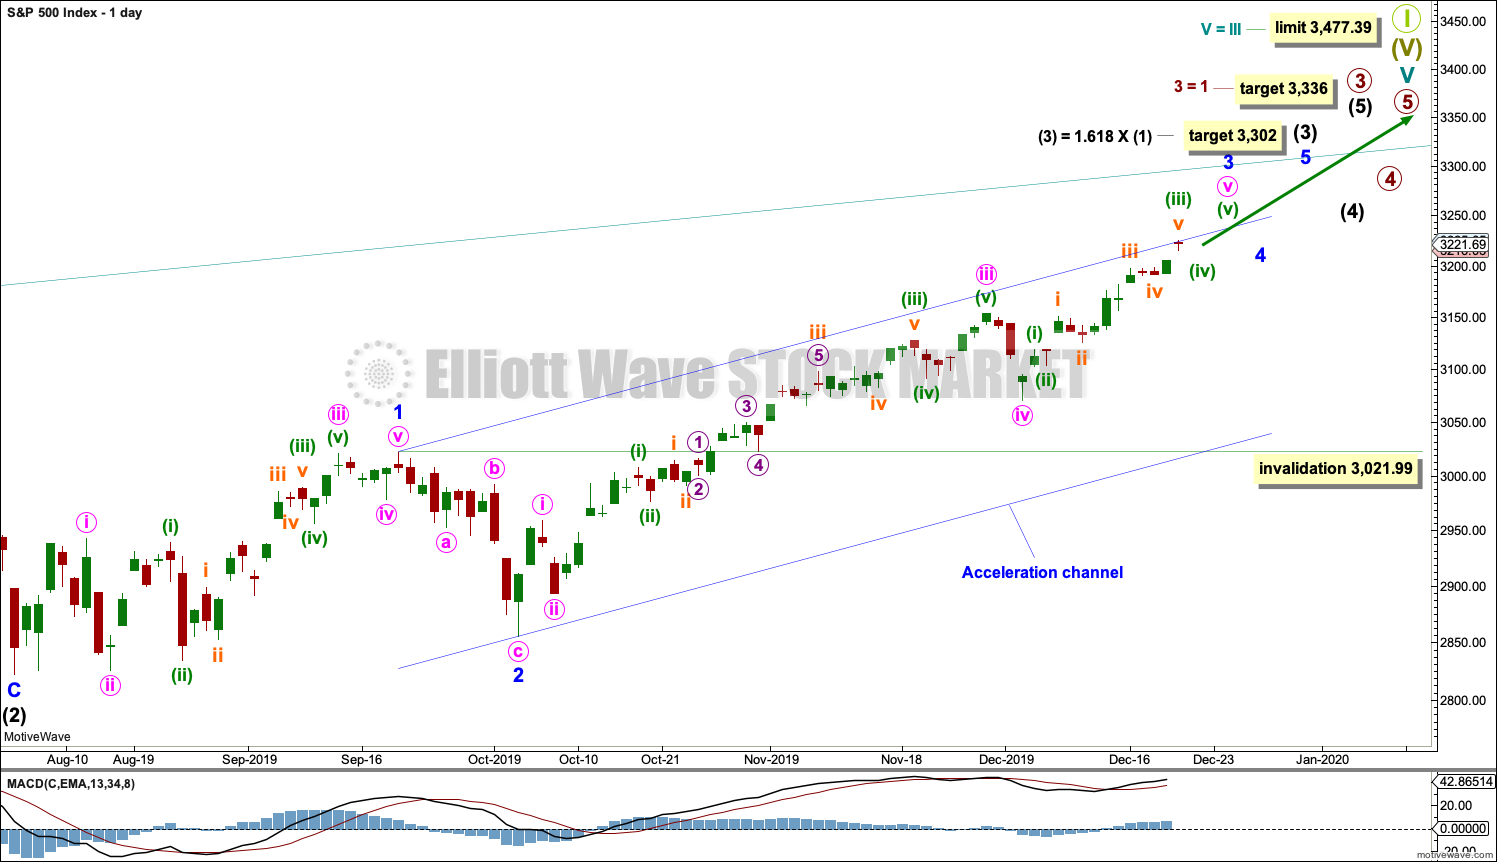
All of primary wave 3, intermediate wave (3) and minor wave 3 may only subdivide as impulses.
Minor wave 3 has passed 1.618 the length of minor wave 1, and within it minute wave v has passed equality in length with minute wave i. The next target may be about 3,238 where minute wave v would reach 1.618 the length of minute wave i.
At this stage, the structure of minute wave v within minor wave 3 may be very close to completion.
Minor wave 2 was a sharp deep pullback, so minor wave 4 may be expected to be a very shallow sideways consolidation to exhibit alternation. Minor wave 2 lasted 2 weeks. Minor wave 4 may be about the same duration, or it may be a longer lasting consolidation. Minor wave 4 may end within the price territory of the fourth wave of one lesser degree; minute wave iv has its range from 3,154.26 to 3,070.49.
Minor wave 4 may not move into minor wave 1 price territory below 3,021.99.
Intermediate wave (3) must move far enough above the end of intermediate wave (1) to then allow intermediate wave (4) to unfold and remain above intermediate wave (1) price territory. Intermediate wave (3) has now moved beyond the end of intermediate wave (1), meeting a core Elliott wave rule, and it has moved high enough now to give room for intermediate wave (4).
The target for intermediate wave (3) fits with a target calculated for minor wave 3.
Draw an acceleration channel now about intermediate wave (3): draw the first trend line from the end of minor wave 1 to the last high, then place a parallel copy on the end of minor wave 2. Keep redrawing the channel as price continues higher. When minor wave 3 is complete, then this channel would be an Elliott channel and may show where minor wave 4 may find support if it is long lasting or deep enough.
HOURLY CHART
Click chart to enlarge.
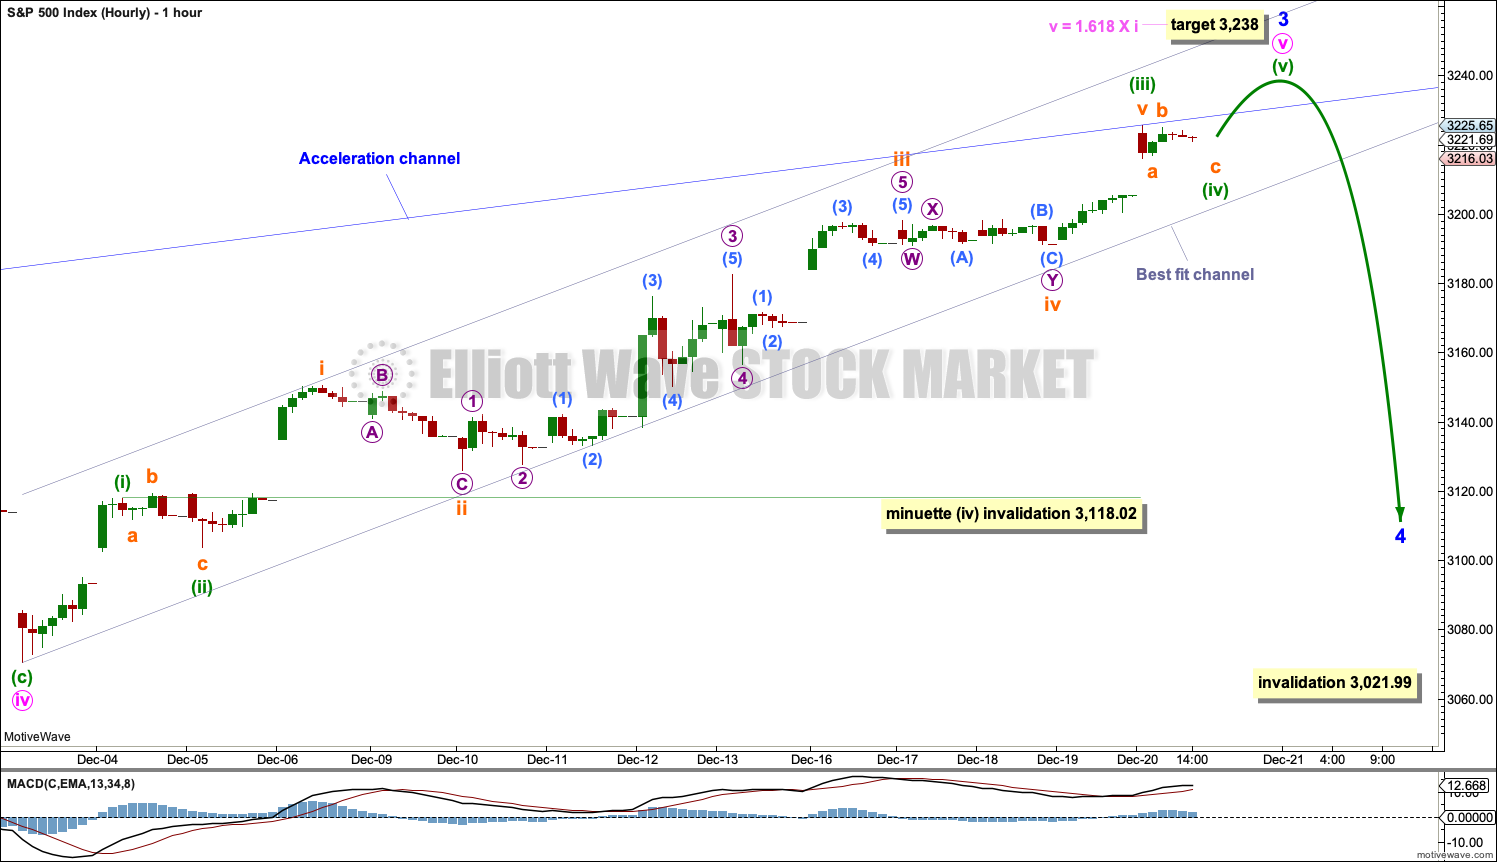
The hourly chart will now focus on minute wave v.
Minute wave v is subdividing as an impulse. The structure may now be very close to completion.
Minuette wave (iv) may not move into minuette wave (i) price territory below 3,118.02. Minuette wave (iv) may end on Monday with a very slight new low below the low of subminuette wave a within it at 3,216.87, so that subminuette wave c avoids a truncation. Thereafter, new highs may follow.
Draw a best fit channel about minute wave v. Expect support and resistance using this channel. If the channel is breached by downwards movement, then that may be an indication that minute wave v is over and minor wave 4 may have arrived.
SECOND WAVE COUNT
WEEKLY CHART
Click chart to enlarge.
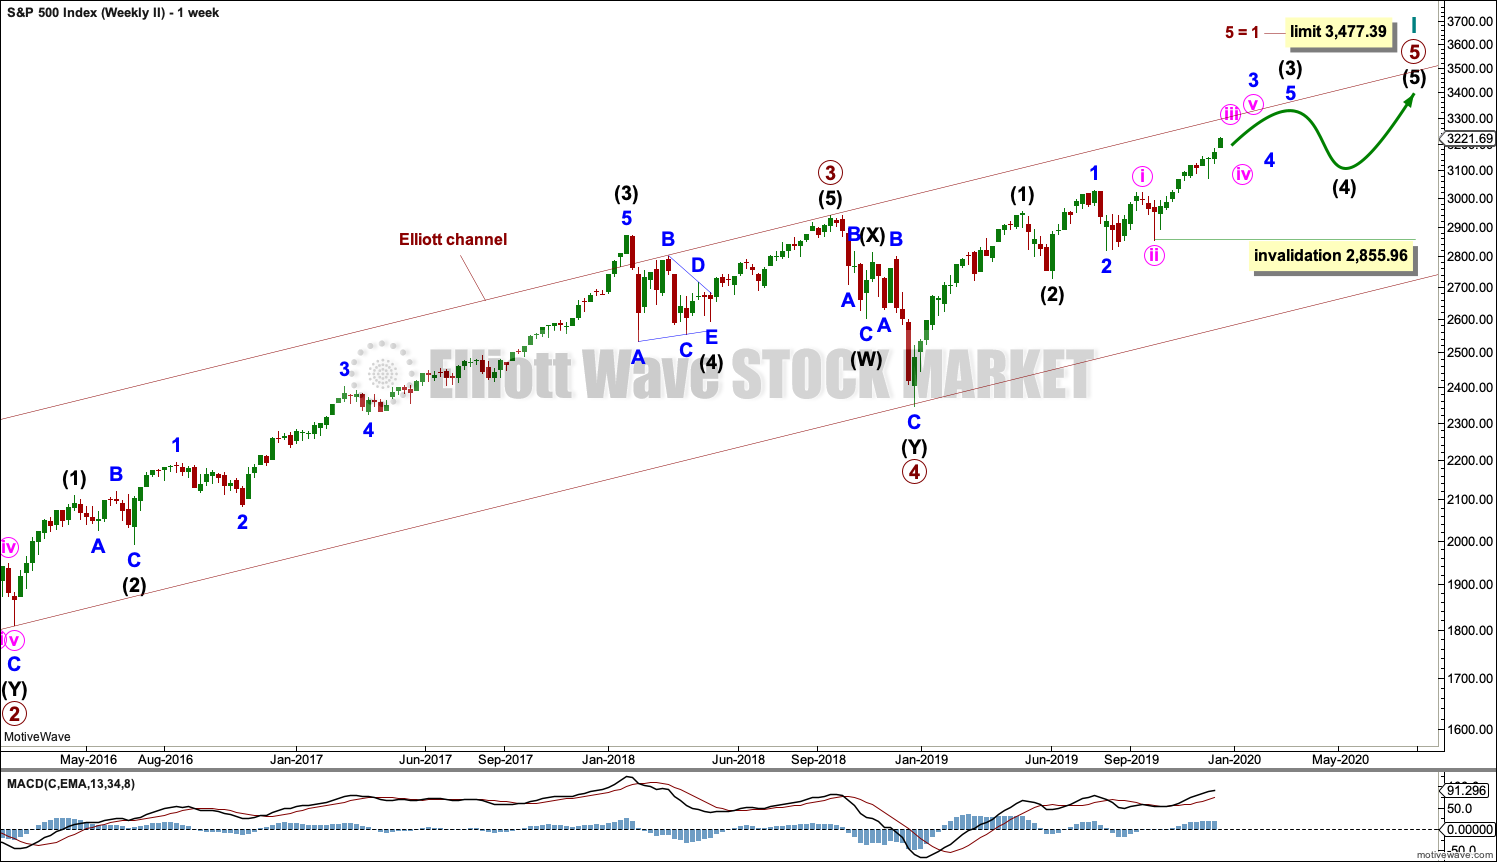
This weekly chart is almost identical to the first weekly chart, with the sole exception being the degree of labelling.
This weekly chart moves the degree of labelling for the impulse beginning in March 2009 all down one degree. This difference is best viewed on monthly charts.
The impulse is still viewed as nearing an end; a fifth wave is still seen as needing to complete higher. This wave count labels it primary wave 5. Primary wave 5 may still need another year to two or so to complete, depending upon how time consuming the corrections within it may be.
Primary wave 5 may be subdividing as an impulse, in the same way that cycle wave V is seen for the first weekly chart.
TECHNICAL ANALYSIS
MONTHLY CHART
Click chart to enlarge. Chart courtesy of StockCharts.com.
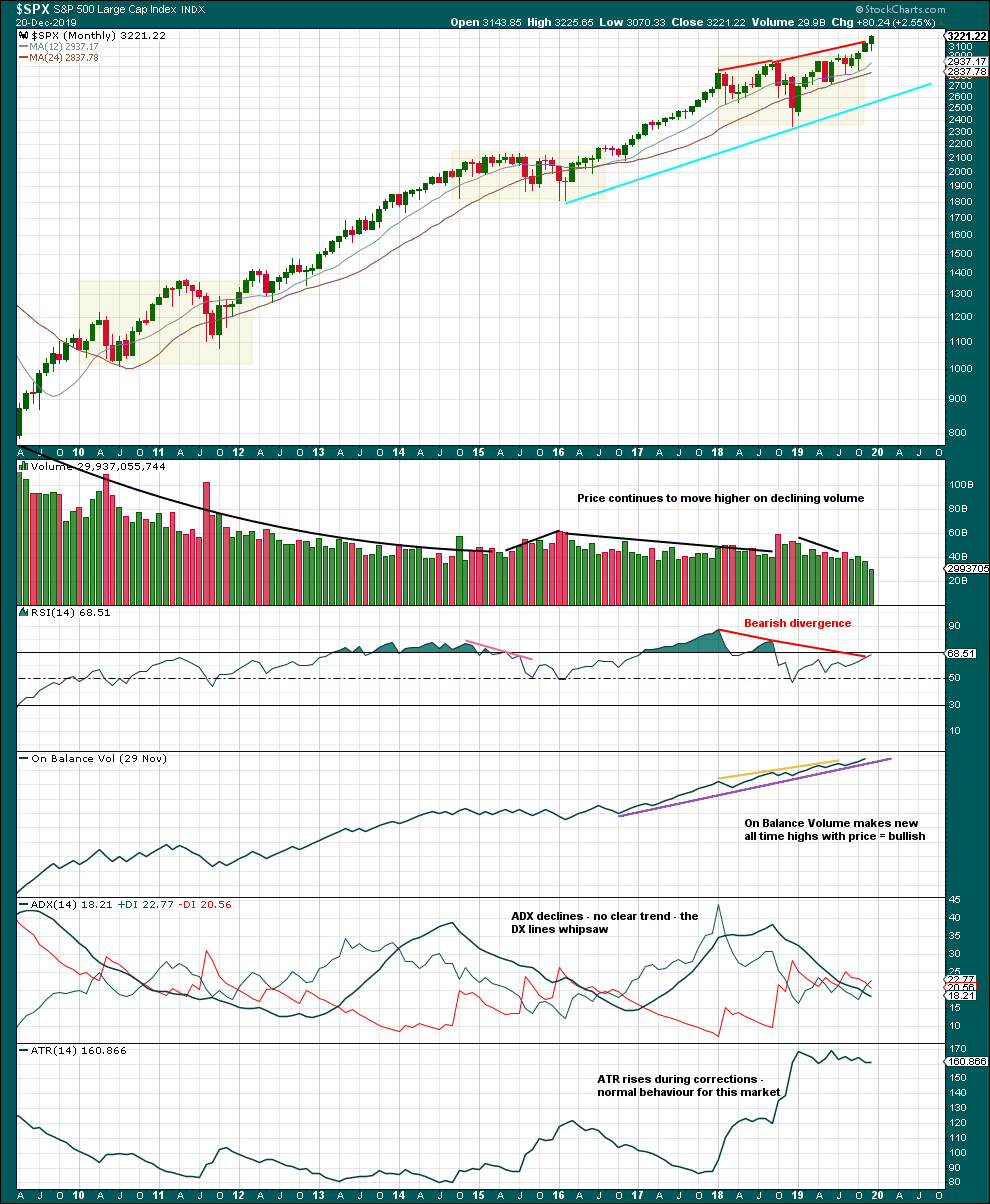
There are three large consolidations noted on this chart, in shaded areas. After a breakout from a multi-month consolidation, it is reasonable to expect a multi month bullish move may result.
This chart very clearly exhibits rising price on declining volume has now persisted for several years. A decline in volume last month, in current market conditions, is not of concern.
On Balance Volume supports the Elliott wave count.
WEEKLY CHART
Click chart to enlarge. Chart courtesy of StockCharts.com.
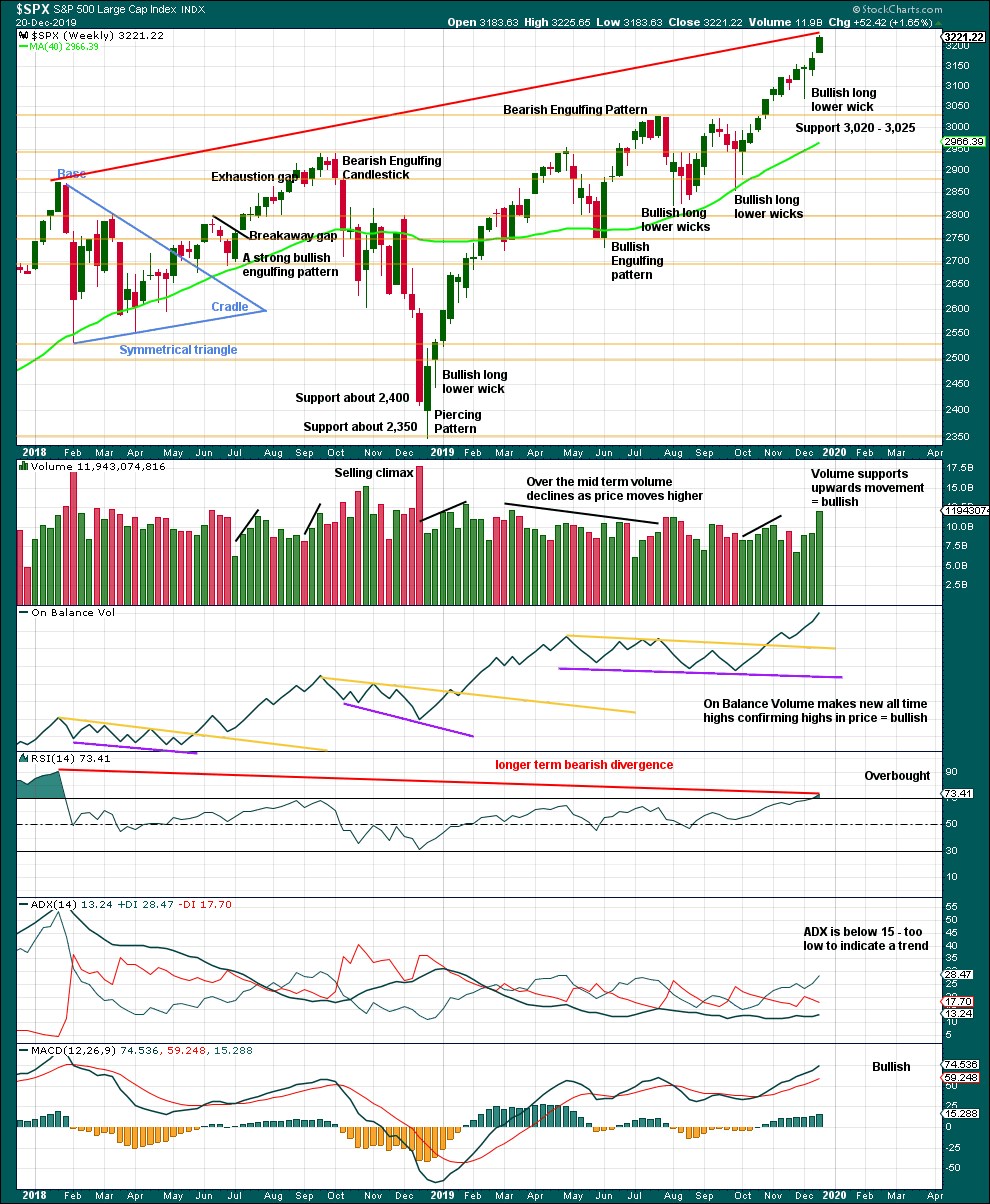
It is very clear that the S&P is in an upwards trend and the bull market is continuing. Price does not move in straight lines; there will be pullbacks and consolidations along the way.
This chart is overall bullish. There are no signs of weakness in upwards movement.
This week RSI reaches into overbought. That does not mean upwards movement must end here, because it can continue for several weeks while RSI reaches more extreme. RSI reaching into overbought is a warning that conditions are now becoming extreme. A pullback or consolidation will follow and the longer conditions are extreme the closer this will be. However, assume the trend remains the same until proven otherwise. This warning should be heeded by careful attention to risk management.
DAILY CHART
Click chart to enlarge. Chart courtesy of StockCharts.com.
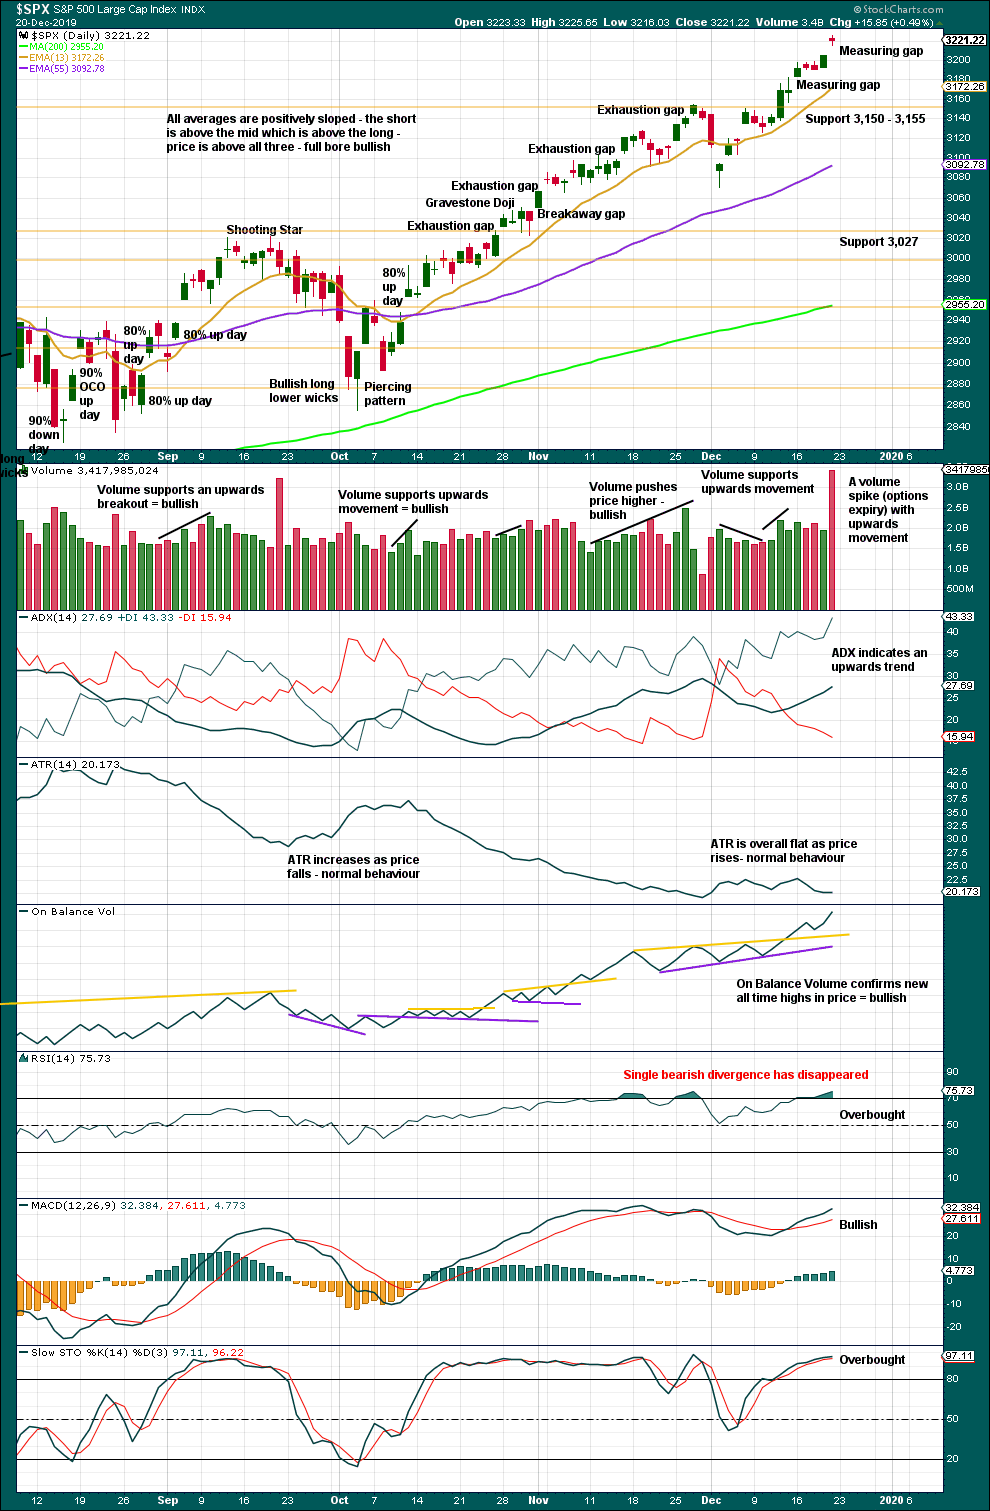
There is an upwards trend in place. There will be corrections along the way.
Like the weekly chart, this chart is bullish. Divergence between price and RSI has now disappeared. This chart at the end of this week is now more bullish.
With RSI overbought at both daily and weekly time frames, members are advised to pay careful attention to risk management. A larger pullback or consolidation will come to relieve extreme conditions. A bearish signal in the form of a candlestick reversal pattern, a 90% downwards day, strong bearish divergence in On Balance Volume or the AD line, or a combination of these signals, will be looked for. No bearish reversal signs are evident this week.
There is still room for this upwards trend to continue.
The measuring gap at 3,240 remains valid. Now another gap gives a second target at 3,230.
When this market trends, Stochastics may remain overbought for a very long time. Stochastics should be used to identify swings within a consolidation and not extremes of bull and bear trends.
BREADTH – AD LINE
WEEKLY CHART
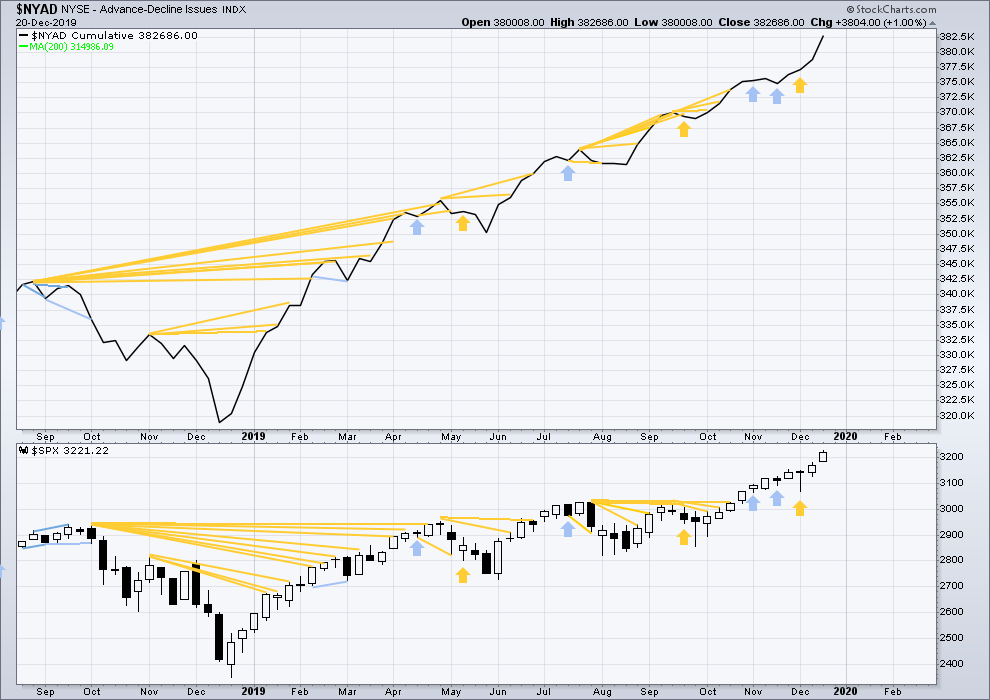
Click chart to enlarge. Chart courtesy of StockCharts.com. So that colour blind members are included, bearish signals
will be noted with blue and bullish signals with yellow.
Bear markets from the Great Depression and onwards have been preceded by an average minimum of 4 months divergence between price and the AD line with only two exceptions in 1946 and 1976. With the AD line making new all time highs last week, the end of this bull market and the start of a new bear market is very likely a minimum of 4 months away, which is mid March 2020.
In all bear markets in the last 90 years there is some positive correlation (0.6022) between the length of bearish divergence and the depth of the following bear market. No to little divergence is correlated with more shallow bear markets. Longer divergence is correlated with deeper bear markets.
If a bear market does develop here, it comes after no bearish divergence. It would therefore more likely be shallow.
All of small, mid and large caps have made new swing highs above the prior swing high on the 13th of September, and this week mid caps have now made new all time highs. This upwards movement appears to be mostly driven by large caps, which is a feature of aged bull markets. This bull market at over 10 years duration certainly fits the definition of aged.
Again both price and the AD line have made new all time highs. There is no divergence. Upwards movement has support from rising market breadth.
Large caps all time high: 3,225.54 on 20th December 2019.
Mid caps all time high: 2,069.95 on 20th December 2019.
Small caps all time high: 1,100.58 on 27th August 2018.
DAILY CHART
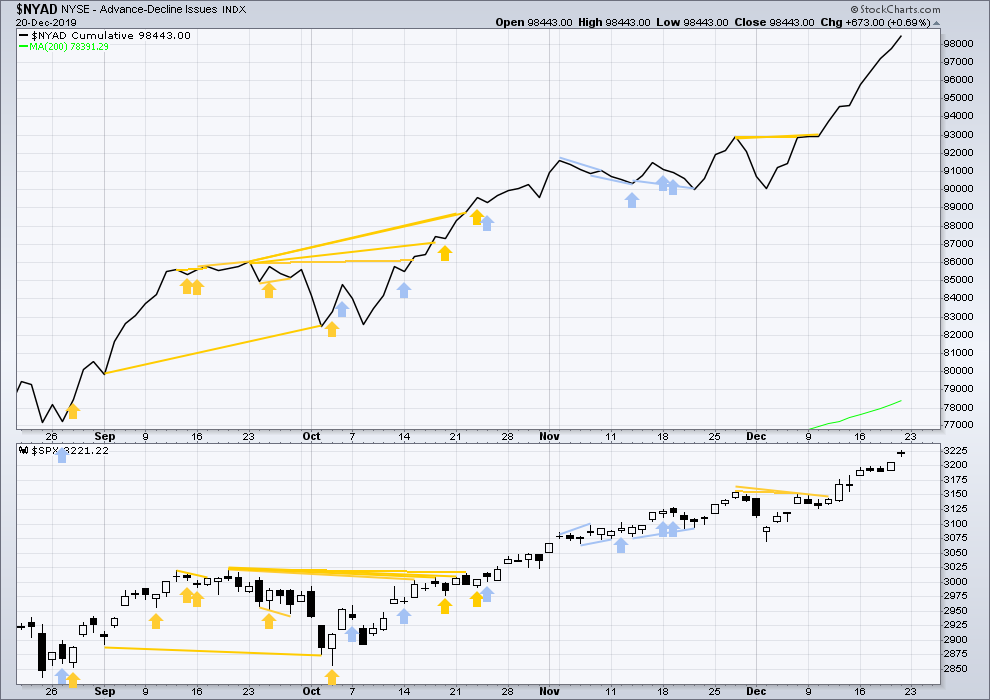
Click chart to enlarge. Chart courtesy of StockCharts.com. So that colour blind members are included, bearish signals
will be noted with blue and bullish signals with yellow.
Breadth should be read as a leading indicator.
On Friday price has moved higher but failed by a very small margin to make a new all time high. The AD line has moved higher to make a new all time high but only by a very small margin. This divergence is bullish, but it is weak.
Again again both price and the AD line have made new all time highs. Upwards movement has support from rising market breadth. This is bullish.
VOLATILITY – INVERTED VIX CHART
WEEKLY CHART
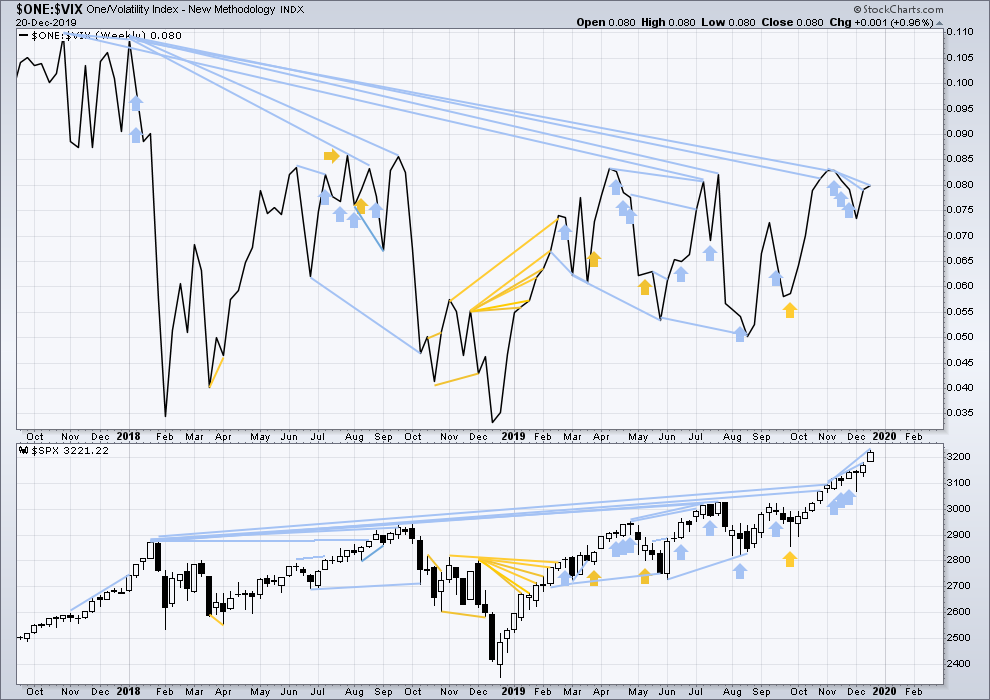
Click chart to enlarge. Chart courtesy of StockCharts.com. So that colour blind members are included, bearish signals
will be noted with blue and bullish signals with yellow.
The all time high for inverted VIX was on 30th October 2017. There is now over two years of bearish divergence between price and inverted VIX.
The rise in price is not coming with a normal corresponding decline in VIX; VIX remains elevated. This long-term divergence is bearish and may yet develop further as the bull market matures.
This divergence may be an early warning, a part of the process of a top developing that may take years. It may is clearly not useful in timing a trend change from bull to a fully fledged bear market.
This week price makes new highs, but inverted VIX does not. There is now short, mid and long-term bearish divergence between price and inverted VIX.
DAILY CHART
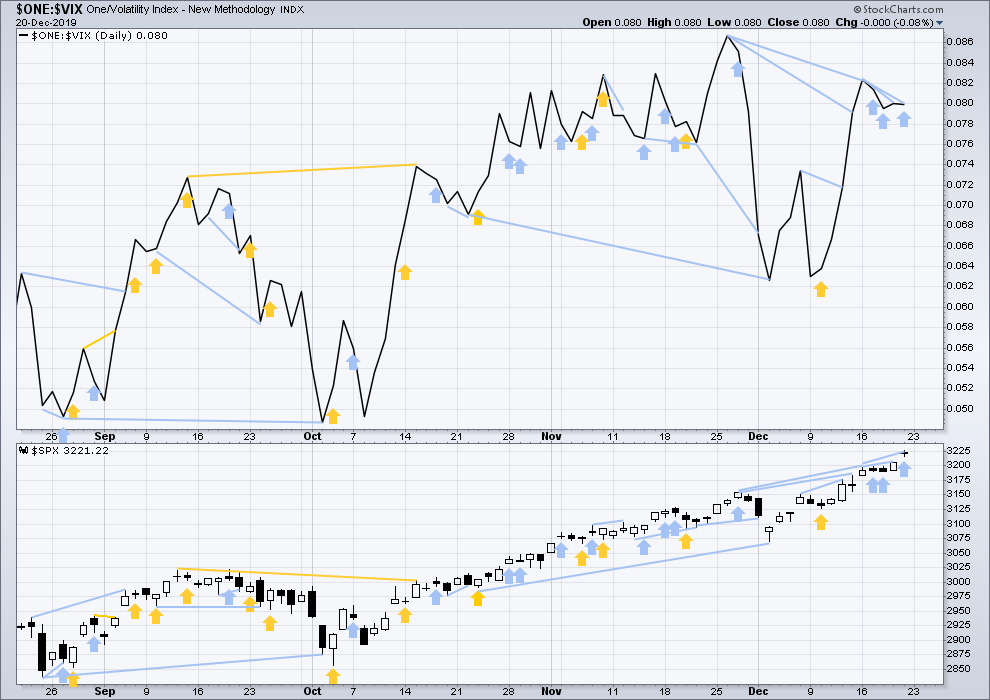
Click chart to enlarge. Chart courtesy of StockCharts.com. So that colour blind members are included, bearish signals
will be noted with blue and bullish signals with yellow.
On Friday price moved higher, but inverted VIX has remained essentially flat. There is no single day, short, mid and long-term bearish divergence between price and VIX. This is taken as an early warning in this analysis of a deeper pullback or longer lasting consolidation to come, but it is not useful as a timing tool at this stage.
DOW THEORY
Dow Theory confirmed a bear market in December 2018. This does not necessarily mean a bear market at Grand Super Cycle degree though; Dow Theory makes no comment on Elliott wave counts. On the 25th of August 2015 Dow Theory also confirmed a bear market. The Elliott wave count sees that as part of cycle wave II. After Dow Theory confirmation of a bear market in August 2015, price went on to make new all time highs and the bull market continued.
DJIA: 23,344.52 – a close on the 19th of December at 23,284.97 confirms a bear market.
DJT: 9,806.79 – price has closed below this point on the 13th of December.
S&P500: 2,532.69 – a close on the 19th of December at 2,506.96 provides support to a bear market conclusion.
Nasdaq: 6,630.67 – a close on the 19th of December at 6,618.86 provides support to a bear market conclusion.
With all the indices having moved higher following a Dow Theory bear market confirmation, Dow Theory would confirm a bull market if the following highs are made:
DJIA: 26,951.81 – a close above this point has been made on the 3rd of July 2019.
DJT: 11,623.58 – to date DJT has failed to confirm an ongoing bull market.
S&P500: 2,940.91 – a close above this point was made on the 29th of April 2019.
Nasdaq: 8,133.30 – a close above this point was made on the 26th of April 2019.
Published @ 09:26 p.m. EST.
—
Careful risk management protects your trading account(s).
Follow my two Golden Rules:
1. Always trade with stops.
2. Risk only 1-5% of equity on any one trade.
—
New updates to this analysis are in bold.
SPX is close to a key 127.2% extension (3240.5) and a Fibonacci fitted projection (3233). The last lower such projection didn’t turn the market…but it did identify exactly where price “flat lined” for many days. We’ll see what this one does. This market should be very, very close to pivoting…
Kevin,
Here’s my latest RUT count, which sync best with the SPX minor 4 completing.
If you are trying to model something in RUT that will start a minor 4 around the same time SPX is starting a minor 4, I don’t think this does that. Seems like this indicates a fair amount more “up” (a few weeks worth?) is due before a minor 4 starts, but in SPX we appear to be just a few days away. Your count here is extremely bullish, showing only a minute i complete and a minuette i of a minute iii complete. And that has taken about a month. Implying perhaps a month or more until the minor 3 completes. The SPX minor 4 may have come and gone by then.
Perhaps best to just define what would constitute strong indicators of a pivot high and a shift to a down swing, and monitor for that. Ideally coordinated indicators in multiple major markets. Low degree EW counts are really tricky and subject to lots of surprises. I am waiting for the market to inform me directly.
Kevin,
No, I am not trying to model the minor 4 in RUT.
Based on the above count, it will complete subminutte wave 1 of minor 3 in few hours. So there’s room for it to correct in subminutte 2 (with SPX in minor 4) but need to remain above 1589.7 (start of subminutte 1)
Then it should start a wave 3 of multiple degrees.
Yes this count is very bullish, ultimately taking RUT to above 2k next year and based on that RUT should outperform next year.
Awesome. I love trading RUT!! I have a large-ish bull put spread on RUT now for Jan 17 expiry, 1590/1570. I think that “safe”, but ya never know!!! If your count is accurate, I have no worries. As a matter of fact I added a bit to that position this morning.
Here’s my view of RUT. Getting close (but still a few days away) to completing this minor 3, in concert with SPX, and initiating a minor 4. Need a minuette iv and minuette v to complete the minute v of the minor 3. I’ll be shorting when the minor 4 starts and confirms (and holding my deep out of the money long too).
The weekend is worth 5 points. First!!!
Five points? Naw…I’ll take two of those!
Last analysis before Christmas is worth 20 points.
Coming soon…