
Upwards movement continues as expected.
A new Elliott wave count at the monthly chart level is presented.
Summary: The upwards trend remains intact and there is underlying strength in this market still. The next mid-term target is at 3,010. However, some near-term caution may be warranted due to strong resistance and now a cluster of bearish signals from VIX.
The final target remains the same at 3,045. Alternate monthly wave counts allow for a target as high as 4,119.
New updates to this analysis are in bold.
The biggest picture, Grand Super Cycle analysis, is here.
Monthly charts are again reviewed this week, and a new idea is presented. Two alternate monthly charts remain here, with video here.
ELLIOTT WAVE COUNTS
The two Elliott wave counts below will be labelled First and Second rather than main and alternate as they may be about of even probability. When the current impulse of primary wave 5 (second wave count) or cycle wave V (first wave count) may be complete, then these two wave counts will diverge on the severity of the expected following bear market.
FIRST WAVE COUNT
MONTHLY CHART
Click chart to enlarge.
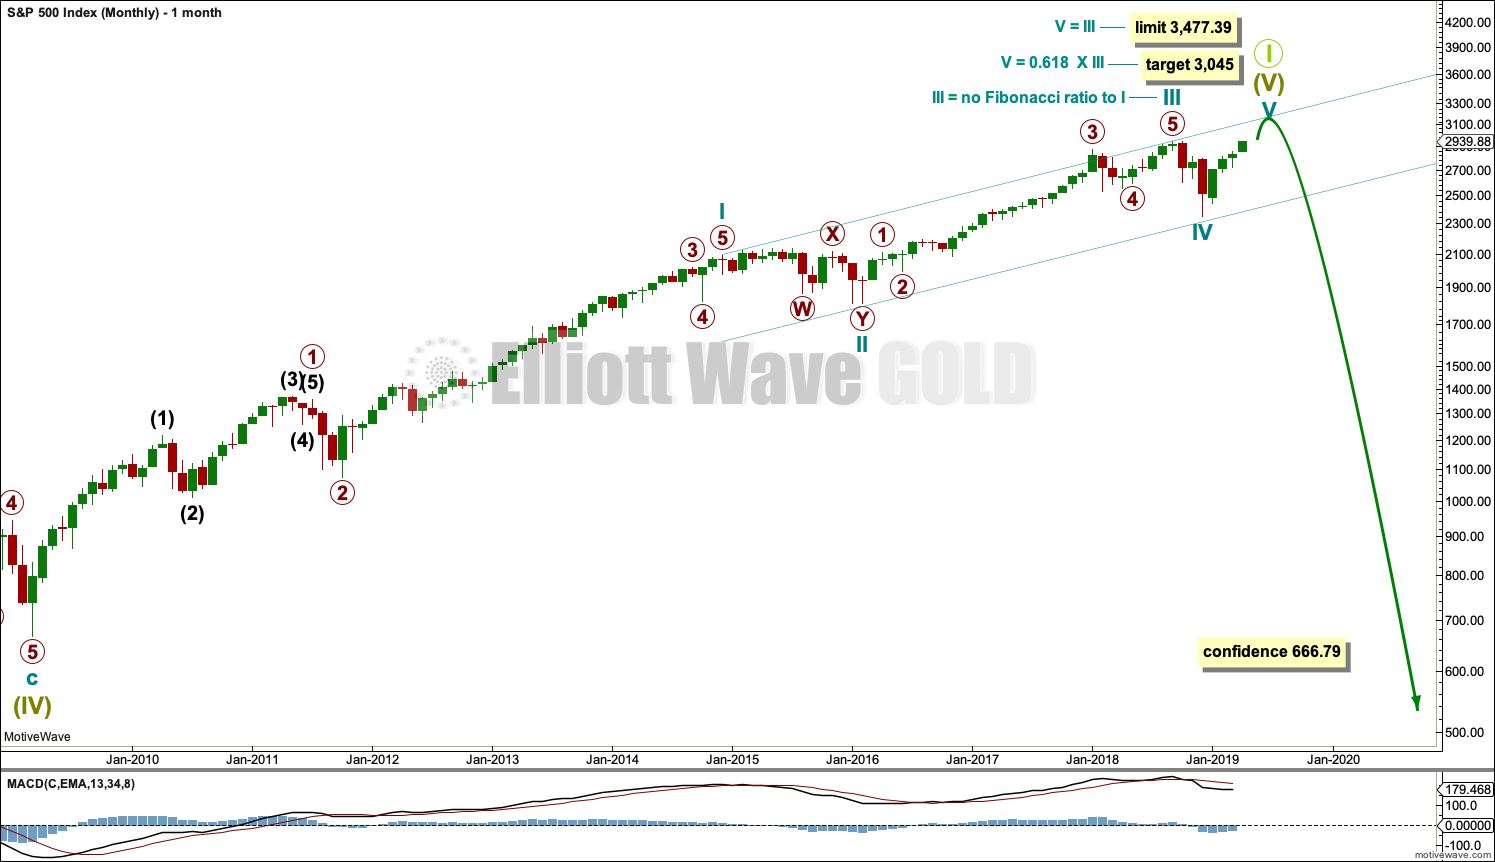
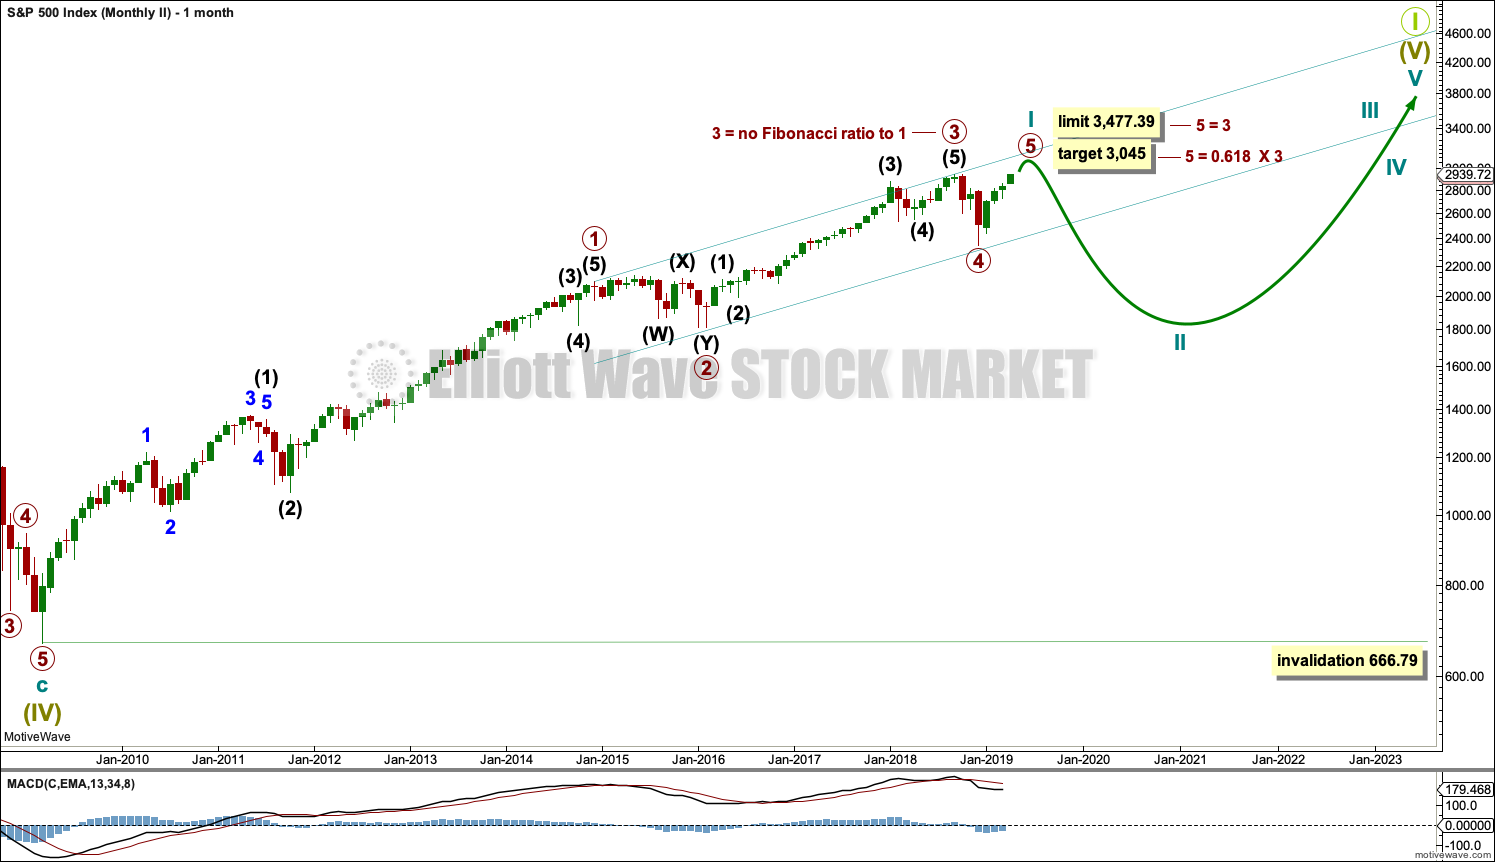
Super Cycle wave (IV) completed a 8.5 year correction. Thereafter, a bull market began for Super Cycle wave (V). The structure of Super Cycle wave (V) is incomplete. It is subdividing as an impulse.
There is no Fibonacci ratio between cycle waves I and III within Super Cycle wave (V). Cycle wave V will be limited to no longer than equality with cycle wave III, so that cycle wave III is not the shortest actionary wave.
A channel is drawn about the impulse of Super Cycle wave (V) using Elliott’s first technique. Cycle wave IV found support about the lower edge.
There is perfect alternation between a shallow time consuming combination for cycle wave II and now a deeper and more brief double zigzag for cycle wave IV. The speed and depth of cycle wave IV makes these two corrections look like they should be labelled the same degree. This wave count has the right look.
The middle of the third wave overshoots the upper edge of the Elliott channel drawn about this impulse. All remaining movement is contained within the channel. This has a typical look.
Within cycle wave V, no second wave correction may move beyond the start of its first wave below 2,346.58.
This wave count expects MACD to begin to exhibit divergence with price as price makes new highs. Cycle wave III may exhibit strongest momentum and cycle wave V may exhibit some weakness. If price makes new highs but MACD does not, then this would remain the main wave count.
Within Super Cycle wave (V), cycle wave III may not be the shortest actionary wave. Because cycle wave III is shorter than cycle wave I, this limits cycle wave V to no longer than equality in length with cycle wave III at 3,477.39. A target is calculated for cycle wave V to end prior to this point.
This wave count agrees with MACD. Cycle wave III exhibits strongest momentum, and primary wave 3 within cycle wave III exhibits the strongest histogram within MACD.
This wave count expects that when cycle wave V completes Super Cycle wave (V) and Grand Super Cycle wave I, that a huge bear market to potentially last decades may begin. It should move substantially below 666.79.
WEEKLY CHART
Click chart to enlarge.
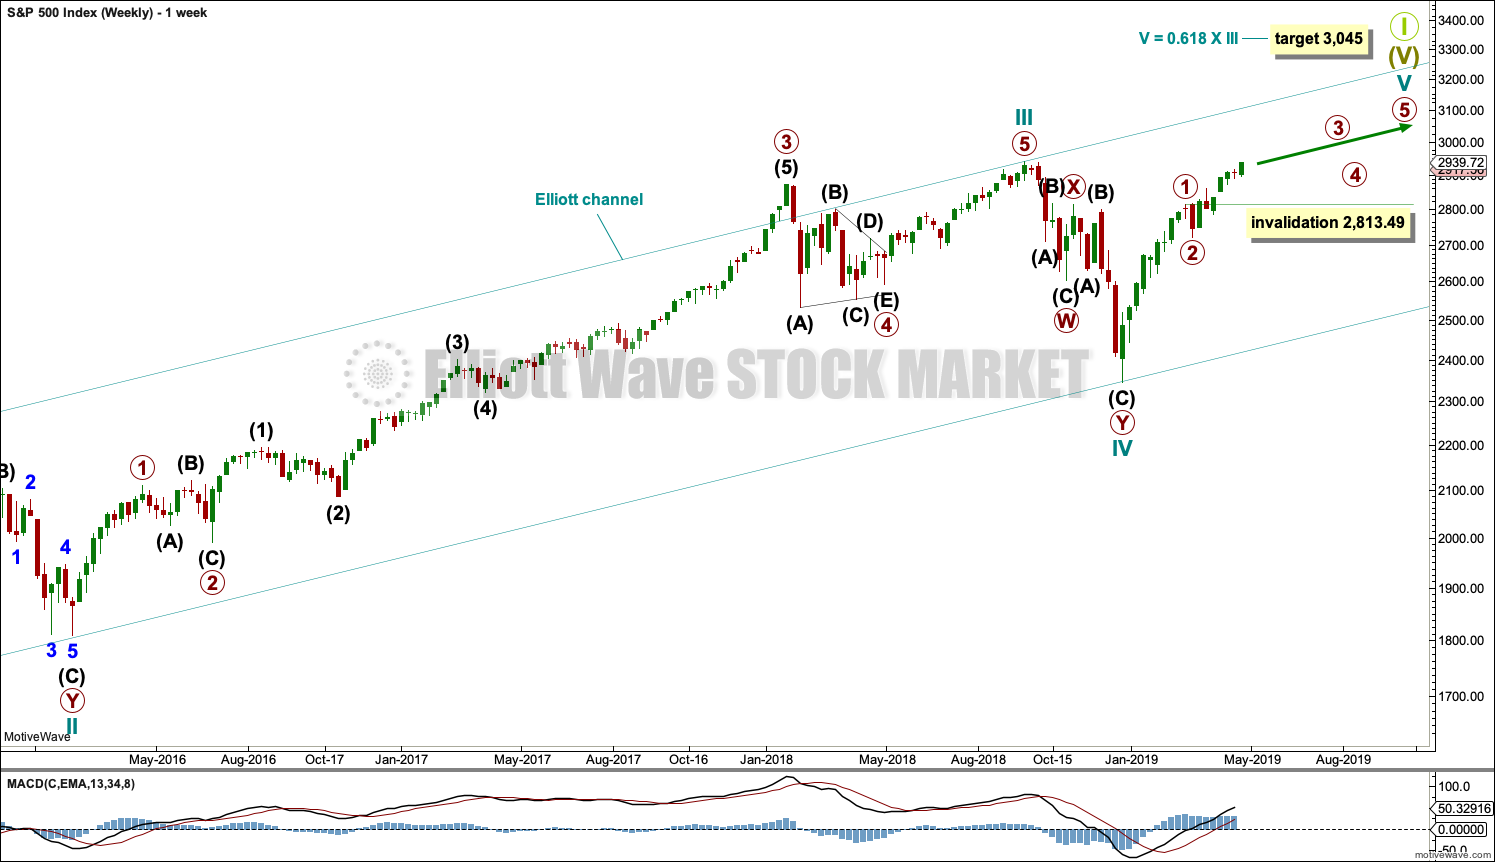
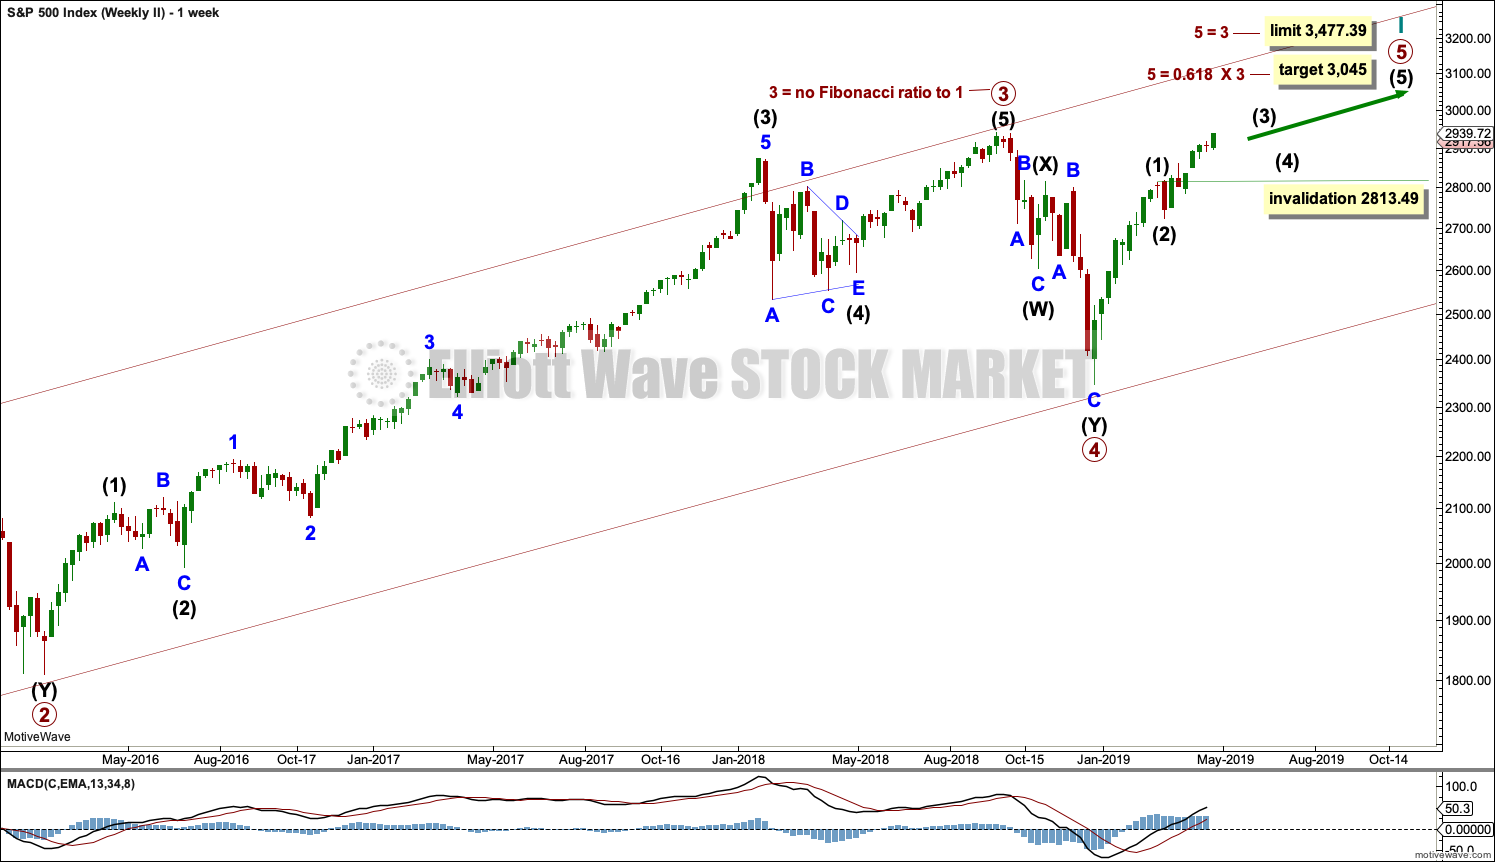
This weekly chart shows all of cycle waves III, IV and V so far.
Cycle wave II fits as a time consuming double combination: flat – X – zigzag. Combinations tend to be more time consuming corrective structures than zigzags. Cycle wave IV has completed as a multiple zigzag that should be expected to be more brief than cycle wave II.
Cycle wave IV may have ended at the lower edge of the Elliott channel.
Within cycle wave V, primary waves 1 and 2 may now be complete. Primary wave 3 has moved above the end of primary wave 1. When it arrives, primary wave 4 may not move into primary wave 1 price territory below 2,813.49.
Although both cycle waves II and IV are labelled W-X-Y, they are different corrective structures. There are two broad groups of Elliott wave corrective structures: the zigzag family, which are sharp corrections, and all the rest, which are sideways corrections. Multiple zigzags belong to the zigzag family and combinations belong to the sideways family. There is perfect alternation between the possible double zigzag of cycle wave IV and the combination of cycle wave II.
Although there is gross disproportion between the duration of cycle waves II and IV, the size of cycle wave IV in terms of price makes these two corrections look like they should be labelled at the same degree. Proportion is a function of either or both of price and time.
Draw the Elliott channel about Super Cycle wave (V) with the first trend line from the end of cycle wave I (at 2,079.46 on the week beginning 30th November 2014) to the high of cycle wave III, then place a parallel copy on the low of cycle wave II. Cycle wave V may find resistance about the upper edge.
It is possible that cycle wave V may end in October 2019. If it does not end there, or if the AD line makes new all time highs during or after June 2019, then the expectation for cycle wave V to end would be pushed out to March 2020 as the next possibility. Thereafter, the next possibility may be October 2020. March and October are considered as likely months for a bull market to end as in the past they have been popular. That does not mean though that this bull market may not end during any other month.
DAILY CHART
Click chart to enlarge.
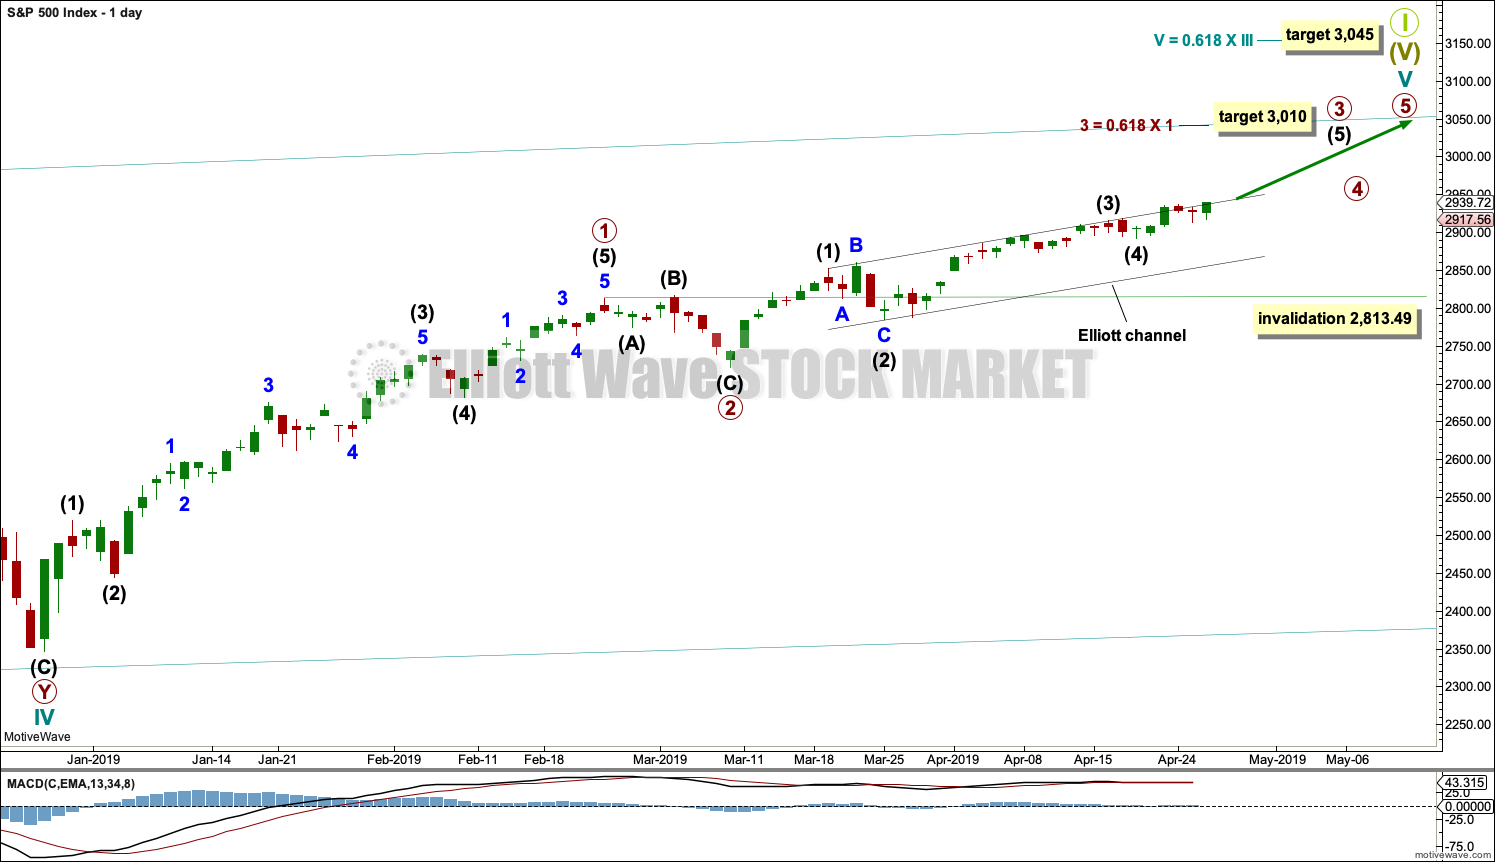
The daily chart will focus on the structure of cycle wave V.
Cycle wave V must subdivide as a five wave motive structure, either an impulse or an ending diagonal. An impulse is much more common and that will be how it is labelled. A diagonal would be considered if overlapping suggests it.
Primary wave 1 may have been a long extension, a smaller fractal of cycle wave I on the monthly chart.
Primary wave 2 may have been a very brief and shallow expanded flat correction.
Within primary wave 3, intermediate waves (1) through to (4) may be complete. Intermediate wave (5) to end primary wave 3 may end soon or may yet continue to extend. When it is complete, then primary wave 3 may be complete.
Primary wave 4 may not move into primary wave 1 price territory below 2,813.49.
HOURLY CHART
Click chart to enlarge.
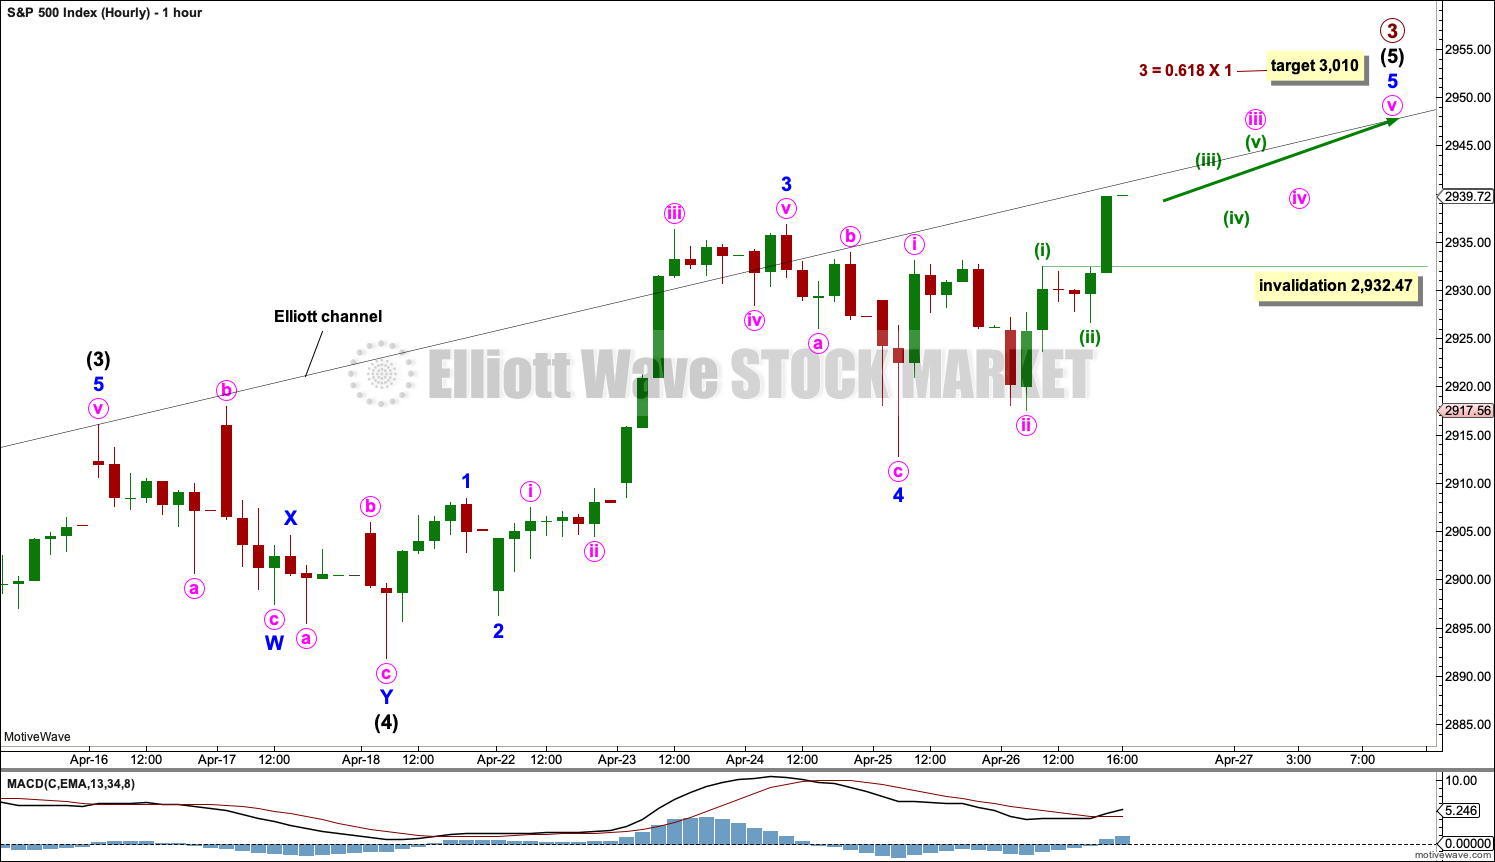
Intermediate wave (5) may be unfolding as an impulse, which is the most common structure for a fifth wave.
It is also possible to move the degree of labelling within intermediate wave (5) all down one degree. It is possible that only minor wave 1 within intermediate wave (5) is near an end.
However, the strength of upwards movement that overshot the upper edge of the black Elliott channel looks very much like a third wave, so this labelling looks most likely.
So far minor waves 1 through to 4 within intermediate wave (5) may all be complete. Minor wave 3 is just 2.7 points short of 2.618 the length of minor wave 1. With a Fibonacci ratio already between two of the three actionary waves within intermediate wave (5), minor wave 5 may not exhibit a Fibonacci ratio to either of minor waves 1 or 3. The target calculation will be left at primary degree.
Minor wave 5 may be an extension. So far minute wave ii within minor wave 5 shows up clearly on the hourly chart, suggesting a more time consuming impulse for minor wave 5.
Upwards movement at the end of the week may have been the middle of a small third wave as the middle of minor wave 5 unfolded. Within the impulse of minute wave iii, minuette wave (iv) may not move into minuette wave (i) price territory below 2,932.47.
When minute wave iii may be complete, then the invalidation point must move down to the high labelled minute wave i at 2,933.10. The correction for minute wave iv may not move into minute wave i price territory.
SECOND WAVE COUNT
MONTHLY CHART
Click chart to enlarge.
This monthly chart sees all subdivisions from the end of the March 2009 low in almost the same way, with the sole difference being the degree of labelling.
If the degree of labelling for the entirety of this bull market is all moved down one degree, then only a first wave at cycle degree may be nearing an end.
When cycle wave I is complete, then cycle wave II should meet the technical definition of a bear market as it should retrace more than 20% of cycle wave I, but it may end about either the 0.382 or 0.618 Fibonacci Ratios of cycle wave I. Cycle wave II may end close to the low of primary wave II within cycle wave I, which is at 1,810.10.
Thereafter, a new bull market for cycle wave III may begin. It should have support from volume and fundamentals.
The end of Grand Super Cycle wave I may be about 10 years or so away.
WEEKLY CHART
Click chart to enlarge.
This weekly chart is identical to the first weekly chart, with the sole difference being the degree of labelling.
TECHNICAL ANALYSIS
MONTHLY CHART
Click chart to enlarge. Chart courtesy of et=”_blank”>StockCharts.com.
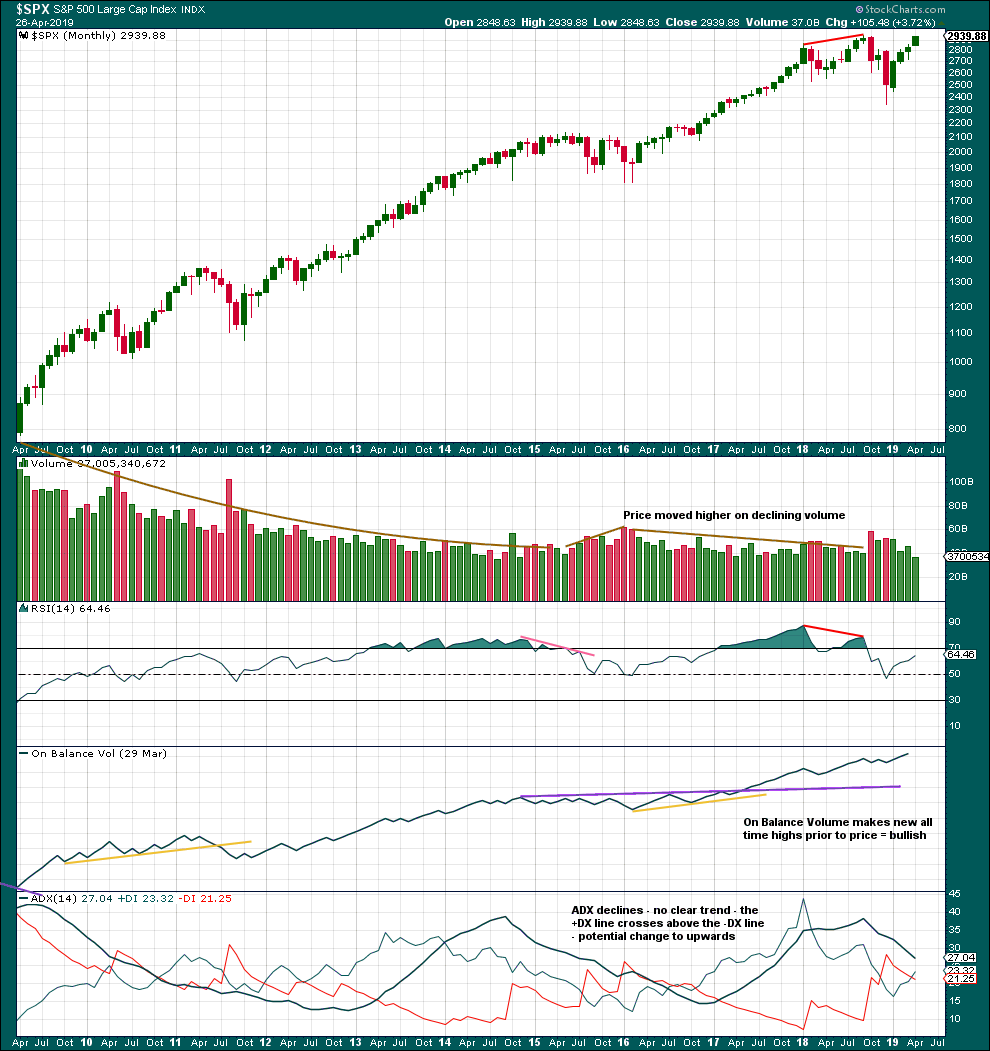
Price moving higher on declining volume has been a feature of this bull market since 2009. This may fit the larger picture that sees this bull market as a Super Cycle degree fifth wave. Fifth waves should exhibit some weakness; they do not always have support from volume. It may also fit the picture for the new second Elliott wave count; if this is a first wave, it may exhibit some weakness.
RSI indicates the main monthly wave count may be more likely. It reached into overbought towards the end of both cycle waves I and III for that wave count.
WEEKLY CHART
Click chart to enlarge. Chart courtesy of et=”_blank”>StockCharts.com.
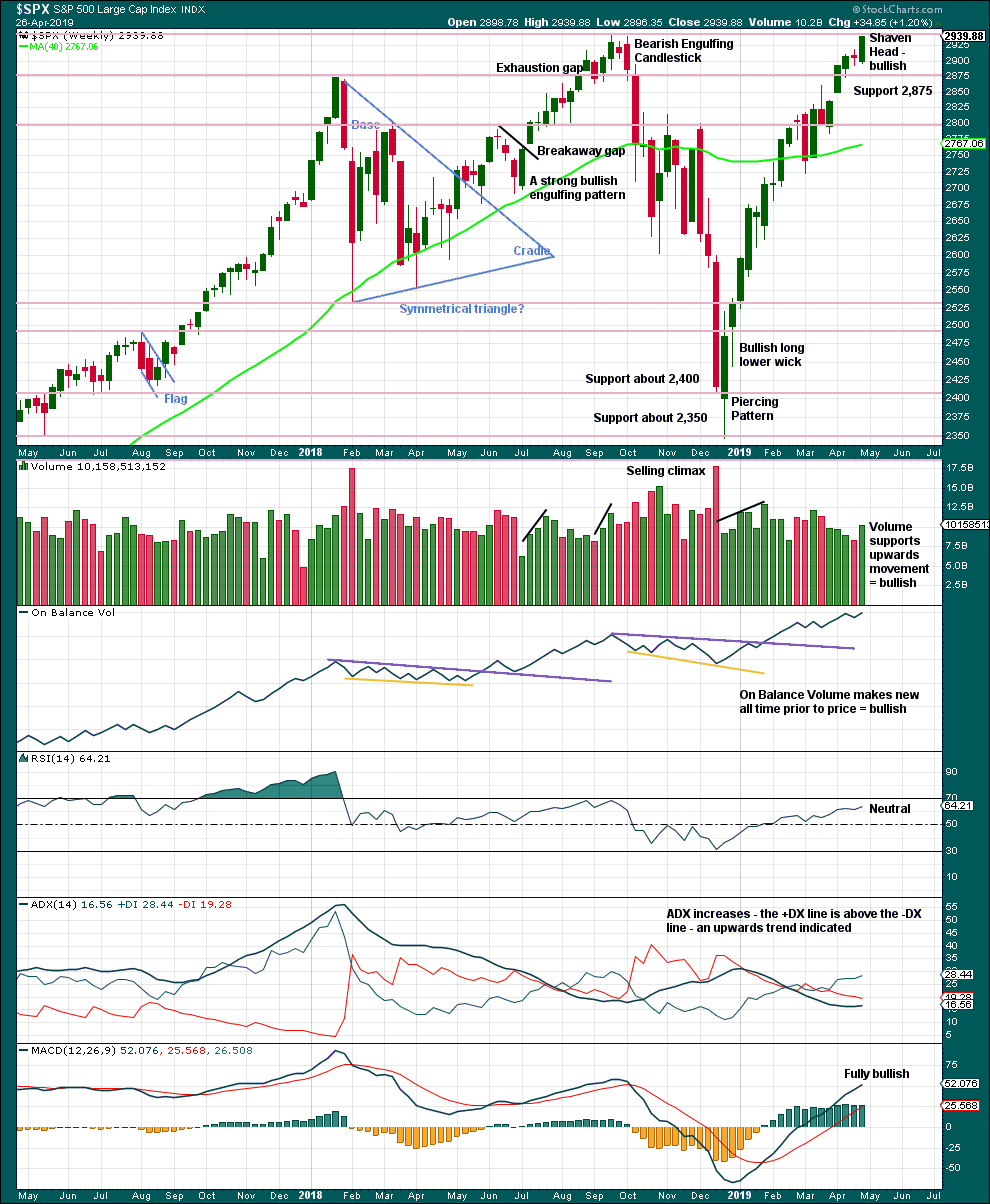
Next resistance is about the prior all time high about 2,940.
This chart is fully bullish. A new all time high may come on Monday.
DAILY CHART
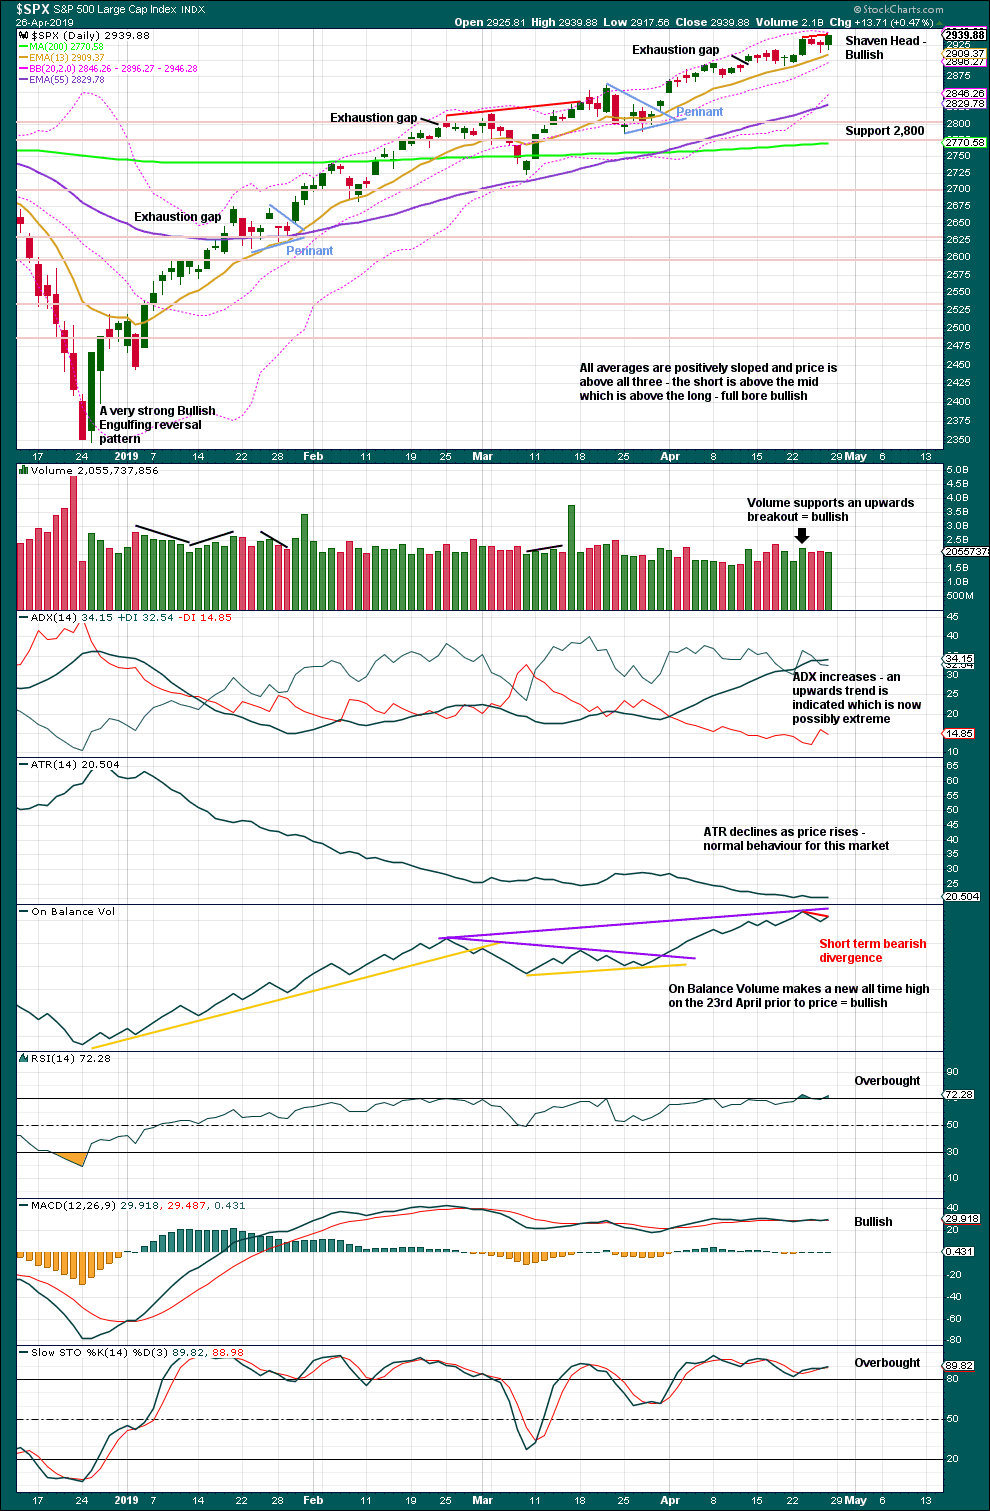
Click chart to enlarge. Chart courtesy of StockCharts.com.
The December 2018 low is expected to remain intact. The two 90% upwards days on 26th December 2018 and 6th January 2019 indicate this upwards trend has internal strength.
While the last swing low of the 25th of March remains intact, there exists a series of higher highs and higher lows from the major low in December 2018. It would be safest to assume the upwards trend remains intact. ADX agrees.
The shaven head on today’s candlestick should be given weight. A new all time high may come on Monday.
Short-term bearish divergence between price and On Balance Volume will not be given weight. It has proven recently to be unreliable.
BREADTH – AD LINE
WEEKLY CHART
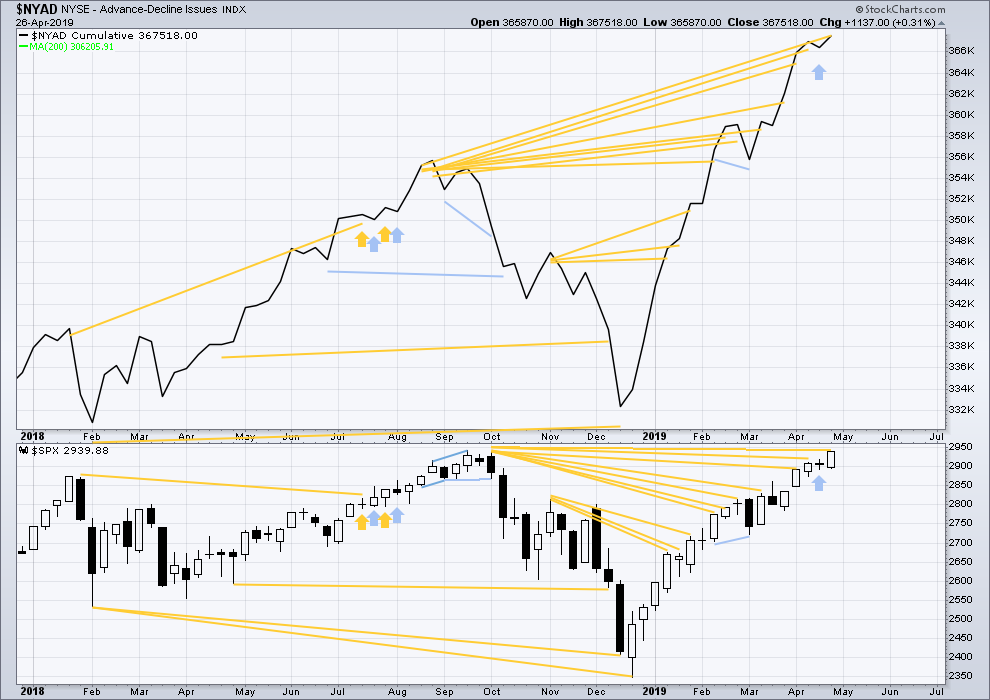
Click chart to enlarge. Chart courtesy of StockCharts.com. So that colour blind members are included, bearish signals
will be noted with blue and bullish signals with yellow.
Every single bear market from the Great Depression and onwards has been preceded by a minimum of 4 months divergence between price and the AD line. With the AD line making a new all time high again in April, the end of this bull market and the start of a new bear market must be a minimum of 4 months away, which is the end of August 2019 at this time.
This week the AD line makes another new all time high with price failing to make a corresponding new all time high by the slimmest of margins at 1.03 points.
Mid and large caps have both made new highs above the swing high of the 25th of February, but small caps have not. However, small caps AD line has made a new all time high on the 12th of April indicating broad strength underlying this market. Mid and small caps continue to lag. This rise is driven primarily by large caps, which is typical for an aged bull market.
DAILY CHART
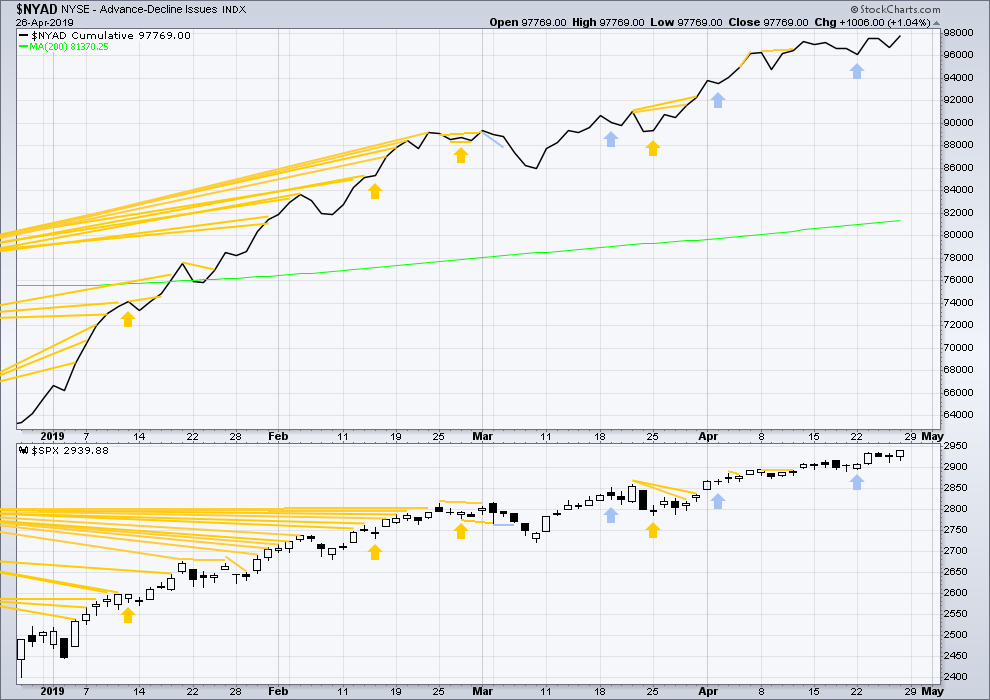
Click chart to enlarge. Chart courtesy of StockCharts.com. So that colour blind members are included, bearish signals
will be noted with blue and bullish signals with yellow.
Breadth should be read as a leading indicator.
Both price and the AD line moved higher today. Upwards movement has support from increasing market breadth, and breadth is not increasing faster than price.
VOLATILITY – INVERTED VIX CHART
WEEKLY CHART
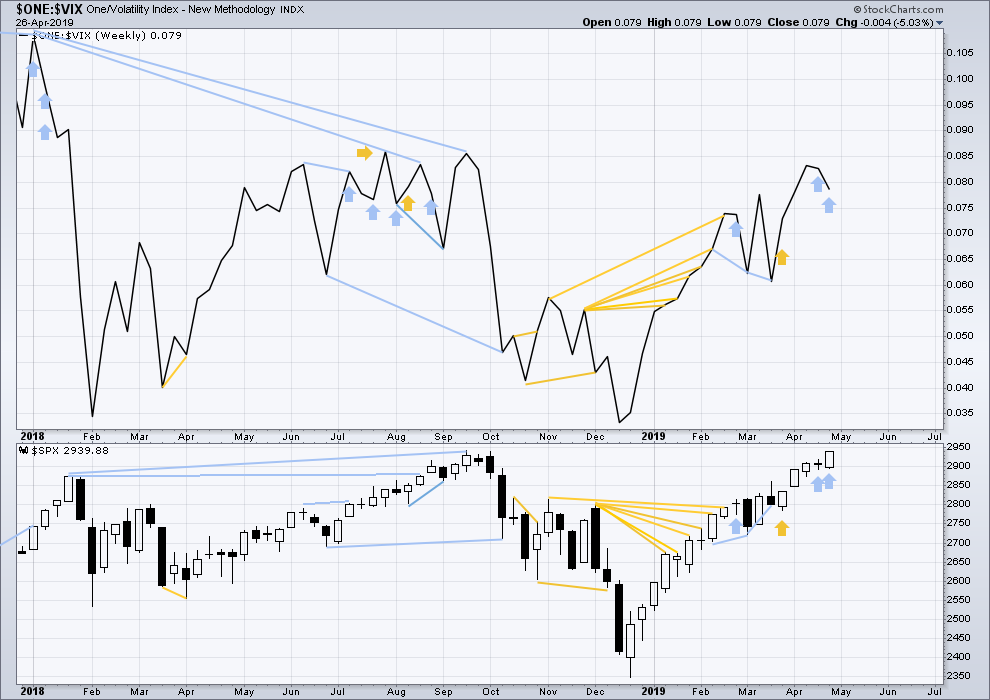
Click chart to enlarge. Chart courtesy of StockCharts.com. So that colour blind members are included, bearish signals
will be noted with blue and bullish signals with yellow.
For two weeks in a row price has moved higher and inverted VIX has moved lower. Last week was not so clear as the weekly price candlestick was red, but this week is clear. Price has moved strongly higher, but inverted VIX has moved strongly lower. This divergence is bearish for the short to mid term and may be warning of an approaching primary (or intermediate) degree correction.
DAILY CHART
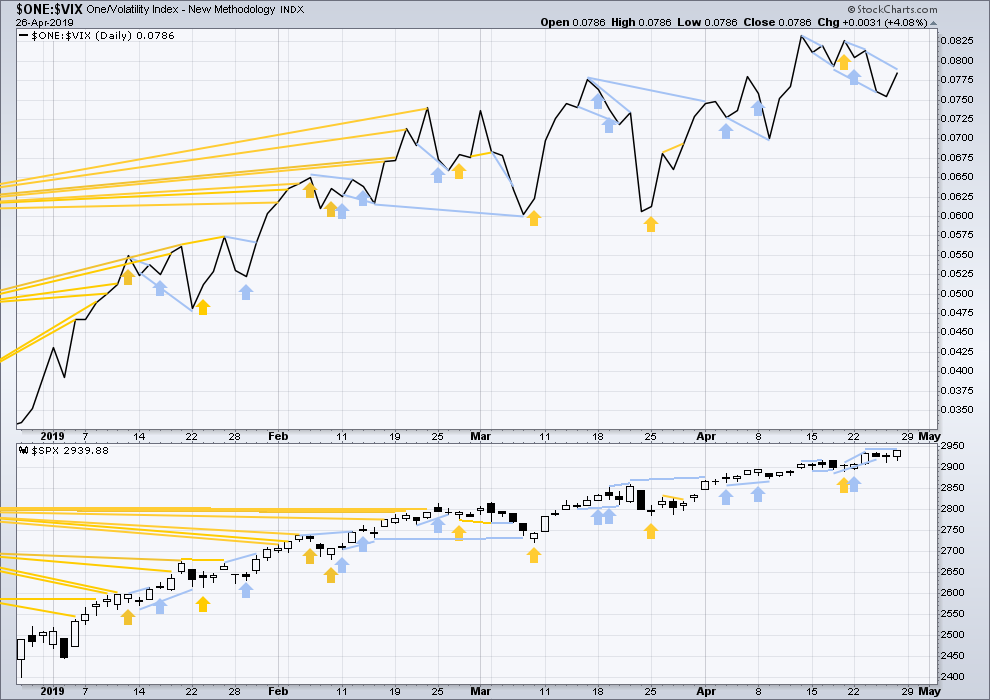
Click chart to enlarge. Chart courtesy of StockCharts.com. So that colour blind members are included, bearish signals
will be noted with blue and bullish signals with yellow.
Price has made a new short-term high, but inverted VIX has not. There is now double bearish short-term divergence.
DOW THEORY
Dow Theory confirmed a bear market in December 2018. This does not necessarily mean a bear market at Grand Super Cycle degree though; Dow Theory makes no comment on Elliott wave counts. On the 25th of August 2015 Dow Theory also confirmed a bear market. The Elliott wave count sees that as part of cycle wave II. After Dow Theory confirmation of a bear market in August 2015, price went on to make new all time highs and the bull market continued.
DJIA: 23,344.52 – a close on the 19th of December at 23,284.97 confirms a bear market.
DJT: 9,806.79 – price has closed below this point on the 13th of December.
S&P500: 2,532.69 – a close on the 19th of December at 2,506.96 provides support to a bear market conclusion.
Nasdaq: 6,630.67 – a close on the 19th of December at 6,618.86 provides support to a bear market conclusion.
With all the indices moving now higher, Dow Theory would confirm a bull market if the following highs are made:
DJIA: 26,951.81
DJT: 11,623.58
S&P500: 2,940.91
Nasdaq: 8,133.30 – a new high has been made on 24th of April 2019.
Published @ 04:31 p.m. EST on April 27, 2019.
—
Careful risk management protects your trading account(s).
Follow my two Golden Rules:
1. Always trade with stops.
2. Risk only 1-5% of equity on any one trade.
Hourly chart updated:
The invalidation point may now be moved and a new short term channel may be drawn about the middle of minor 5. Minute iv may not move into minute i.
Hi Rodney, how’s your diverticulitis situation?
I like this JD set up. Weekly/daily/hourly/5 min, clockwise from top left. Weekly macd full positive, trend is UP. Daily macd shows a nice pullback in an ongoing up trend (both lines still above zero). Trend here is mild down. Hourly macd has the fast line just crossing above zero, and trend is up. The 5 minute looks head and shoulder-ish, and overall the hit and turn is off a 61.8%. I’m long here. Will decide before earnings (6 days) whether to hold any/all through that or not.
This is RUT daily. The chart sure screams “cup and handle breakout to the upside!” to me. A classic break out look, strongly suggesting that price is going to work it’s way up to the ATH level (1600 -> 1750).
I like this JD set up. Weekly/daily/hourly/5 min, clockwise from top left. Weekly macd full positive, trend is UP. Daily macd shows a nice pullback in an ongoing up trend (both lines still above zero). Trend here is mild down. Hourly macd has the fast line just crossing above zero, and trend is up. The 5 minute looks head and shoulder-ish, and overall the hit and turn is off a 61.8%. I’m long here. Will decide before earnings (6 days) whether to hold any/all through that or not.
SPX hit a 1.61% extension at 2947.7 of the 3/8 to 3/21 up move, and is arguably ready for the minuette (green) iv. When that comes (soon?) price should stay above 2932.5, and a turn up down close to there will be a pretty good buy set up.
RUT made a higher high! Finally…
Yes RUT’s been nice to me today. Higher high vs. the February high. RUT and other small cap indices failure to “keep up” with SPX and NDX has been cited by some as evidence that the bull run from December is just a counter-trend move. Nope. I don’t buy that such “divergences” in performance are super meaningful, myself. Sometimes, but some divergence is performance is also common.
AND WE HAVE A NEW ATH IN SPX!!!! Everybody blowing horns and popping poppers, with little party hats on? “It’s been a loooong, time comin’….”
Banks going nuts to the upside today. Interest rates moving up, arguably re-starting their secular trend. Is the fed already swinging back towards a hawkish posture? Wouldn’t surprise me. They seem to be letting the market whipsaw them!
And…we have Lara stating that the GSC wave 1 which we were thinking would top (for a year or two now) in late 2019…MAY RUN ANOTHER DECADE! Wow. That’s nice, because it is 1000% easier to trade to the long side and than the short, in my experience.
I notice oil is retesting the lower channel line right now. Up and through and renewed bull trend, or a failure soon? The trigger now is obviously the outstanding low in /CL at 62.28. Price is at 63.4 now and rising. The trend line is at 63.6 or so. I’m looking for a short set up in OIH, where I will use a spread.
I am going to keep my short open on oil, I will get out if we close daily above Friday’s large red candle. It’s bigger than any daily red candle in that last run up…
“And…we have Lara stating that the GSC wave 1 which we were thinking would top (for a year or two now) in late 2019…MAY RUN ANOTHER DECADE! ”
But first, with cycle wave II in there. Which would be a bear market to last at least a year, maybe more.
Lara,
I am wondering why you did nor post or comment on the Monthly Alternate (shown below) which has been shown previously on the weekly commentary.
I’m wondering if Intermediate 1 and 2 of Primary 1 were actually Cycle waves I and II. My thought is that Cycle wave III might have ended where Lara has labelled Intermediate 3 of Primary 1 of Cycle III (with Primary 3 of Cycle 3 corresponding to what Lara has labelled the end of Cycle I–this looks like the point of highest momentum, what you would expect for a 3rd wave at multiple degrees). The December 2018 low would then have been the end of Cycle IV as an expanded flat, which would put us early into Cycle V now.
Mostly because the trend channel doesn’t fit as well. The way it fits around a third wave for the two counts published, really makes me think that was a third wave, not a first.
Also, because I wanted to keep the number of charts manageable.
The other two alternates in last historic analysis remain valid and I’ll keep their charts updated. I’ll publish that one if you have a strong preference for it Rodney, in the next historic analysis alongside the two here.
Thanks a lot Lara. The Second Monthly / Weekly count is not exactly what I was expecting. Quite interesting.
Oh, and I am #1 for the weekend even after a long day full of domestic chores and a workout.
Curses Red Baron!
If I am the Red Baron, would that make you Snoopy? That was a song from a long time ago (released in 1966) previous to the birth of most people on this forum I suspect.
Yes, it’s “old code”, lol!!!
I loved that song when I was 8 years old! Along with the Harlem Globetrotters, the movie “The Crawling Eye” (which seemed to be on afternoon TV EVERY TIME I was home sick!), and a 60’s animated show called “Johnny Quest”, which I remember liking particularly because the heroic kids always included a girl or two as part of the team.