An upwards breakout with support from volume indicates the pullback is over and the upwards trend has resumed.
Summary: The upwards breakout suggests minor 4 has not yet arrived. The target for it to arrive is at 3,179, but this may be too low.
Thereafter, the next target is at 3,302 and then 3,336.
Three large pullbacks or consolidations during the next 1-2 years are expected: for minor wave 4 (coming soon), then intermediate (4), and then primary 4.
The biggest picture, Grand Super Cycle analysis, is here.
Monthly charts were last published here, with video here. There are two further alternate monthly charts here, with video here.
ELLIOTT WAVE COUNTS
The two weekly Elliott wave counts below will be labelled First and Second. They may be about of even probability. When the fifth wave currently unfolding on weekly charts may be complete, then these two wave counts will diverge on the severity of the expected following bear market. To see an illustration of this future divergence monthly charts should be viewed.
FIRST WAVE COUNT
WEEKLY CHART
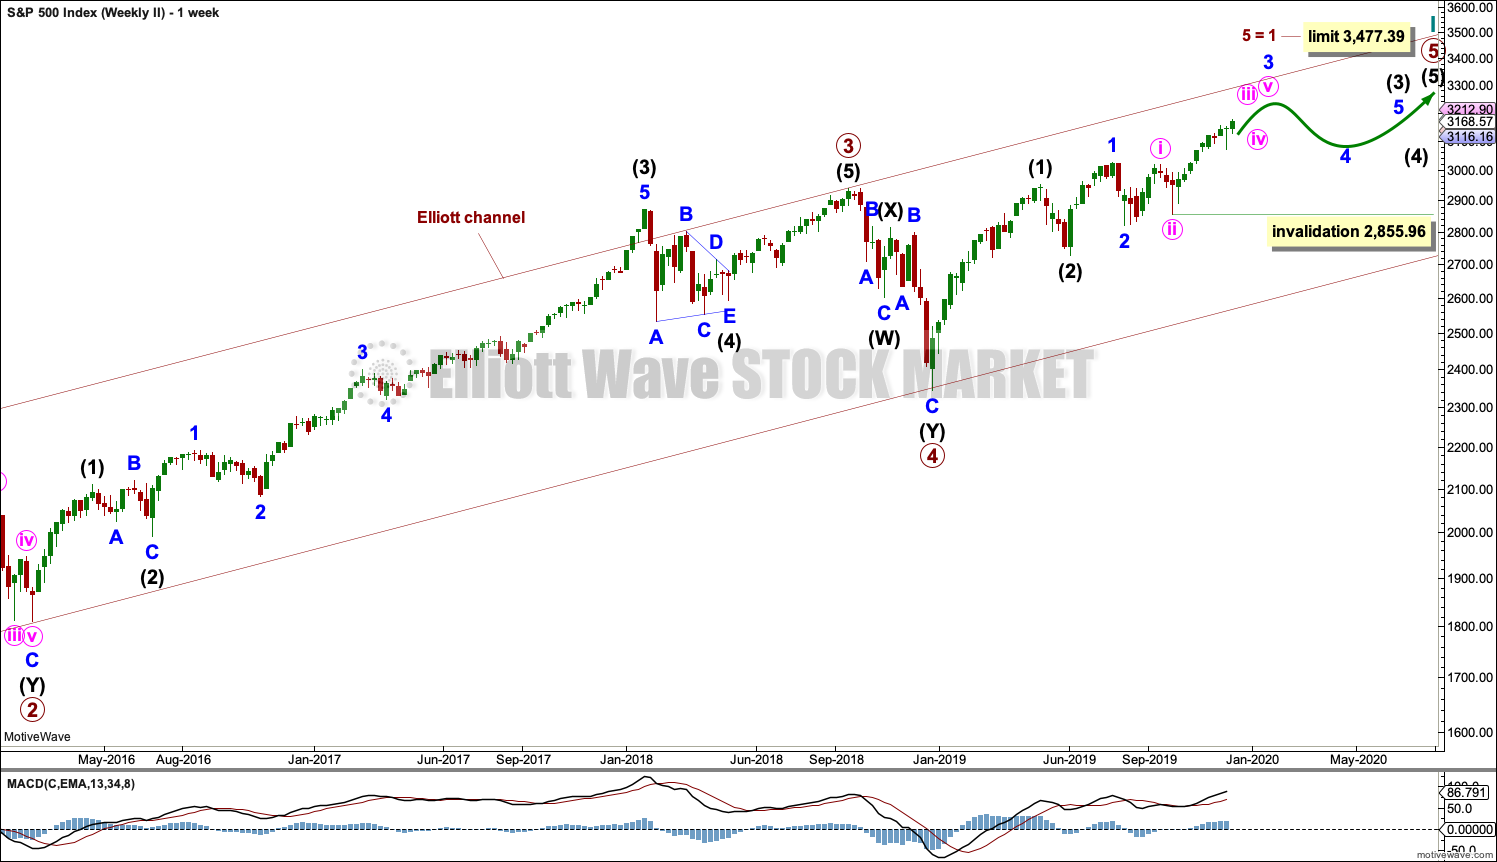
The basic Elliott wave structure consists of a five wave structure up followed by a three wave structure down (for a bull market). This wave count sees the bull market beginning in March 2009 as an incomplete five wave impulse and now within the last fifth wave, which is labelled cycle wave V. This impulse is best viewed on monthly charts. The weekly chart focusses on the end of it.
Elliott wave is fractal. This fifth wave labelled cycle wave V may end a larger fifth wave labelled Super Cycle wave (V), which may end a larger first wave labelled Grand Super Cycle wave I.
The teal Elliott channel is drawn using Elliott’s first technique about the impulse of Super Cycle wave (V). Draw the first trend line from the end of cycle wave I (off to the left of the chart, the weekly candlestick beginning 30th November 2014) to the end of cycle wave III, then place a parallel copy on the end of cycle wave II. This channel perfectly shows where cycle wave IV ended at support. The strongest portion of cycle wave III, the end of primary wave 3, overshoots the upper edge of the channel. This is a typical look for a third wave and suggests the channel is drawn correctly and the way the impulse is counted is correct.
Within Super Cycle wave (V), cycle wave III is shorter than cycle wave I. A core Elliott wave rule states that a third wave may never be the shortest. For this rule to be met in this instance, cycle wave V may not be longer in length than cycle wave III. This limit is at 3,477.39.
Cycle wave V may subdivide either as an impulse or an ending diagonal. Impulses are much more common. An alternative wave count which considered an ending diagonal has been invalidated. While it is possible a diagonal may become an alternate wave count in coming weeks or months, at this stage the structure does not fit.
At this stage, cycle wave V may take another one to two or so years to complete.
The daily chart below will focus on movement from the end of intermediate wave (2) within primary wave 3.
In historic analysis, two further monthly charts have been published that do not have a limit to upwards movement and are more bullish than this wave count. Members are encouraged to consider those possibilities (links below summary) alongside the wave counts presented on a daily and weekly basis. It is my judgement that the wave count above has the highest probability, so it shall be the only wave count published on a daily basis.
Within cycle wave V, primary waves 1 and 2 may be complete. Within primary wave 3, intermediate waves (1) and (2) may be complete. Within the middle of intermediate wave (3), no second wave correction may move beyond its start below 2,855.96.
DAILY CHART
All of primary wave 3, intermediate wave (3) and minor wave 3 may only subdivide as impulses.
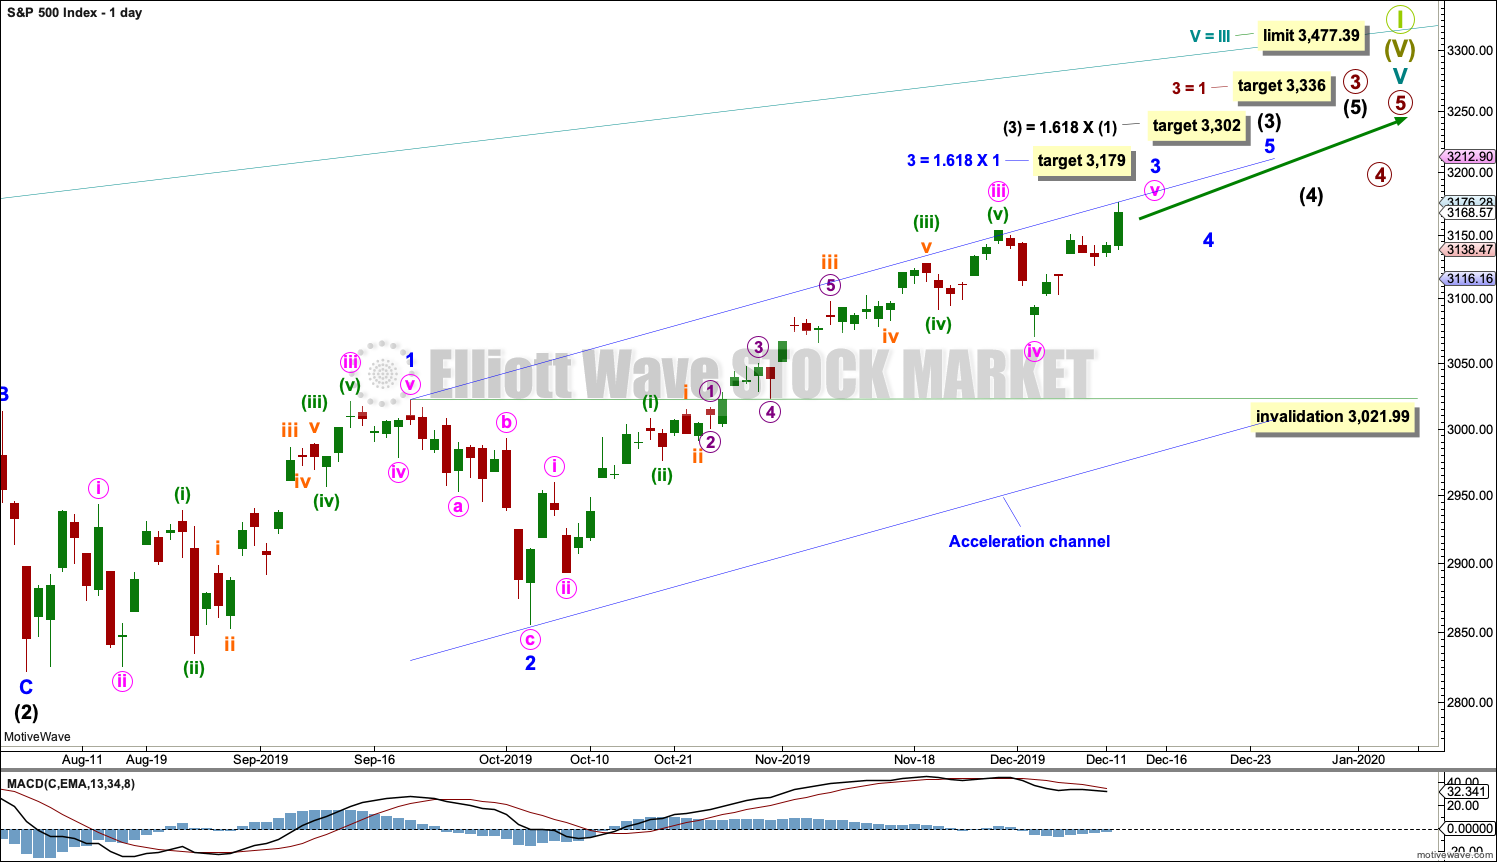
Minor wave 3 is today relabelled as incomplete and the original target is again used. About this target minute wave v within minor wave 3 would be fairly close to equality in length with minute wave i, and so this target has a reasonable probability.
Minor wave 2 was a sharp deep pullback, so minor wave 4 may be expected to be a very shallow sideways consolidation to exhibit alternation. Minor wave 2 lasted 2 weeks. Minor wave 4 may be about the same duration, or it may be a longer lasting consolidation. Minor wave 4 may end within the price territory of the fourth wave of one lesser degree; minute wave iv has its range from 3,154.26 to 3,070.49.
Minor wave 4 may not move into minor wave 1 price territory below 3,021.99.
Intermediate wave (3) must move far enough above the end of intermediate wave (1) to then allow intermediate wave (4) to unfold and remain above intermediate wave (1) price territory. While intermediate wave (3) has now moved beyond the end of intermediate wave (1), meeting a core Elliott wave rule, it still needs to continue higher to give room for intermediate wave (4).
The target for intermediate wave (3) fits with a target calculated for minor wave 3.
Draw an acceleration channel now about intermediate wave (3): draw the first trend line from the end of minor wave 1 to the last high, then place a parallel copy on the end of minor wave 2. Keep redrawing the channel as price continues higher. When minor wave 3 is complete, then this channel would be an Elliott channel and may show where minor wave 4 may find support if it is long lasting enough.
HOURLY CHART
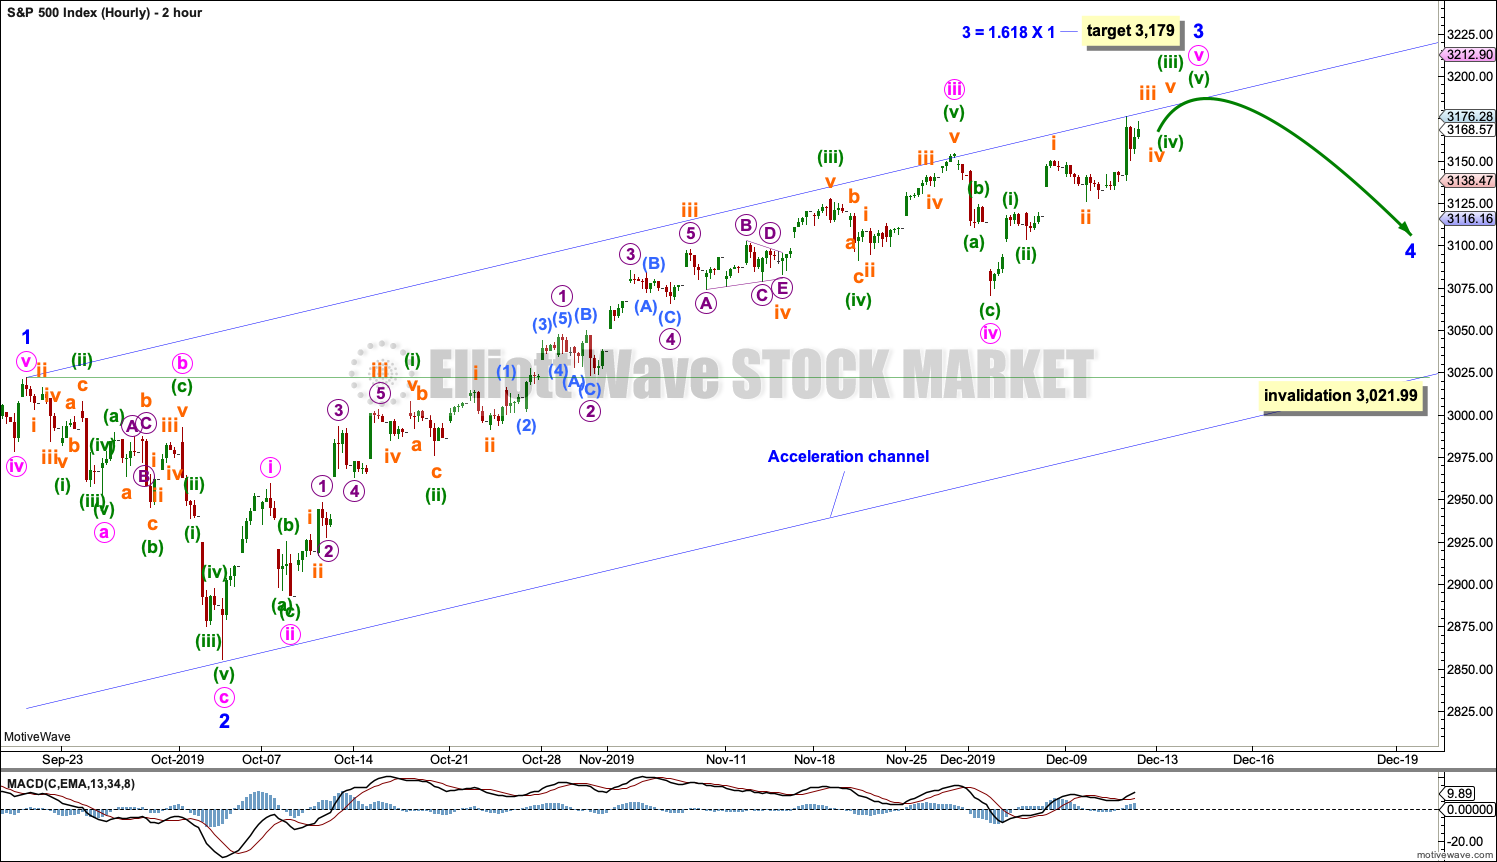
This 2 hourly chart shows all of minor waves 2 and 3 so far. Minor wave 3 is extending; it is now very close to 1.618 the length of minor wave 1.
Minute wave v needs to complete, so a little more upwards movement may be required with two small intra-day corrections along the way for subminuette wave v and minuette wave (iv).
If the target at 3,179 is wrong, it may not be high enough. Minute wave v may need a little more room to complete its structure.
Minor wave 3 may now end in one to a very few more days.
SECOND WAVE COUNT
WEEKLY CHART
This weekly chart is almost identical to the first weekly chart, with the sole exception being the degree of labelling.
This weekly chart moves the degree of labelling for the impulse beginning in March 2009 all down one degree. This difference is best viewed on monthly charts.
The impulse is still viewed as nearing an end; a fifth wave is still seen as needing to complete higher. This wave count labels it primary wave 5.
Primary wave 5 may be subdividing as either an impulse, in the same way that cycle wave V is seen for the first weekly chart.
TECHNICAL ANALYSIS
MONTHLY CHART
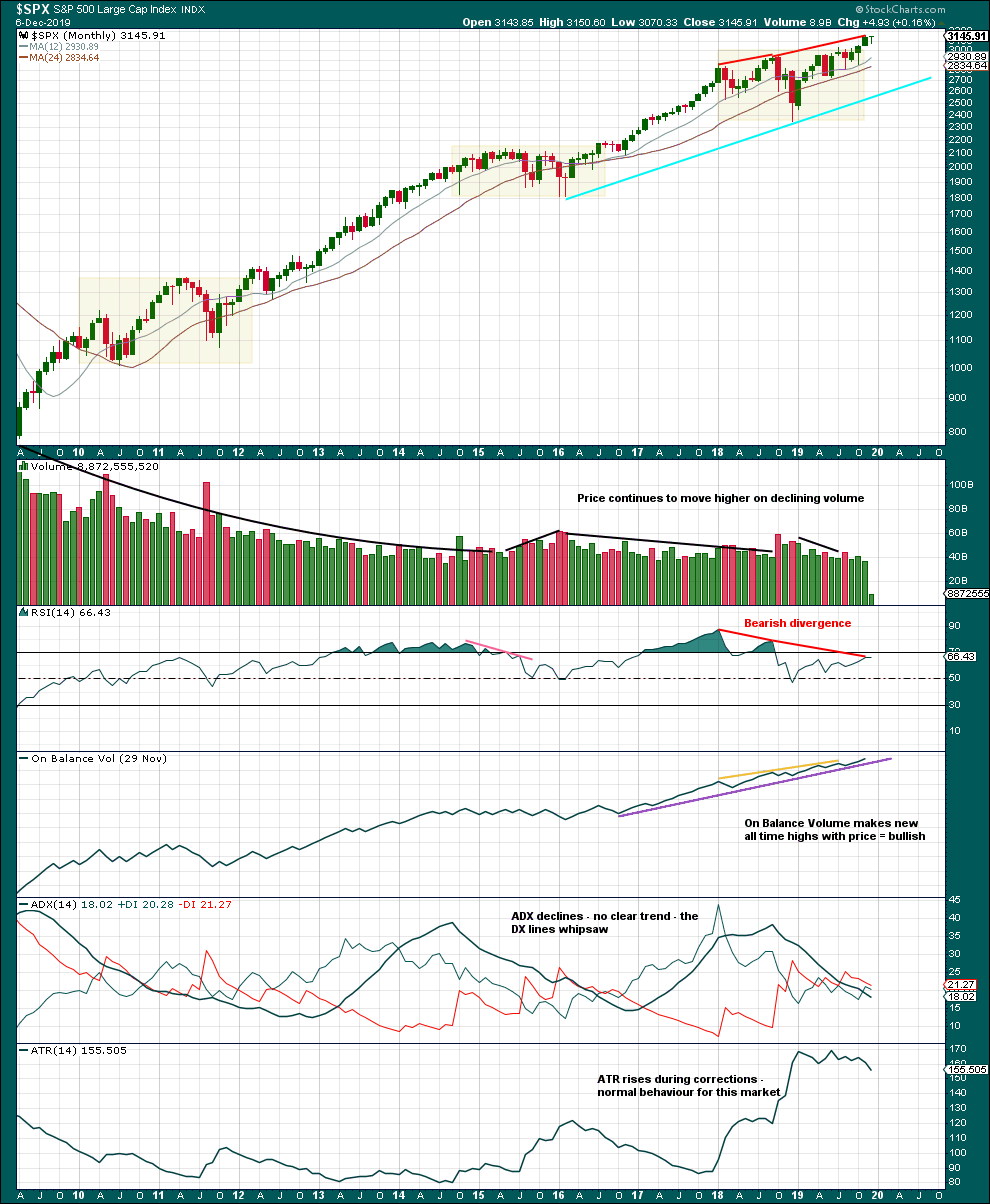
Click chart to enlarge. Chart courtesy of StockCharts.com.
There are three large consolidations noted on this chart, in shaded areas. After a breakout from a multi-month consolidation, it is reasonable to expect a multi month bullish move may result.
This chart very clearly exhibits rising price on declining volume has now persisted for several years. A decline in volume this month, in current market conditions, is not of concern.
On Balance Volume supports the Elliott wave count.
WEEKLY CHART
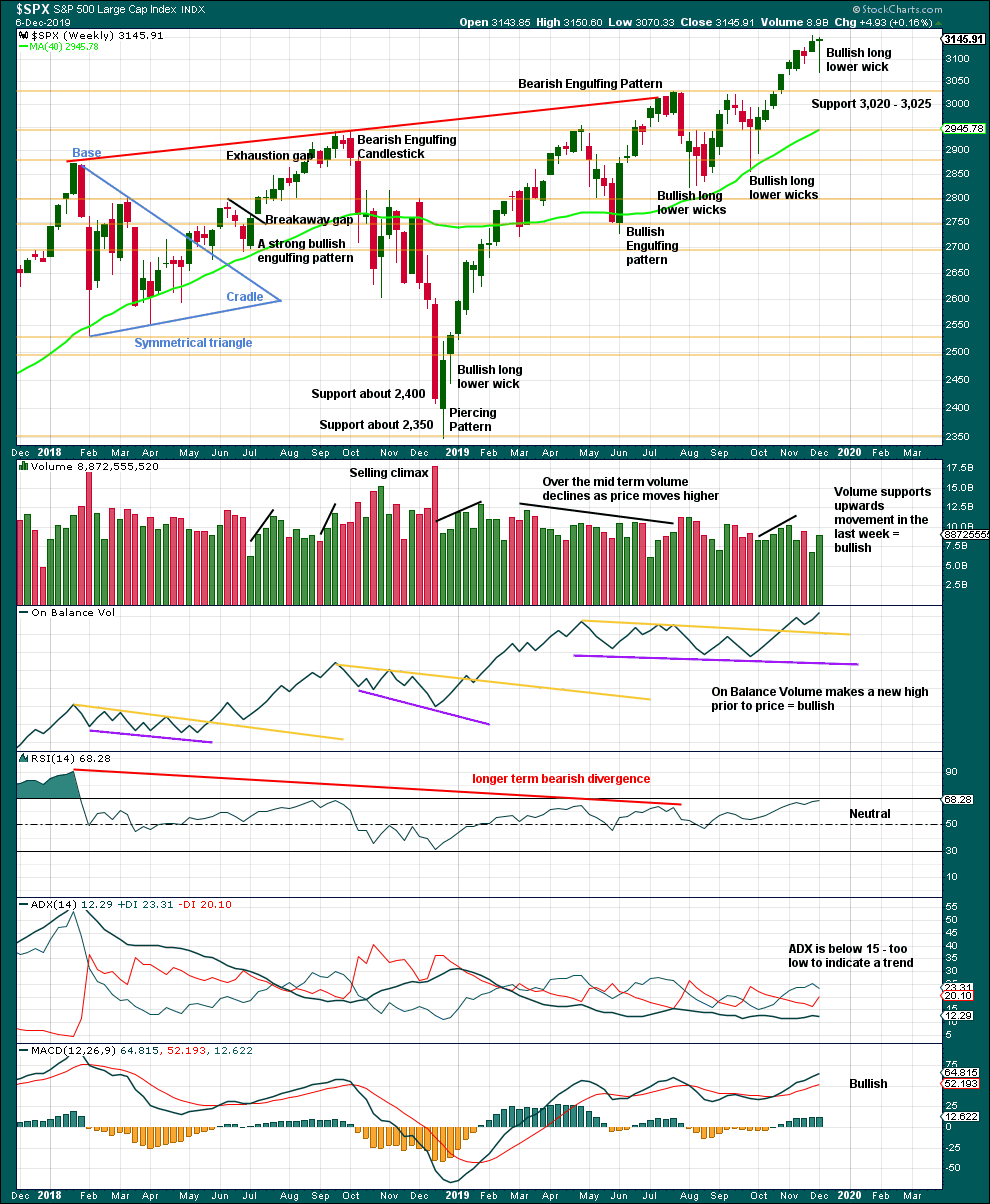
Click chart to enlarge. Chart courtesy of StockCharts.com.
It is very clear that the S&P is in an upwards trend and the bull market is continuing. Price does not move in straight lines; there will be pullbacks and consolidations along the way.
Last week completes a bullish candlestick, which suggests more upwards movement next week.
DAILY CHART
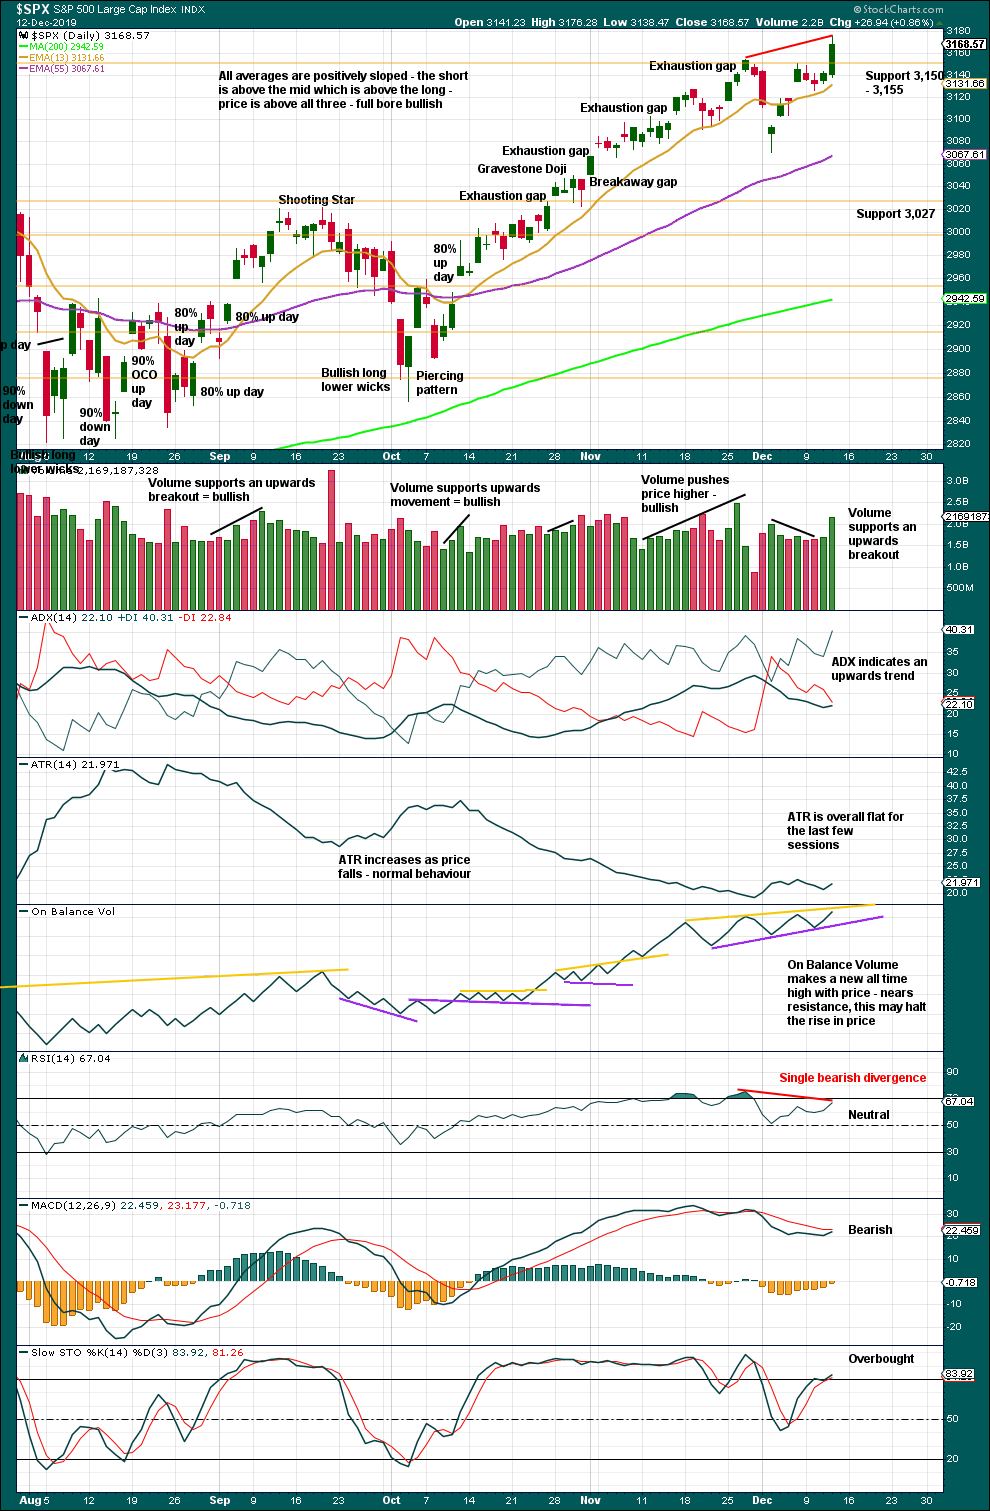
Click chart to enlarge. Chart courtesy of StockCharts.com.
There is an upwards trend in place. There will be corrections along the way.
A new all time high with confirmation from On Balance Volume and support from volume indicates the last pullback is over and the upwards trend has resumed.
BREADTH – AD LINE
WEEKLY CHART
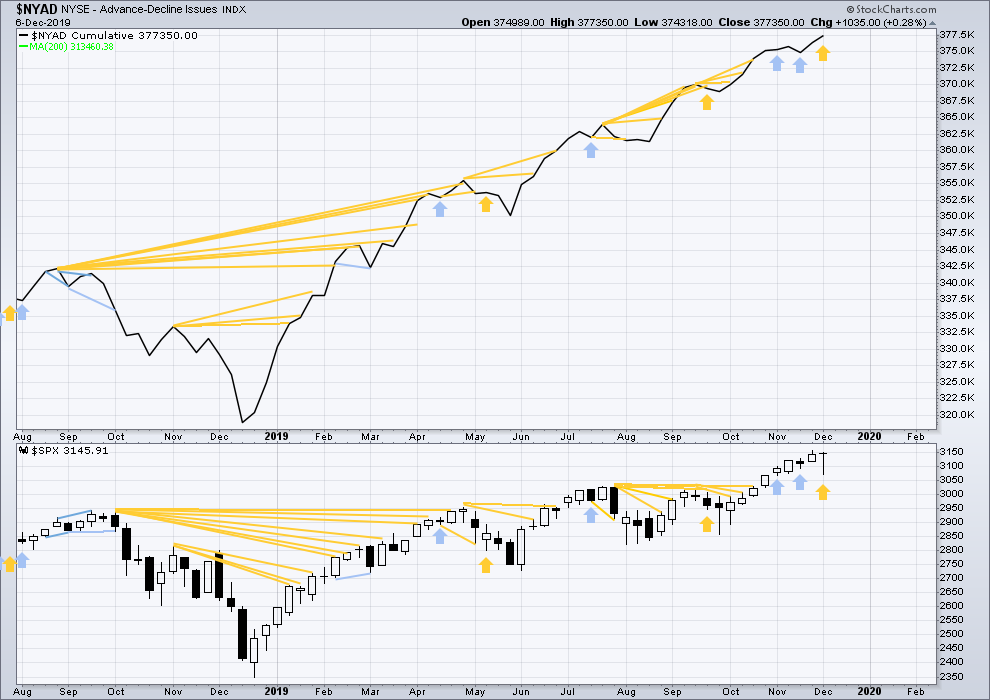
Click chart to enlarge. Chart courtesy of StockCharts.com. So that colour blind members are included, bearish signals
will be noted with blue and bullish signals with yellow.
Bear markets from the Great Depression and onwards have been preceded by an average minimum of 4 months divergence between price and the AD line with only two exceptions in 1946 and 1976. With the AD line making new all time highs last week, the end of this bull market and the start of a new bear market is very likely a minimum of 4 months away, which is mid March 2020.
In all bear markets in the last 90 years there is some positive correlation (0.6022) between the length of bearish divergence and the depth of the following bear market. No to little divergence is correlated with more shallow bear markets. Longer divergence is correlated with deeper bear markets.
If a bear market does develop here, it comes after no bearish divergence. It would therefore more likely be shallow.
All of small, mid and large caps have made new swing highs above the prior swing high on the 13th of September, but only large caps have made new all time highs. This upwards movement appears to be mostly driven by large caps, which is a feature of aged bull markets. This bull market at over 10 years duration certainly fits the definition of aged.
Last week price has moved lower with a lower low and a lower high, but the AD line has moved higher. This divergence is bullish.
DAILY CHART
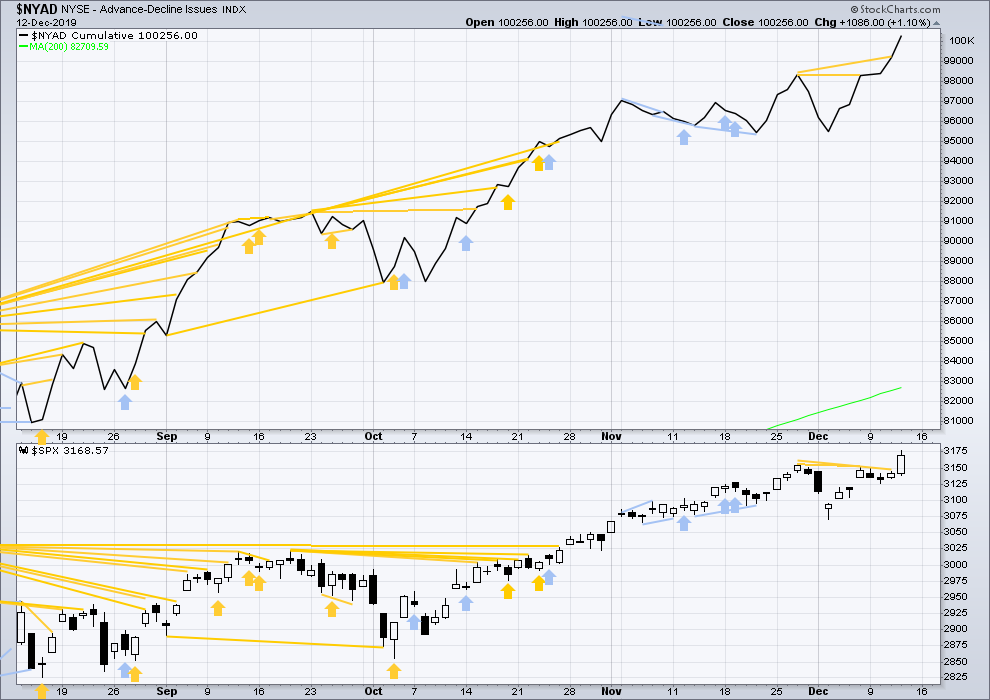
Click chart to enlarge. Chart courtesy of StockCharts.com. So that colour blind members are included, bearish signals
will be noted with blue and bullish signals with yellow.
Breadth should be read as a leading indicator.
On Friday price has moved higher but failed by a very small margin to make a new all time high. The AD line has moved higher to make a new all time high but only by a very small margin. This divergence is bullish, but it is weak.
Bullish divergence yesterday from the AD line has now been followed by upwards movement.
Today both price and the AD line have made new all time highs. There is no new divergence.
VOLATILITY – INVERTED VIX CHART
WEEKLY CHART
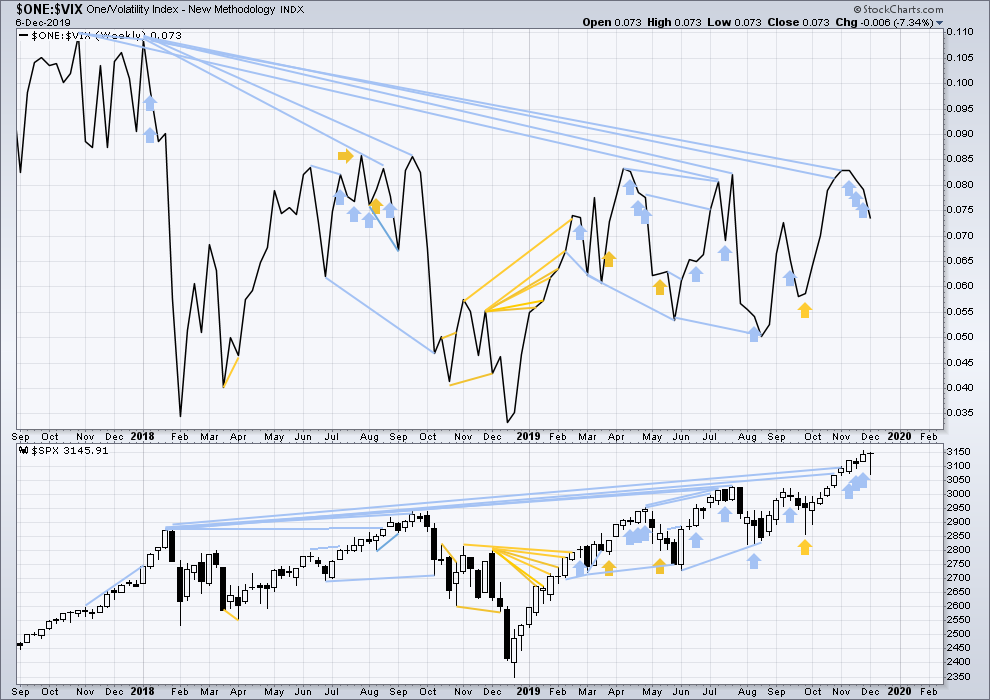
Click chart to enlarge. Chart courtesy of StockCharts.com. So that colour blind members are included, bearish signals
will be noted with blue and bullish signals with yellow.
The all time high for inverted VIX was on 30th October 2017. There is now over two years of bearish divergence between price and inverted VIX.
The rise in price is not coming with a normal corresponding decline in VIX; VIX remains elevated. This long-term divergence is bearish and may yet develop further as the bull market matures.
This divergence may be an early warning, a part of the process of a top developing that may take years. It may is clearly not useful in timing a trend change from bull to a fully fledged bear market.
Last week price and inverted VIX have both moved lower. There is no new short-term divergence.
DAILY CHART
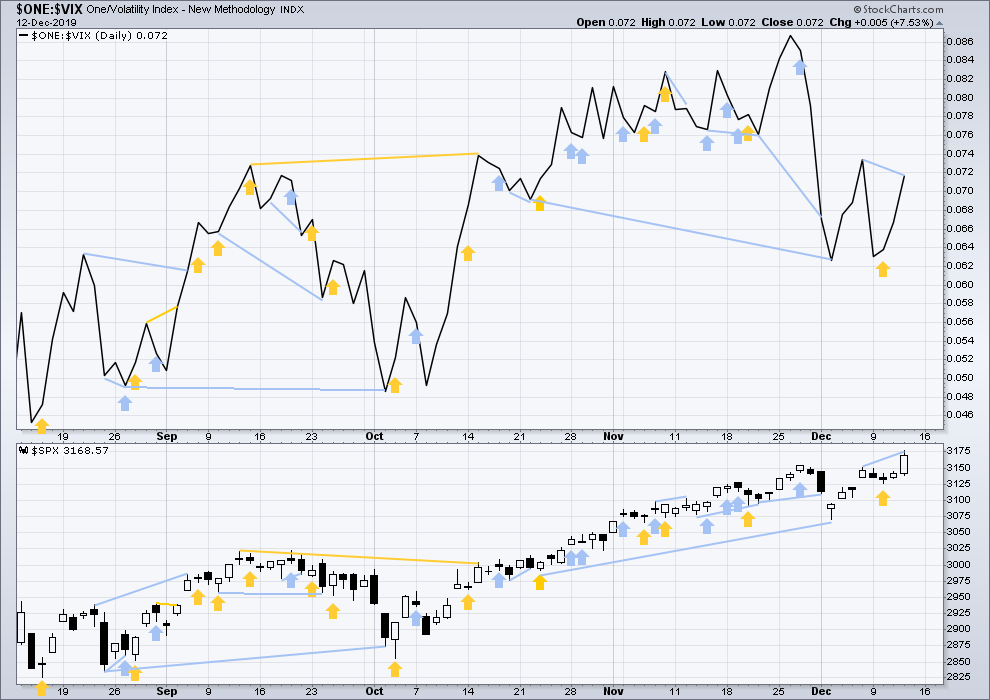
Click chart to enlarge. Chart courtesy of StockCharts.com. So that colour blind members are included, bearish signals
will be noted with blue and bullish signals with yellow.
Today both inverted VIX and price have moved higher. Price has made both a new all time high and a new short-term swing high, but inverted VIX has made neither. There is short, mid and long-term divergence.
DOW THEORY
Dow Theory confirmed a bear market in December 2018. This does not necessarily mean a bear market at Grand Super Cycle degree though; Dow Theory makes no comment on Elliott wave counts. On the 25th of August 2015 Dow Theory also confirmed a bear market. The Elliott wave count sees that as part of cycle wave II. After Dow Theory confirmation of a bear market in August 2015, price went on to make new all time highs and the bull market continued.
DJIA: 23,344.52 – a close on the 19th of December at 23,284.97 confirms a bear market.
DJT: 9,806.79 – price has closed below this point on the 13th of December.
S&P500: 2,532.69 – a close on the 19th of December at 2,506.96 provides support to a bear market conclusion.
Nasdaq: 6,630.67 – a close on the 19th of December at 6,618.86 provides support to a bear market conclusion.
With all the indices having moved higher following a Dow Theory bear market confirmation, Dow Theory would confirm a bull market if the following highs are made:
DJIA: 26,951.81 – a close above this point has been made on the 3rd of July 2019.
DJT: 11,623.58 – to date DJT has failed to confirm an ongoing bull market.
S&P500: 2,940.91 – a close above this point was made on the 29th of April 2019.
Nasdaq: 8,133.30 – a close above this point was made on the 26th of April 2019.
Published @ 05:55 p.m. EST.
—
Careful risk management protects your trading account(s).
Follow my two Golden Rules:
1. Always trade with stops.
2. Risk only 1-5% of equity on any one trade.
—
New updates to this analysis are in bold.

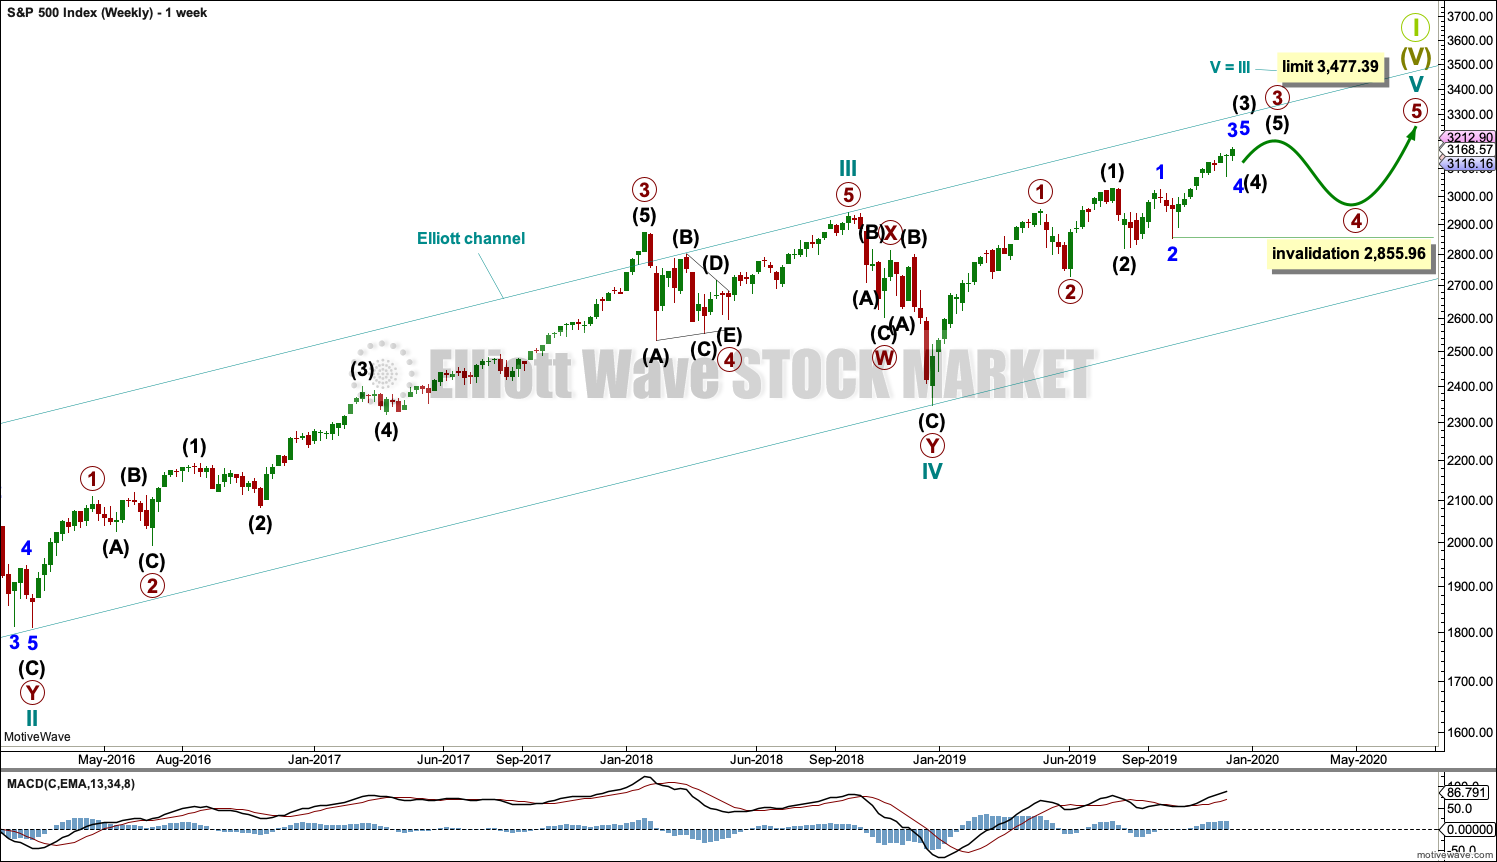
Here is a more immediately bearish model for RUT. Minor 1 up complete, and an expanding flat minor 2 in progress.
Kevin,
As it took it sooooo long to break the range, I think any move below 1600, especially 1580 is very bearish as it would suggest a false breakout… so I wouldn’t be bullish RUT then
Is it your preferred count as I remember you posted a more bullish one as well
Thanks
Hourly chart updated
Now from 2 hourly to 1 hourly candlesticks
Minute v still needs to move higher to complete an impulse structure. The target is removed, it has been met but the structure is incomplete. Minute v has already passed equality in length with minute i, so the next Fibonacci ratio in the sequence is used for the next target. This new target may be too high.
There is already a reasonable Fibonacci ratio of 2.618 between minute waves i and iii, so minute v may not exhibit a ratio to minute i. This makes target calculation rather difficult.
Here’s /ES hourly with overnight. Watching this minute v veeeery carefully. I’ve marked my best guess at structure so far. BUT, if price drops below that red line (violates the top of what I’ve shown as the minuette i), THEN there’s good reason to believe the minute v is COMPLETE, and the minor 4 has started. Again, I think this is not quite as likely…but who nose, really. If SPX gets below 3150, then my bias swings over to “minor 4 started”.
And if price does turn up into a final minuette v, then the minute iii is shorter than minuette i, and we know the limit on the high price of minuette v (about 3232 in /ES terms). Which happens to be one of my Fibonacci fitted projections for minor 3 completion in /ES, too. EW + Fibonacci structure, the keys to the market kingdom!
I’ve been following the same count. It’s time to be exiting longs ES and thinking of opening short ES…
Well, yes to taking profits off the table, but I don’t like putting on shorts yet.
Let the minute v up play out!!! It might be going a fair amount further (I think that is more likely than naught).
But yes, “the end of the minor 3” is near. I just suspect it’s still a few days away, though. Again, SPX below 3150 and it is probably minor 4 time.
So…with price starting to turn back up…a little SPX call debit spread for next Friday, 3150/3155, try to profit off this structure a bit. Out if price drops below 3150.
Bonds did a hard reversal after yesterday’s big sell off. Right back up. So I got shaken out of my spot on butterly in TLT for a tiny loss. Gads. Well…it could have continued dropping like a rock, and exiting was “required”, we can’t be result biased. But it’s painful nonetheless, lol!
Good morning and good day on this Friday the 13th. Below is an updated weekly chart on NYSE which I originally charted in mid October. It is right on track and its implications are quite bullish.
Thank Rodney. Let ‘er rip!!!
Zooming from the macro view to the micro…it’s not hard to count a 5 wave move complete for this minute v in play. And the minute v is already longer than the minute i. Is it done??? Minor 4 time now?
That is possible. However, I think it is less likely than continuing up to higher levels before completing. Why? Because when I stretch a Fibonacci structure over the entire minor 3 to date…the pivots along the way don’t “fit” very well with the Fibonacci levels. When I stretch that Fibonacci structure up to a “100%” level of around 3234…lots of fit! Furthermore, a turn here doesn’t leave a minor 4 much room to express itself, given the tendency of 4 waves to have a low inside the range of the last lower degree 4 (the just completed minute iv). So I’m thinking there’s more play to the upside, and the minor 4 starts in another week or two. But…price action speaks, always.
My projection of the area in price and time where I expect the pivot to fall. Particularly near one of the edges (blue dashed lines). It’s the range that “fits” if the minor 4 is the depth of the minor 2 (yes it might be more shallow), and comes back to somewhere in the range of the minute 4 (standard 4 wave behavior). On top of that, the two best Fibonacci projections of the entire minor 3 to date targets (shock and awe) right around those two blue lines as well.
Note the market state expectation over the next 4-6 weeks: sideways/down through much of January! I’ll be largely cashing my new longs in the form of sold put spreads for mid Jan at the coming pivot later this month (I also have a large pile that expire Dec 20). Then I’ll sell call spreads over the pivot in the broad markets and a few stocks for mid Jan expiry. Gotta stay aligned with these minor swings is my mantra, because I am trading for consistent regular income, and want minimal variation in results.
Flag captured.
Drats. No, Curses.
Ha!!