
A small range upwards day continues an expected consolidation.
Summary: Minor wave 4 may continue for another two weeks or so and may continue to find support about 3,070. It may be a choppy overlapping consolidation. Thereafter, the upwards trend may resume. The next target is at 3,302 and then 3,336.
If price gaps up to make a new all time high on an upwards day which has support from volume, then the consolidation may be considered to be over.
Three large pullbacks or consolidations during the next 1-2 years are expected: for minor wave 4, then intermediate (4), and then primary 4.
The biggest picture, Grand Super Cycle analysis, is here.
Monthly charts were last published here, with video here. There are two further alternate monthly charts here, with video here.
ELLIOTT WAVE COUNTS
The two weekly Elliott wave counts below will be labelled First and Second. They may be about of even probability. When the fifth wave currently unfolding on weekly charts may be complete, then these two wave counts will diverge on the severity of the expected following bear market. To see an illustration of this future divergence monthly charts should be viewed.
FIRST WAVE COUNT
WEEKLY CHART
Click chart to enlarge.
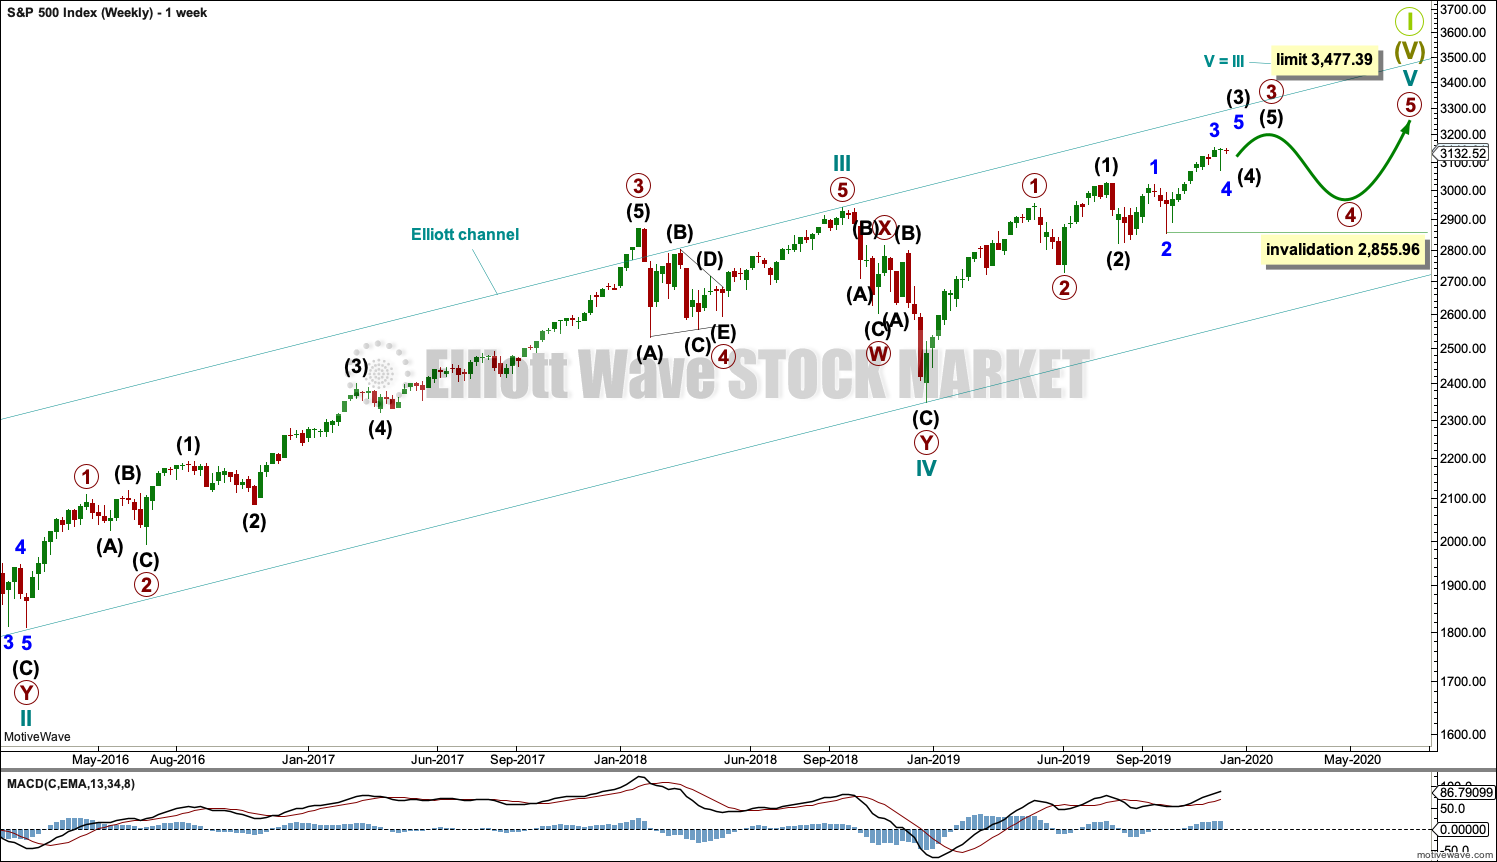
The basic Elliott wave structure consists of a five wave structure up followed by a three wave structure down (for a bull market). This wave count sees the bull market beginning in March 2009 as an incomplete five wave impulse and now within the last fifth wave, which is labelled cycle wave V. This impulse is best viewed on monthly charts. The weekly chart focusses on the end of it.
Elliott wave is fractal. This fifth wave labelled cycle wave V may end a larger fifth wave labelled Super Cycle wave (V), which may end a larger first wave labelled Grand Super Cycle wave I.
The teal Elliott channel is drawn using Elliott’s first technique about the impulse of Super Cycle wave (V). Draw the first trend line from the end of cycle wave I (off to the left of the chart, the weekly candlestick beginning 30th November 2014) to the end of cycle wave III, then place a parallel copy on the end of cycle wave II. This channel perfectly shows where cycle wave IV ended at support. The strongest portion of cycle wave III, the end of primary wave 3, overshoots the upper edge of the channel. This is a typical look for a third wave and suggests the channel is drawn correctly and the way the impulse is counted is correct.
Within Super Cycle wave (V), cycle wave III is shorter than cycle wave I. A core Elliott wave rule states that a third wave may never be the shortest. For this rule to be met in this instance, cycle wave V may not be longer in length than cycle wave III. This limit is at 3,477.39.
Cycle wave V may subdivide either as an impulse or an ending diagonal. Impulses are much more common. An alternative wave count which considered an ending diagonal has been invalidated. While it is possible a diagonal may become an alternate wave count in coming weeks or months, at this stage the structure does not fit.
At this stage, cycle wave V may take another one to two or so years to complete.
The daily chart below will focus on movement from the end of intermediate wave (2) within primary wave 3.
In historic analysis, two further monthly charts have been published that do not have a limit to upwards movement and are more bullish than this wave count. Members are encouraged to consider those possibilities (links below summary) alongside the wave counts presented on a daily and weekly basis. It is my judgement that the wave count above has the highest probability, so it shall be the only wave count published on a daily basis.
Within cycle wave V, primary waves 1 and 2 may be complete. Within primary wave 3, intermediate waves (1) and (2) may be complete. Within the middle of intermediate wave (3), no second wave correction may move beyond its start below 2,855.96.
DAILY CHART
Click chart to enlarge.
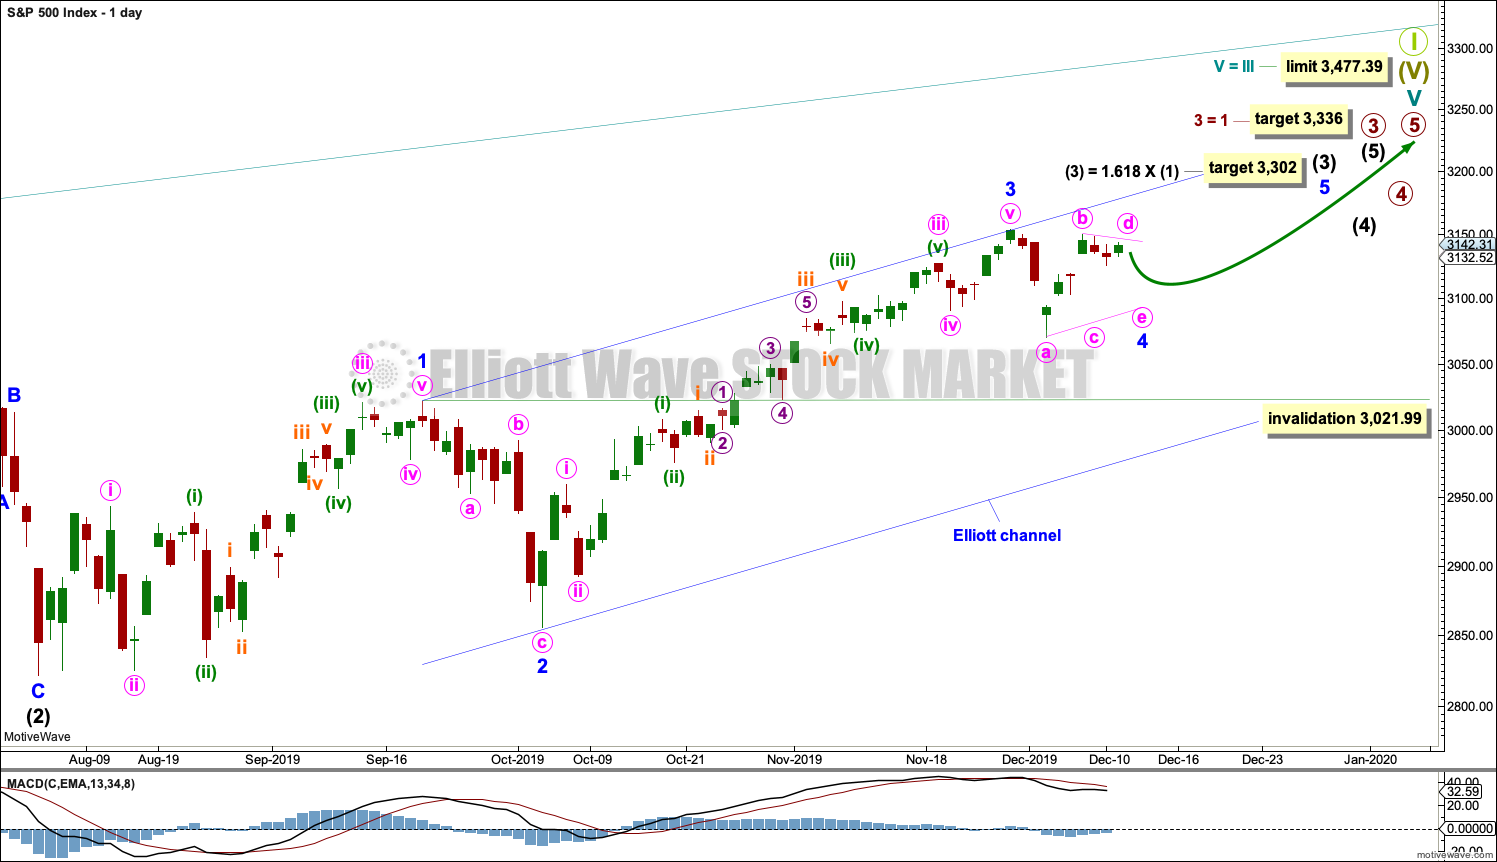
All of primary wave 3, intermediate wave (3) and minor wave 3 may only subdivide as impulses.
Minor wave 3 is now complete. Minor wave 3 shows an increase in momentum beyond minor wave 1; MACD supports this wave count.
Minor wave 2 was a sharp deep pullback, so minor wave 4 may be expected to be a very shallow sideways consolidation to exhibit alternation. Minor wave 2 lasted 2 weeks. Minor wave 4 may be longer lasting. It may continue now for another two weeks or so. When second waves subdivide as zigzags and their counterpart fourth waves subdivide as either a combination, flat or triangle, the fourth wave may be longer lasting than the second and the wave count may still have good visual proportion.
Minor wave 4 may not move into minor wave 1 price territory below 3,021.99.
Intermediate wave (3) must move far enough above the end of intermediate wave (1) to then allow intermediate wave (4) to unfold and remain above intermediate wave (1) price territory. While intermediate wave (3) has now moved beyond the end of intermediate wave (1), meeting a core Elliott wave rule, it still needs to continue higher to give room for intermediate wave (4).
The target for intermediate wave (3) fits with a target calculated for minor wave 3.
Draw an Elliott channel now about intermediate wave (3) using Elliott’s first technique: draw the first trend line from the ends of minor waves 1 to 3, then place a parallel copy on the end of minor wave 2. If it is time consuming enough, then minor wave 4 may find support about the lower edge of this blue channel (although it looks like it may end midway within the channel).
HOURLY CHART
Click chart to enlarge.
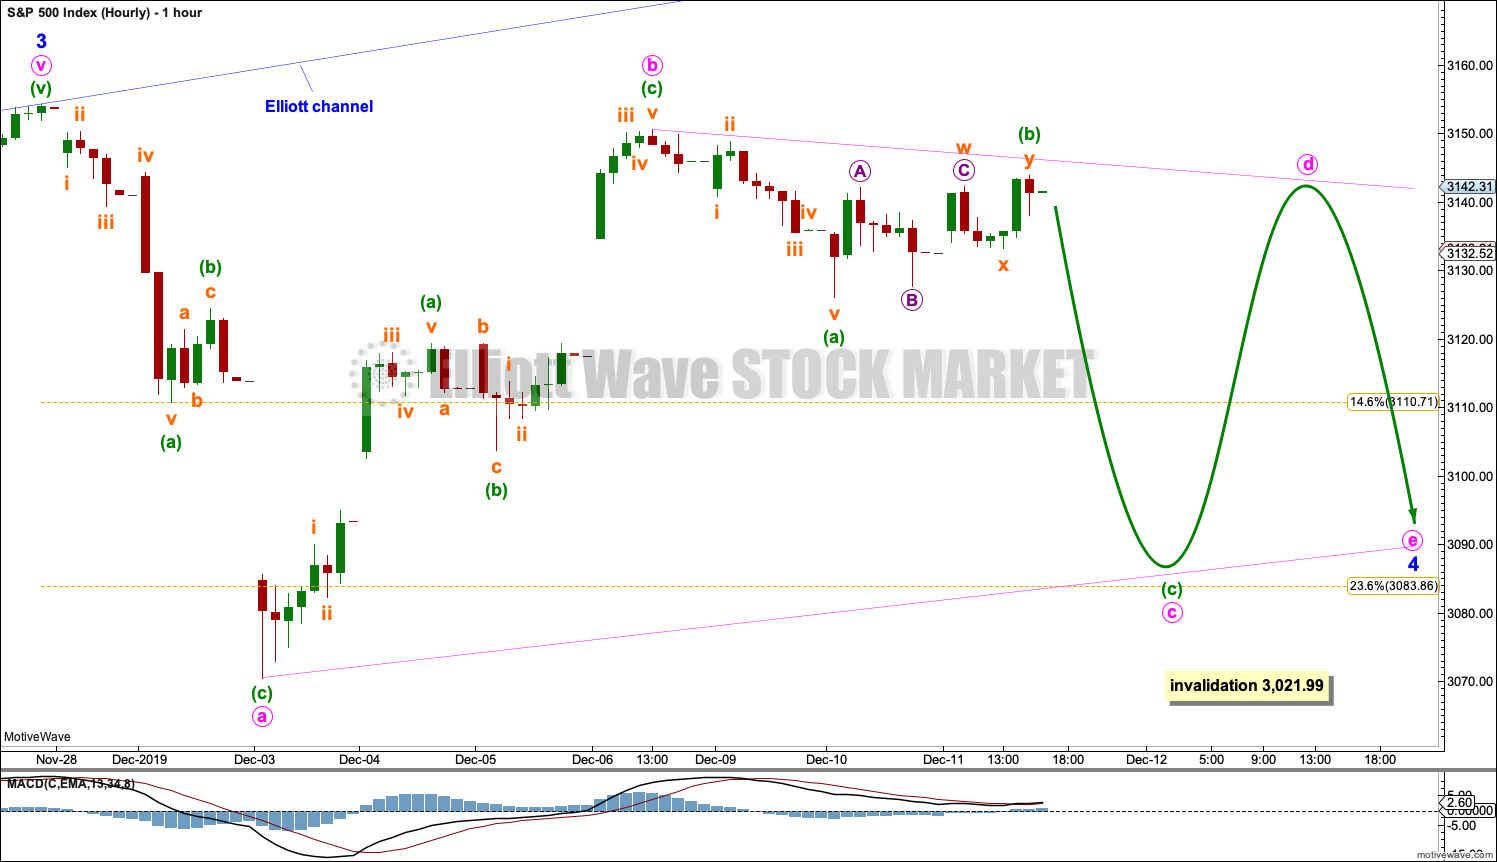
Minor wave 2 was a deep sharp zigzag lasting ten sessions. Given the guideline of alternation, minor wave 4 would least likely subdivide as a zigzag and may more likely subdivide as one of either a triangle, combination or flat correction. Triangles and combinations particularly are usually longer lasting structures than zigzags, so minor wave 4 may last longer than ten sessions. So far it has lasted nine sessions.
Minor wave 4 would most likely be shallow.
Minor wave 4 is labelled to consider the possibility of an Elliott wave triangle unfolding sideways. Within the triangle, minute waves a and b may now be complete. It remains possible that minute wave b may move a little higher and may make a new high above the start of minute wave a at 3,154.26 as in a running triangle.
If minor wave 4 continues as a triangle or combination, then it may last about three to four weeks at this stage.
There are still multiple structural possibilities for minor wave 4 as it continues. It may still unfold as a combination or flat correction and exhibit alternation with the zigzag of minor wave 2. Labelling within minor wave 4 will still probably change as it continues.
It is unlikely that minor wave 4 was over at the last low. It would be too brief in comparison to minor wave 2 and would exhibit no alternation in structure.
SECOND WAVE COUNT
WEEKLY CHART
Click chart to enlarge.
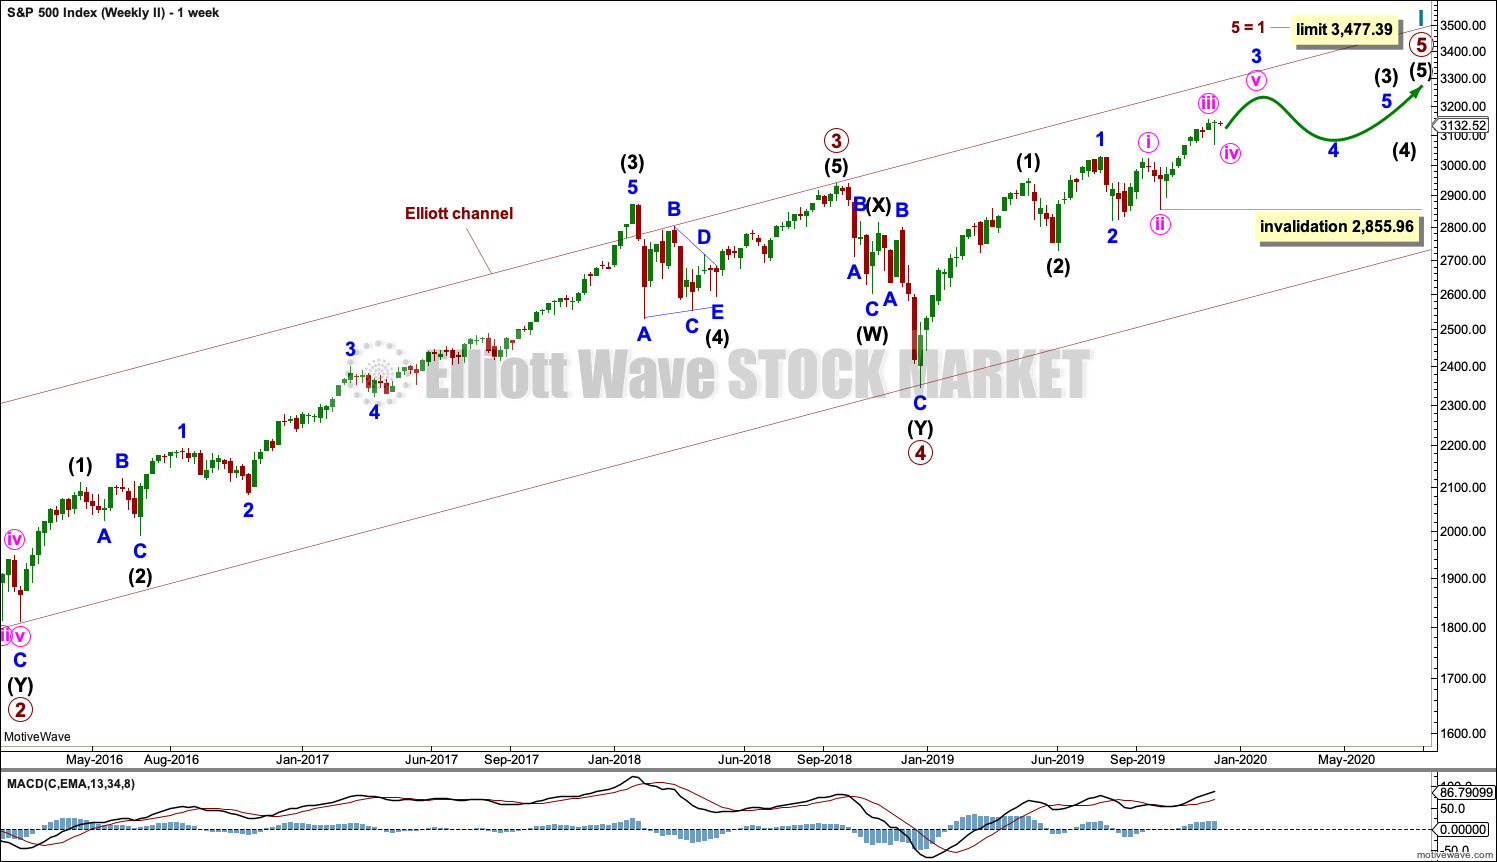
This weekly chart is almost identical to the first weekly chart, with the sole exception being the degree of labelling.
This weekly chart moves the degree of labelling for the impulse beginning in March 2009 all down one degree. This difference is best viewed on monthly charts.
The impulse is still viewed as nearing an end; a fifth wave is still seen as needing to complete higher. This wave count labels it primary wave 5.
Primary wave 5 may be subdividing as either an impulse, in the same way that cycle wave V is seen for the first weekly chart.
TECHNICAL ANALYSIS
MONTHLY CHART
Click chart to enlarge. Chart courtesy of StockCharts.com.
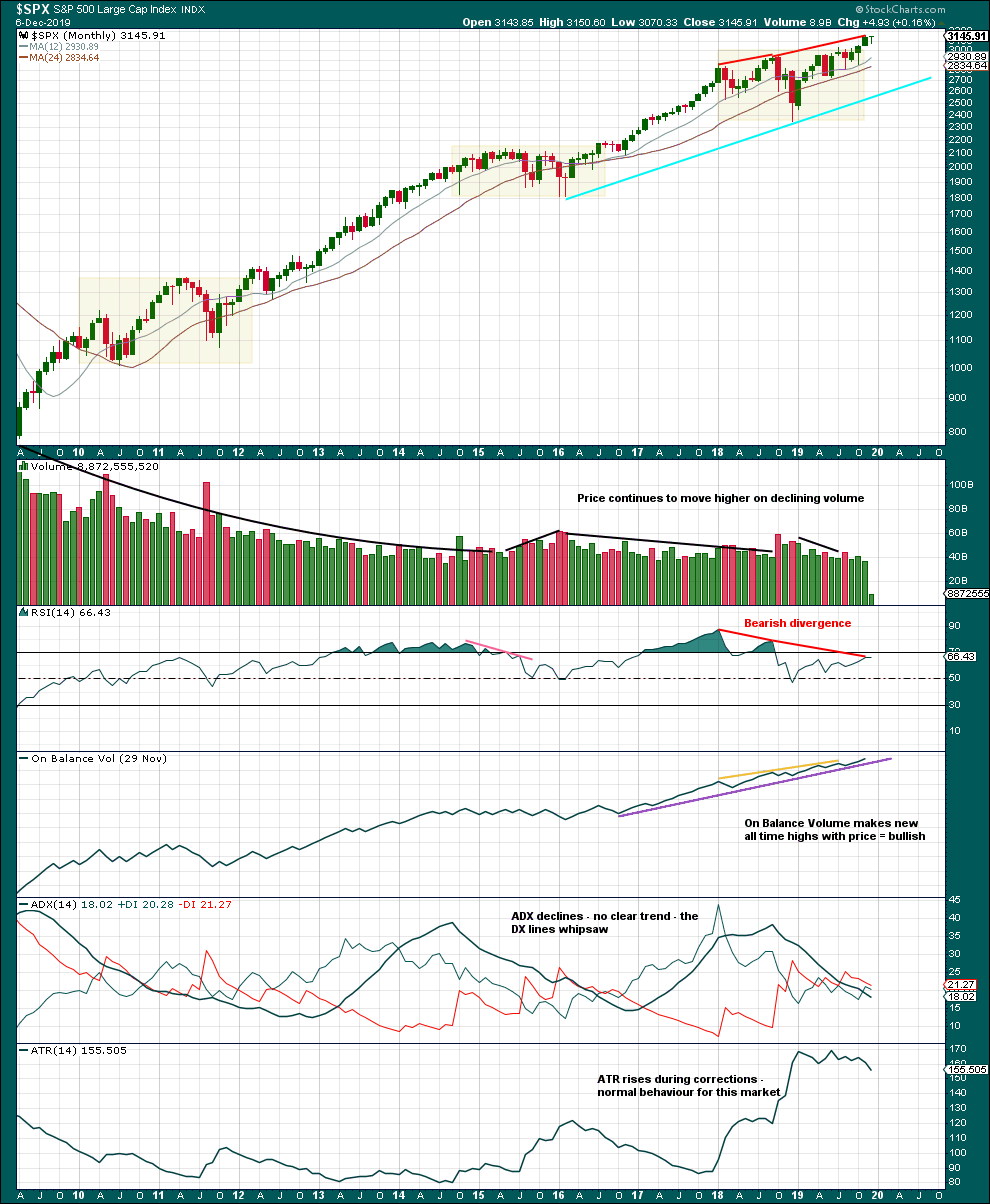
There are three large consolidations noted on this chart, in shaded areas. After a breakout from a multi-month consolidation, it is reasonable to expect a multi month bullish move may result.
This chart very clearly exhibits rising price on declining volume has now persisted for several years. A decline in volume this month, in current market conditions, is not of concern.
On Balance Volume supports the Elliott wave count.
WEEKLY CHART
Click chart to enlarge. Chart courtesy of StockCharts.com.
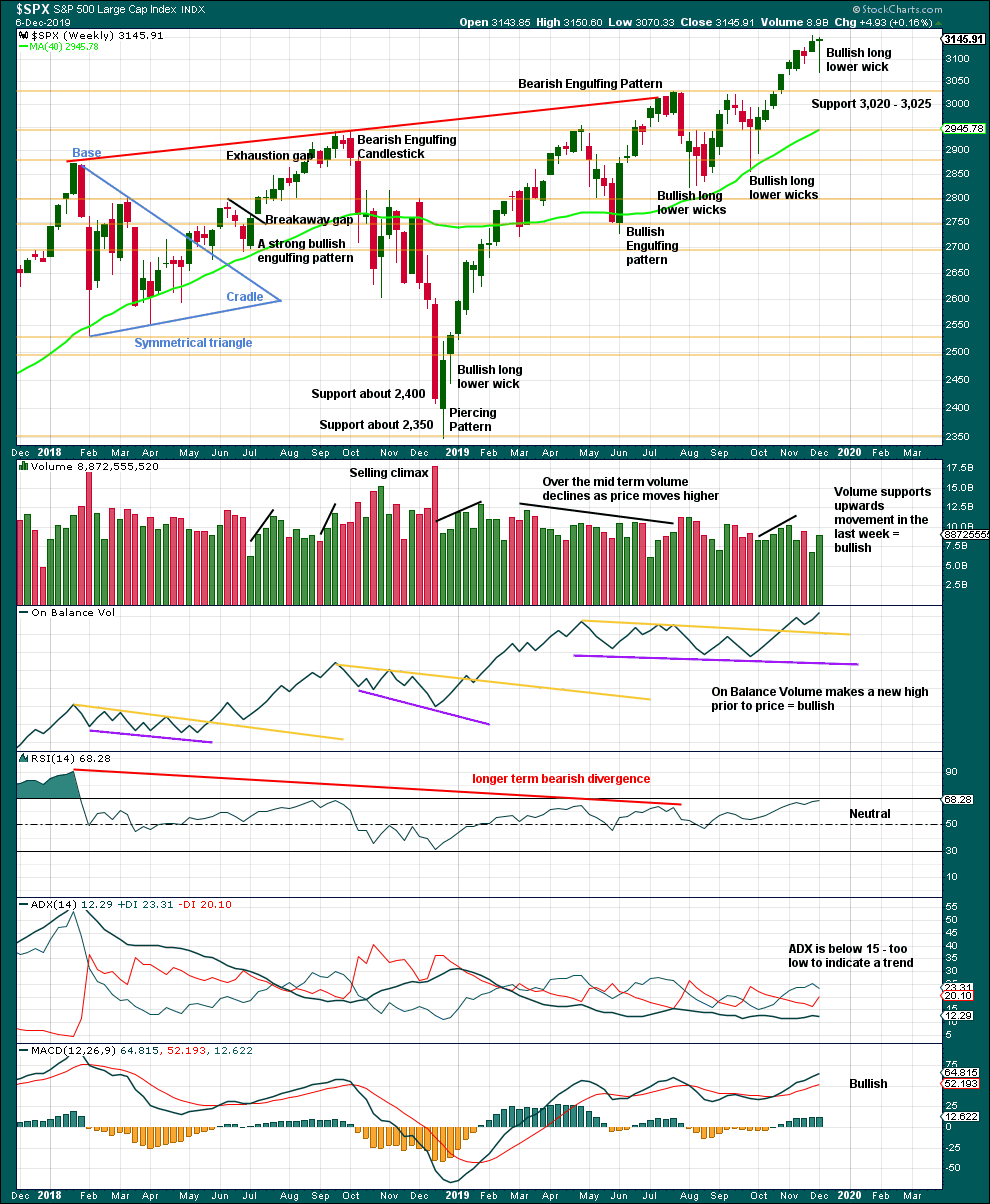
It is very clear that the S&P is in an upwards trend and the bull market is continuing. Price does not move in straight lines; there will be pullbacks and consolidations along the way.
Last week completes a bullish candlestick, which suggests more upwards movement next week.
DAILY CHART
Click chart to enlarge. Chart courtesy of StockCharts.com.
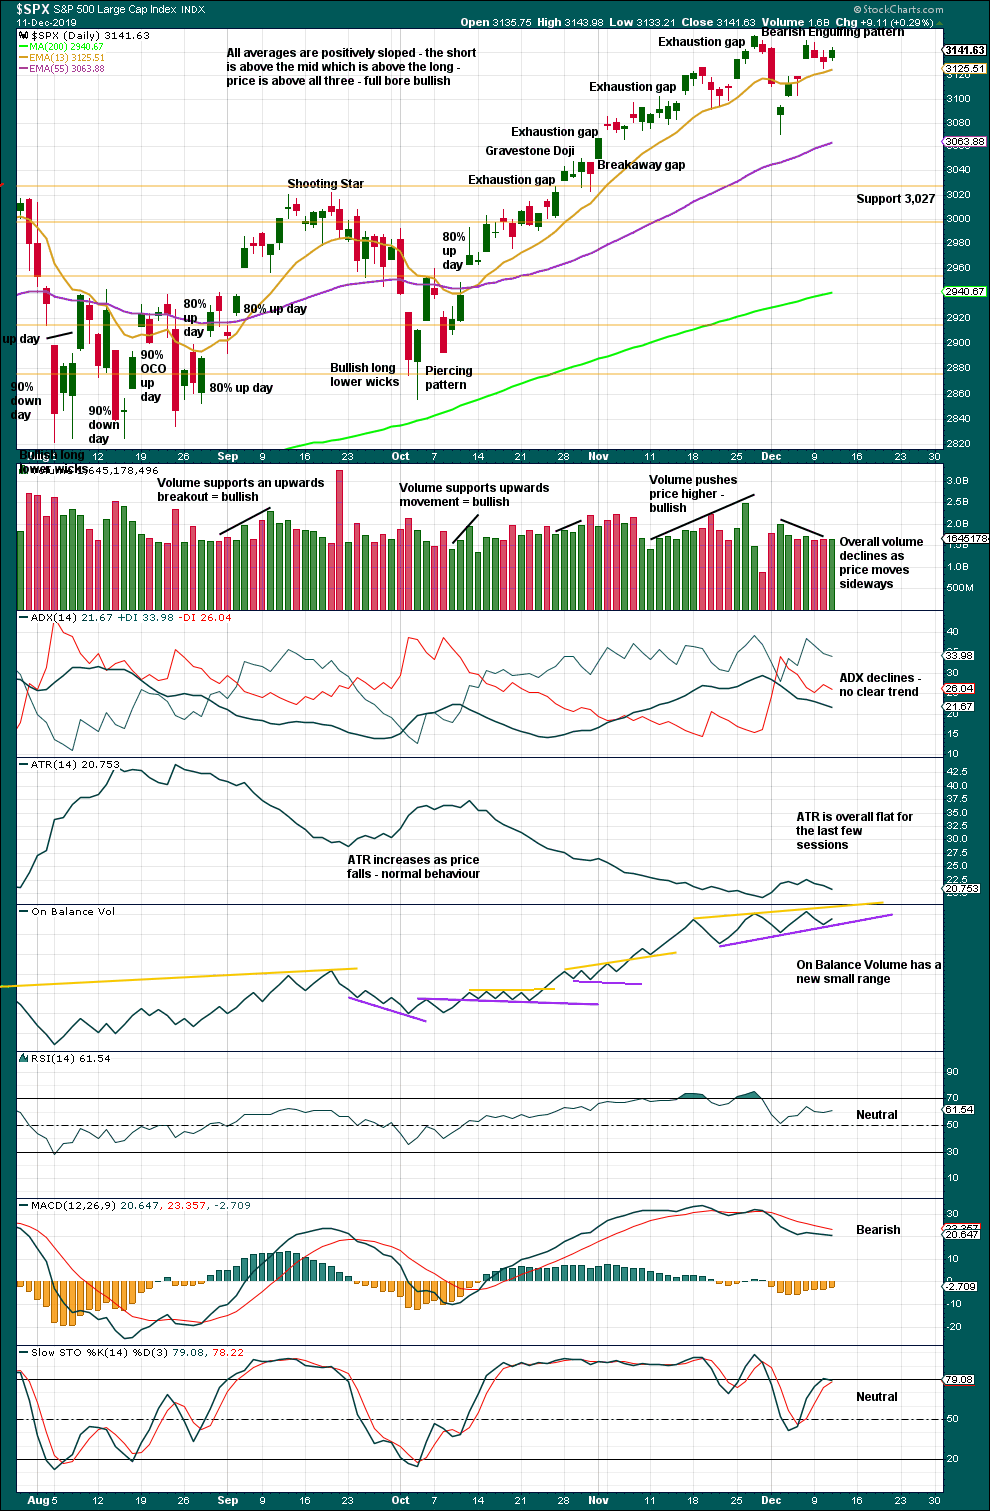
There is an upwards trend in place. There will be corrections along the way.
The lack of strength off the low last week is suspicious. Upwards days off the lows did not complete an 80% up day nor two back to back 70% up days. This may be resolved by some sideways movement. After three small range inside days, this view is unchanged.
If price gaps up with support from volume to make new all time highs, then the small pullback may be considered complete.
BREADTH – AD LINE
WEEKLY CHART
Click chart to enlarge. Chart courtesy of StockCharts.com. So that colour blind members are included, bearish signals
will be noted with blue and bullish signals with yellow.
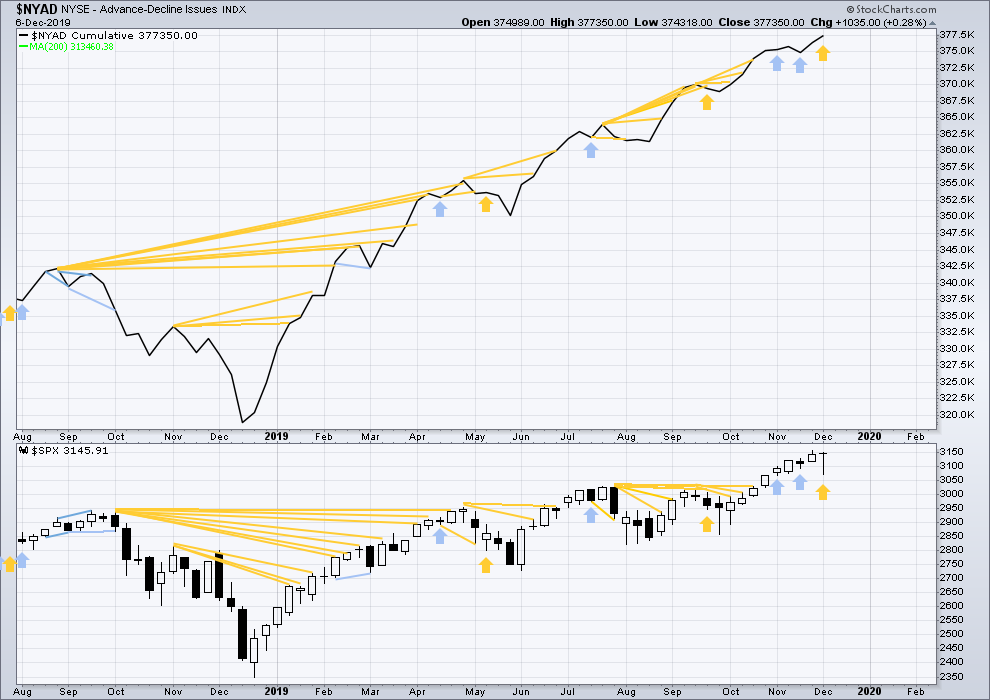
Bear markets from the Great Depression and onwards have been preceded by an average minimum of 4 months divergence between price and the AD line with only two exceptions in 1946 and 1976. With the AD line making new all time highs last week, the end of this bull market and the start of a new bear market is very likely a minimum of 4 months away, which is mid March 2020.
In all bear markets in the last 90 years there is some positive correlation (0.6022) between the length of bearish divergence and the depth of the following bear market. No to little divergence is correlated with more shallow bear markets. Longer divergence is correlated with deeper bear markets.
If a bear market does develop here, it comes after no bearish divergence. It would therefore more likely be shallow.
All of small, mid and large caps have made new swing highs above the prior swing high on the 13th of September, but only large caps have made new all time highs. This upwards movement appears to be mostly driven by large caps, which is a feature of aged bull markets. This bull market at over 10 years duration certainly fits the definition of aged.
Last week price has moved lower with a lower low and a lower high, but the AD line has moved higher. This divergence is bullish.
DAILY CHART
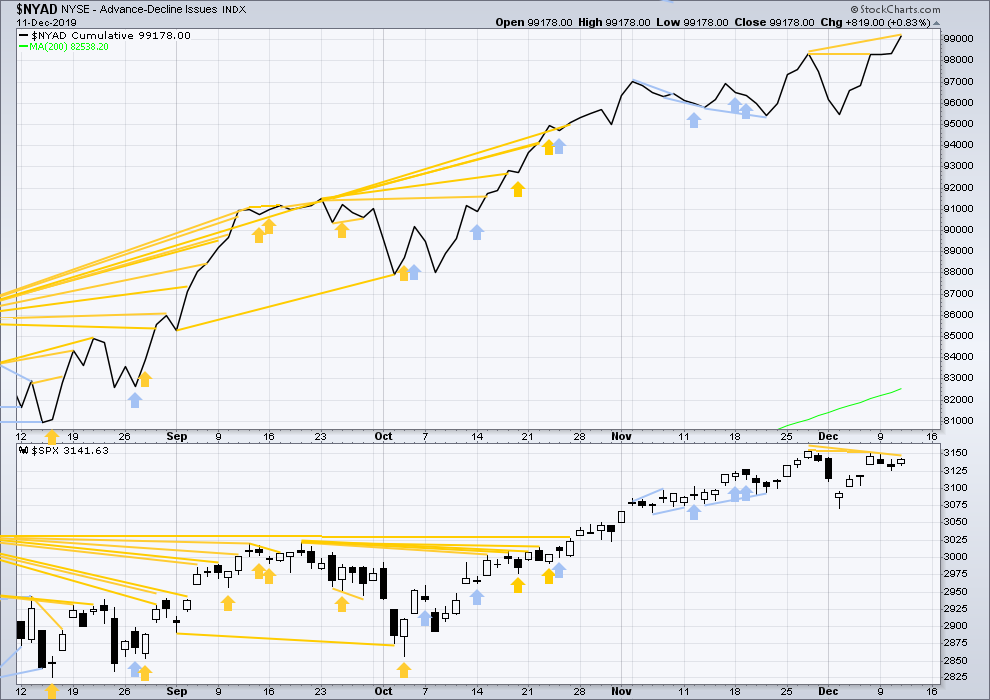
Click chart to enlarge. Chart courtesy of StockCharts.com. So that colour blind members are included, bearish signals
will be noted with blue and bullish signals with yellow.
Breadth should be read as a leading indicator.
On Friday price has moved higher but failed by a very small margin to make a new all time high. The AD line has moved higher to make a new all time high but only by a very small margin. This divergence is bullish, but it is weak.
Today the AD line has made a new all time high, but price has not. This divergence is bullish.
VOLATILITY – INVERTED VIX CHART
WEEKLY CHART
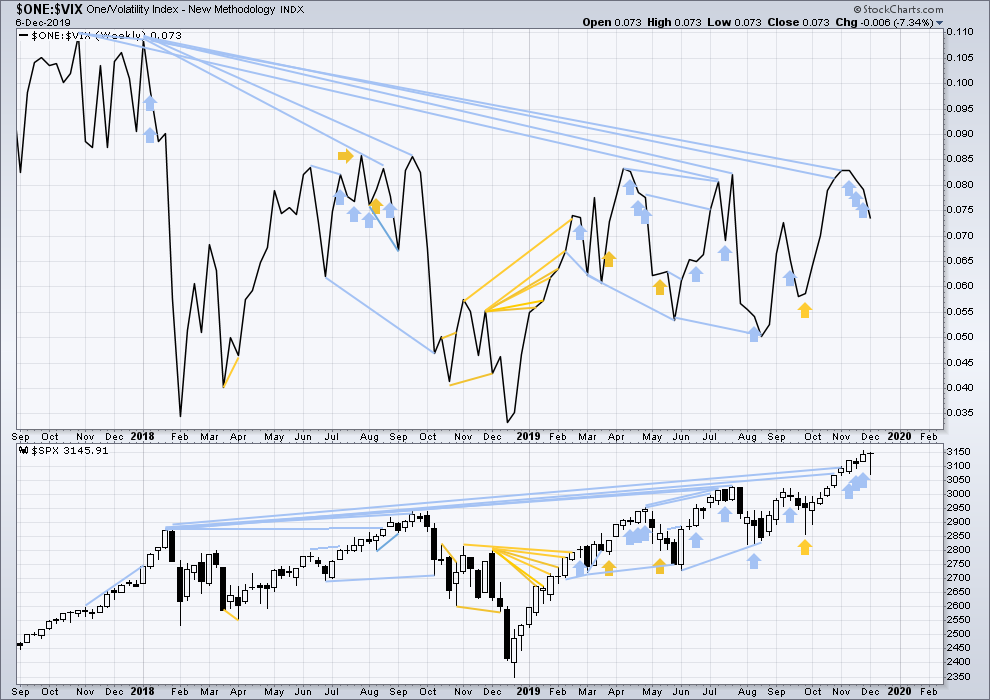
Click chart to enlarge. Chart courtesy of StockCharts.com. So that colour blind members are included, bearish signals
will be noted with blue and bullish signals with yellow.
The all time high for inverted VIX was on 30th October 2017. There is now over two years of bearish divergence between price and inverted VIX.
The rise in price is not coming with a normal corresponding decline in VIX; VIX remains elevated. This long-term divergence is bearish and may yet develop further as the bull market matures.
This divergence may be an early warning, a part of the process of a top developing that may take years. It may is clearly not useful in timing a trend change from bull to a fully fledged bear market.
Last week price and inverted VIX have both moved lower. There is no new short-term divergence.
DAILY CHART
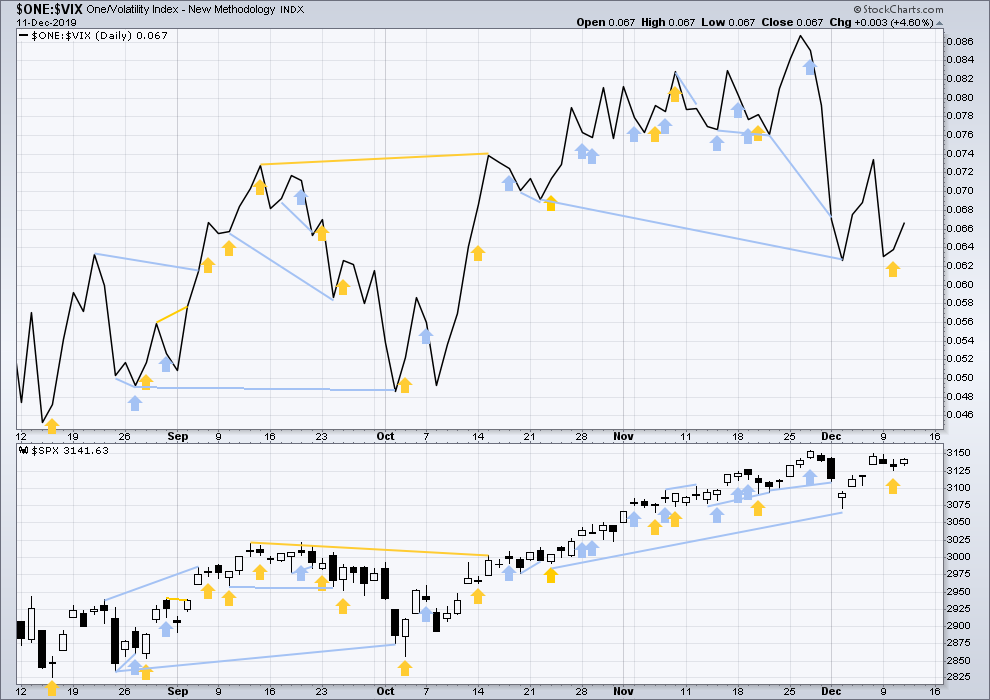
Click chart to enlarge. Chart courtesy of StockCharts.com. So that colour blind members are included, bearish signals
will be noted with blue and bullish signals with yellow.
Today both inverted VIX and price have moved higher. Price is close to its last all time high, but inverted VIX is a reasonable distance from its last swing high. Price is rising faster than inverted VIX.
DOW THEORY
Dow Theory confirmed a bear market in December 2018. This does not necessarily mean a bear market at Grand Super Cycle degree though; Dow Theory makes no comment on Elliott wave counts. On the 25th of August 2015 Dow Theory also confirmed a bear market. The Elliott wave count sees that as part of cycle wave II. After Dow Theory confirmation of a bear market in August 2015, price went on to make new all time highs and the bull market continued.
DJIA: 23,344.52 – a close on the 19th of December at 23,284.97 confirms a bear market.
DJT: 9,806.79 – price has closed below this point on the 13th of December.
S&P500: 2,532.69 – a close on the 19th of December at 2,506.96 provides support to a bear market conclusion.
Nasdaq: 6,630.67 – a close on the 19th of December at 6,618.86 provides support to a bear market conclusion.
With all the indices having moved higher following a Dow Theory bear market confirmation, Dow Theory would confirm a bull market if the following highs are made:
DJIA: 26,951.81 – a close above this point has been made on the 3rd of July 2019.
DJT: 11,623.58 – to date DJT has failed to confirm an ongoing bull market.
S&P500: 2,940.91 – a close above this point was made on the 29th of April 2019.
Nasdaq: 8,133.30 – a close above this point was made on the 26th of April 2019.
Published @ 06:16 p.m. EST.
—
Careful risk management protects your trading account(s).
Follow my two Golden Rules:
1. Always trade with stops.
2. Risk only 1-5% of equity on any one trade.
—
New updates to this analysis are in bold.
And upwards movement has good support from volume. I’m using the alternate below as the main count, and discarding the idea that minor 4 has arrived.
Alternatively, on a 2 hour chart, minor 3 could be incomplete and minor 4 yet to begin.
Hourly chart updated:
If there is any weakness; a lack of volume, divergence with price and any one of On Balance Volume, the AD line or RSI then this wave count may be correct.
Minor 4 could be an expanded flat. It could still also be a running triangle or a combination.
Thank you, Lara. I expected a pretty deep re-trace of this morning’s sudden upward thrust, and managed to grab a nice profit from it. But now what? Your two alternates alert us what to watch for.
As always, I appreciate your excellent guidance!
Well it could easily be an expanded flat with target at 3040… UK election results tonight… be careful
yeah, i like this
Hmm action seems a bit suspicious of expanded flat here… let’s see
an hourly close below the ATH and I might get heavy short
Looks like a zigzag down, B approaching completion…so yea.
I’m waiting for conclusion to the tariff question. The longer they don’t say they are off, the more chance they are on. In which case, oh yea!
Kevin, it seems 5 wave down and now correcting in wave 2, so possible but doesn’t look convincing breakout
Now we’ve got a break to new ATH, a test of the ATH…and a move up and off it.
Up and away?
Exciting day after a week or two of iv wave!
I’m sure everyone’s aware it’s a big and nominal risk on day: bonds and gold slammed down, equities up, oil up, US$ up.
And the reason why it stopped exactly where it did this morning is due to this long-term resistance from beginning of 2019 which I mentioned earlier (see the chart).
Note: if an actual China-US trade deal of some form gets announced today/tomorrow, we might see another 1-2% spike up very quickly.
If on the other hand the tweet of “deal is close” proves to be a ploy and the tariffs on the 15th are announced as going ahead…we could see a 1-2% sell of in quick order too.
And perhaps the most likely…”no deal yet but we agree to delay tariffs”, in which case no big spike moves I would think. Though one could argue the jump today anticipates a deal being announced, and a “not yet” statement will drive the market back down.
The situation is not stable, IMO.
Kevin, my statement about the Minor 3 target of 3179 is from Lara. She showed this target for several months and only relatively recently said Minor 3 “may” be completed at 3154.
Aiiiichh!!! My TLT butterfly expiring next Friday was setting up PERFECT…until today. Huge “risk on” day, and bonds are falling like a rock. Had to bail with a couple $’s loss; can’t ride a ‘fly down one of the wings, the dark side of huge losses lies down that path. So sad. But that’s the feature of ‘flys, they are low probability spreads.
cant be a 5 up……. 3 is the shortest wave at this time, I’m shorting this until proven wrong…
Except when you look at /ES and see the “missing” overnight price action…maybe the proper count is more along these lines. And this is highly consistent as well with my RUT count.
Here’s my RUT view. RUT has turned for the moment like /ES has at my “next up” Fibonacci projection levels (blue dashed lines).
take a little profit here at the lower low, and then again as we approach the old ATH
second short profit taking
Well played sir! A nice sell off from the peak of the spike.
It seems to me that someone on this forum has said, “Surprises will be to the upside.” Hmmm.
I think the idea of a Minor 3 target at 3179 needs to be revisited. Early morning breath is quite positive. It also looks like volume could be good as well. Of course we need to wait to the close at the end of the day to be certain. But it looks very bullish to me right now.
Not sure where your 3179 comes from Rodney off hand, but I have a Fibonacci projection of a high potential swing pivot level at 3180 myself, so “yes”.
Part of me wants to start layering on sold put spreads under the averages for mid Jan expiry…but not if a minor 4 is going to start in a day or two!!! So I’m striving to keep my fingers away from that buy button…
Kevin, so to confirm what you are thinking: we are still in minor 3 which might be coming to an end at 3179 as we saw it came close today and minor 4 might be starting soon as we originally projected? So the last week’s 3 day retracement was minuette 4 instead as according to your chart posted earlier?
Maybe. Which is to say, don’t confuse my alternatives with “fact”. It’s all probabilistic, as long as its technically legitimate.
My alternate to Lara’s main is that minor 3 isn’t complete, and now is in minute v up. In which case, a conclusion to the minor 3 is somewhere in the not so distant future…and watch out because v waves can be extremely short! On the other hand, it appears to me that what we’ve seen so far is just minuette i of minute v, in which case, there a fair amount of time and price upward to go. But that’s pretty speculative.
Under Lara’s main, the minor 4 is over and this is the launch a minor 5, which in theory should be nominally at least around the length of minor 1, so quite a bit more upside to go. HOWEVER, the same awareness applies: 5 waves can be very, very short! Trading 5 waves is very tricky for that reason.
Hence, I’m taking a bit of a wait and see what develops, what Lara has to say end of day, and what happens tomorrow before considering significant new commitments.
Good point. But you think we are still in minor 3 and not minor 5 already as minor 4 might be over? As Kevin said let’s see what Lara posts, but I have also noticed that at this high rate of acceleration we are approaching long-term (monthly) Elliot channel resistance which Lara refers to on her monthly chart. And tomorrow’s that strong resistance line is at 3197-3200 level. So I wonder what happens when we hit that line? Should it be a big bounce back down – could that be an end of minor 5?
I a guessin’ the action over the next several days might be fast and furious…but in which direction I think is semi-random. I believe the trade deals news will drive it; the 15th is either a whole new raft of tariffs and an implicit “fail” to make progress, or, those tariffs are held back and an announcement (or tweet or chopper-talk or something) of progress and a hold on additional tariffs comes out. With the expected wham-bam action as a result.
I could be wrong, and we get more go nowhere meandering…but I think that’s over by Monday, latest. No time to snooze off here!
This continues to look like a valid (and short term bullish) alternate to me. And so far, the price action past the minute iv here looks impulsive to the upside, with a minuette i and ii in place, and a iii launching. This is /ES daily with overnight data.
Thursday/Friday should give some answers.
Do note the projection done around Nov 17 of a potential pivot high level for the move up. Exactly tagged and turned off of on Dec 2. Bingo. Love my Fibonacci fitting “technology”! New powerful juju (or gooblygook, as a trading friend likes to call my use of EW and Fibo structure analysis, lol!!)
Maybe re the minute iv low, but I’m having problems with the hourly breakdown from the Nov 10 low trying to see 5 waves up without fudging/overlaps.
Looks more like 3 up but even then it’s not clear.
Maybe a combination for Minor 4
Looks like “heads” has come up, “positive news” re: trade. And a slamming “upside surprise”.
HOWEVER, the decision meeting on moving ahead with Dec 15 tariffs hasn’t happened yet! And it would shock me ZERO that the tweet that drove this market spike up is countered with an announcement later that the tariffs will go into effect. In fact I almost expect it. This may very well be a very large political head fake to do exactly what it is doing: drive the markets one way first in an attempt to mitigate the impact of what’s coming in a few hours.
Happy I took off my small short term shorts yesterday regardless!!
So are we now officially in minor 5 now on the big volume spike and breaking ATH as Lara mentioned?
Only one person around here speaks “officially”. And…the day isn’t over! More surprises are possible.
I am challenged to see the correction price just went through as proportional to the minor 2, at this point, hence my alternate.
First???
welcome back
sleepin’…(literally).