
The upwards trend was expected to resume this week. A new all time high and a strong close is exactly what was expected. The Elliott wave structure unfolds as expected and the target so far remains the same.
Summary: The next target at 3,179 is where minor wave 4 may begin (expect it to be very shallow). Thereafter, the next target is at 3,302 and then 3,336.
Three large pullbacks or consolidations during the next 1-2 years are expected: for minor wave 4, then intermediate (4), and then primary 4. Prior to each of these large corrections beginning, some weakness may begin to be evident.
The biggest picture, Grand Super Cycle analysis, is here.
Monthly charts were last published here, with video here. There are two further alternate monthly charts here, with video here.
ELLIOTT WAVE COUNTS
The two weekly Elliott wave counts below will be labelled First and Second. They may be about of even probability. When the fifth wave currently unfolding on weekly charts may be complete, then these two wave counts will diverge on the severity of the expected following bear market. To see an illustration of this future divergence monthly charts should be viewed.
FIRST WAVE COUNT
WEEKLY CHART
Click chart to enlarge.
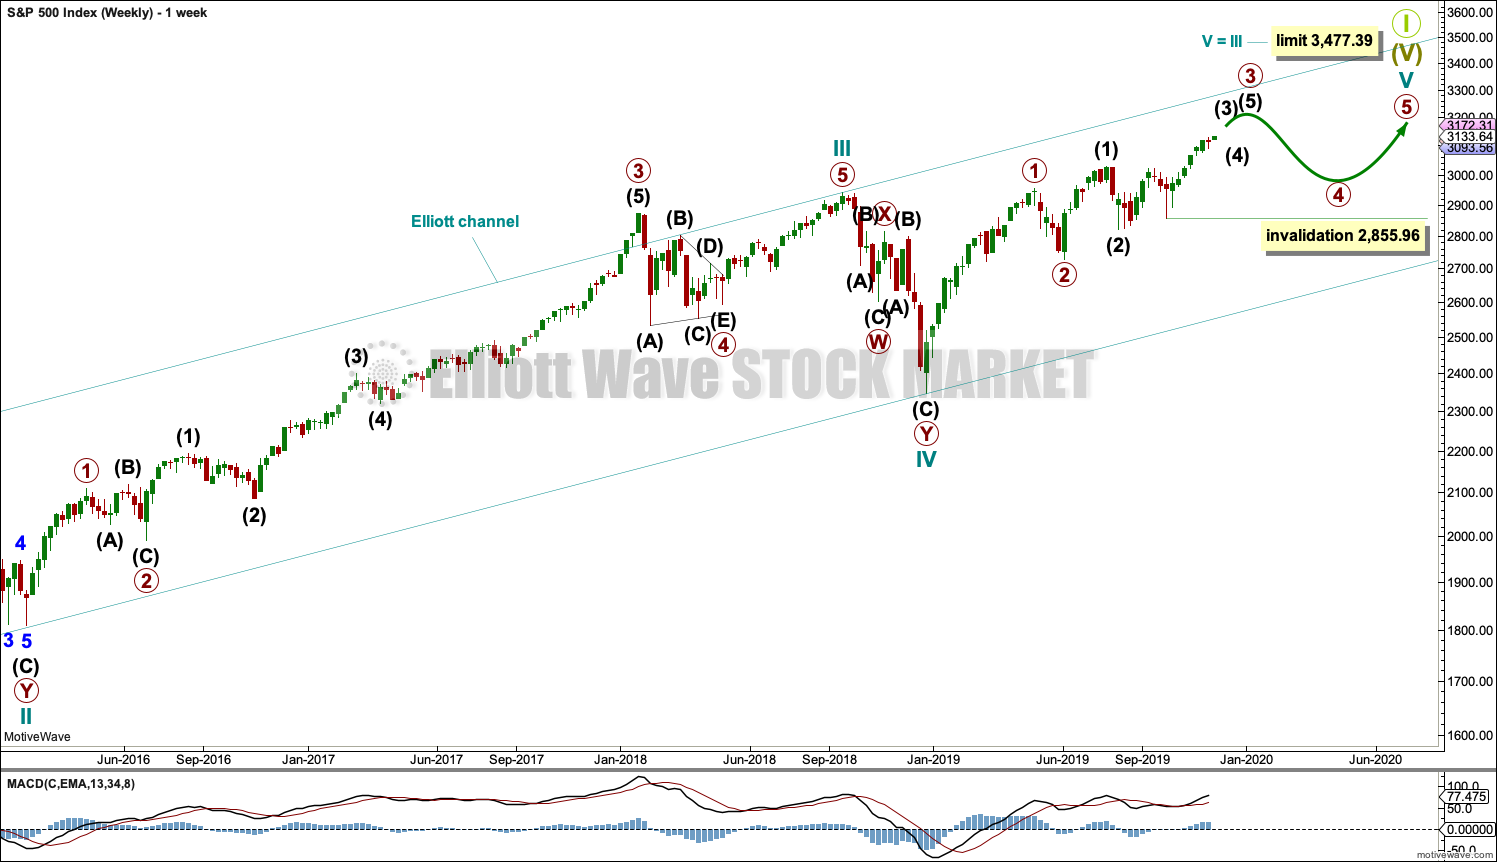
The basic Elliott wave structure consists of a five wave structure up followed by a three wave structure down (for a bull market). This wave count sees the bull market beginning in March 2009 as an incomplete five wave impulse and now within the last fifth wave, which is labelled cycle wave V. This impulse is best viewed on monthly charts. The weekly chart focusses on the end of it.
Elliott wave is fractal. This fifth wave labelled cycle wave V may end a larger fifth wave labelled Super Cycle wave (V), which may end a larger first wave labelled Grand Super Cycle wave I.
The teal Elliott channel is drawn using Elliott’s first technique about the impulse of Super Cycle wave (V). Draw the first trend line from the end of cycle wave I (off to the left of the chart, the weekly candlestick beginning 30th November 2014) to the end of cycle wave III, then place a parallel copy on the end of cycle wave II. This channel perfectly shows where cycle wave IV ended at support. The strongest portion of cycle wave III, the end of primary wave 3, overshoots the upper edge of the channel. This is a typical look for a third wave and suggests the channel is drawn correctly and the way the impulse is counted is correct.
Within Super Cycle wave (V), cycle wave III is shorter than cycle wave I. A core Elliott wave rule states that a third wave may never be the shortest. For this rule to be met in this instance, cycle wave V may not be longer in length than cycle wave III. This limit is at 3,477.39.
Cycle wave V may subdivide either as an impulse or an ending diagonal. Impulses are much more common. An alternate wave count, which looked at the possibility of a diagonal unfolding, has been invalidated with a new all time high.
At this stage, cycle wave V may take another one to two or so years to complete.
The daily chart below will focus on movement from the end of intermediate wave (1) within primary wave 3.
In historic analysis, two further monthly charts have been published that do not have a limit to upwards movement and are more bullish than this wave count. Members are encouraged to consider those possibilities (links below summary) alongside the wave counts presented on a daily and weekly basis.
Within cycle wave V, primary waves 1 and 2 may be complete. Within primary wave 3, intermediate waves (1) and (2) may be complete. Within the middle of intermediate wave (3), no second wave correction may move beyond its start below 2,855.96.
DAILY CHART
Click chart to enlarge.
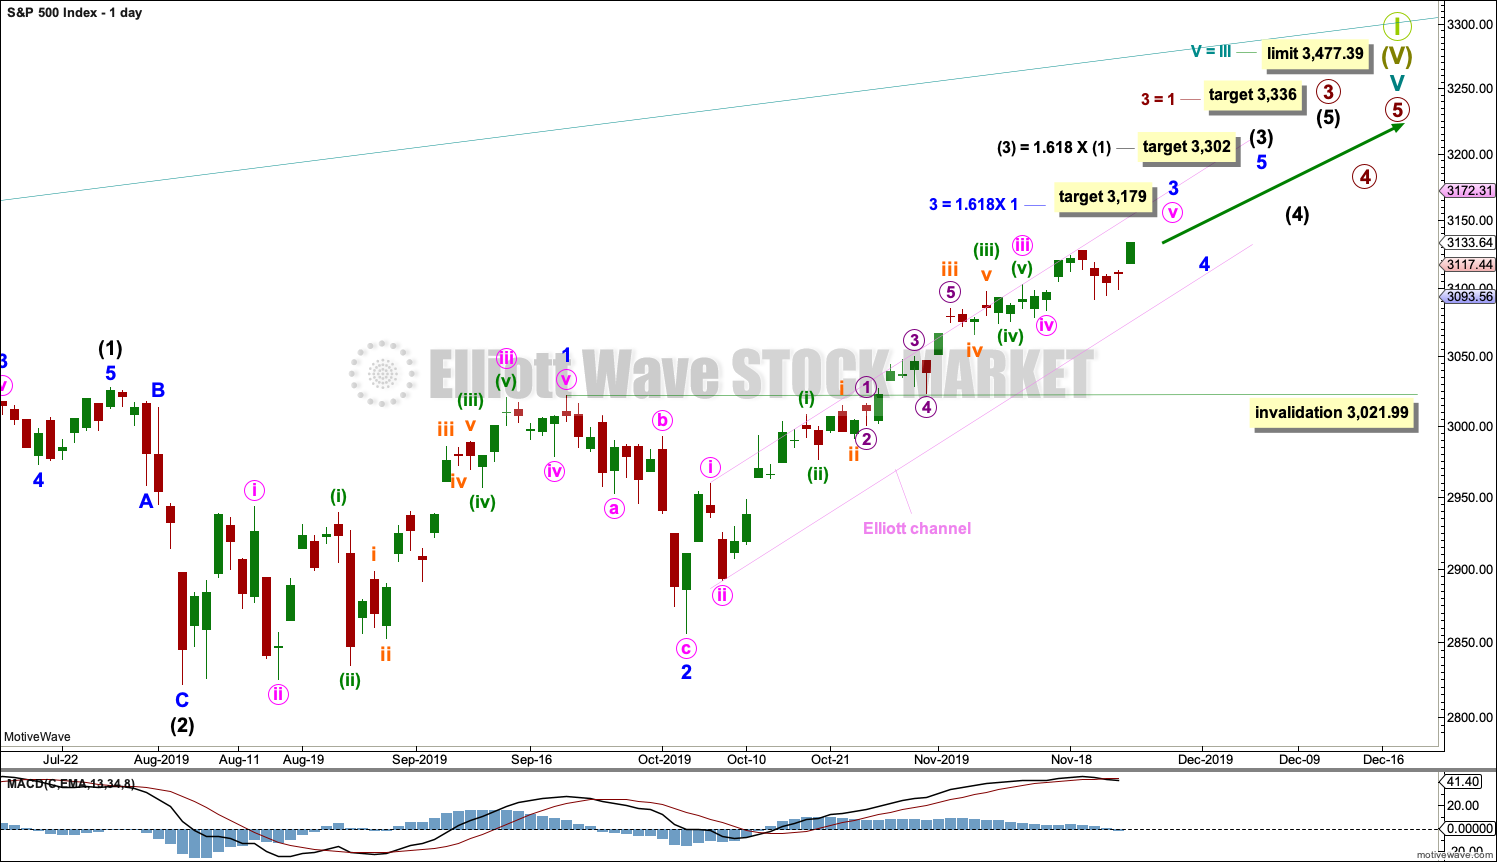
All of primary wave 3, intermediate wave (3) and minor wave 3 may only subdivide as impulses.
Minor wave 3 may be underway and may be nearing its end. Minor wave 3 now shows an increase in momentum beyond minor wave 1; MACD supports this wave count.
Minor wave 4 may not move into minor wave 1 price territory below 3,021.99.
Intermediate wave (3) must move far enough above the end of intermediate wave (1) to then allow intermediate wave (4) to unfold and remain above intermediate wave (1) price territory. While intermediate wave (3) has now moved beyond the end of intermediate wave (1), meeting a core Elliott wave rule, it still needs to continue higher to give room for intermediate wave (4).
The target for intermediate wave (3) fits with a target calculated for minor wave 3.
Minor wave 2 was a sharp deep pullback, so when it arrives minor wave 4 may be expected to be a very shallow sideways consolidation to exhibit alternation. Minor wave 2 lasted 2 weeks, so minor wave 4 may be about the same duration to have good proportion.
Draw an Elliott channel about minor wave 3 using Elliott’s first technique: draw the first trend line from the end of minute wave i to minute wave iii, then place a parallel copy on the end of minute wave ii. Copy this channel over to the hourly chart. The channel may show where minute wave v finds support and resistance along the way up. Last week price has reacted down from the upper edge of the channel.
HOURLY CHART
Click chart to enlarge.
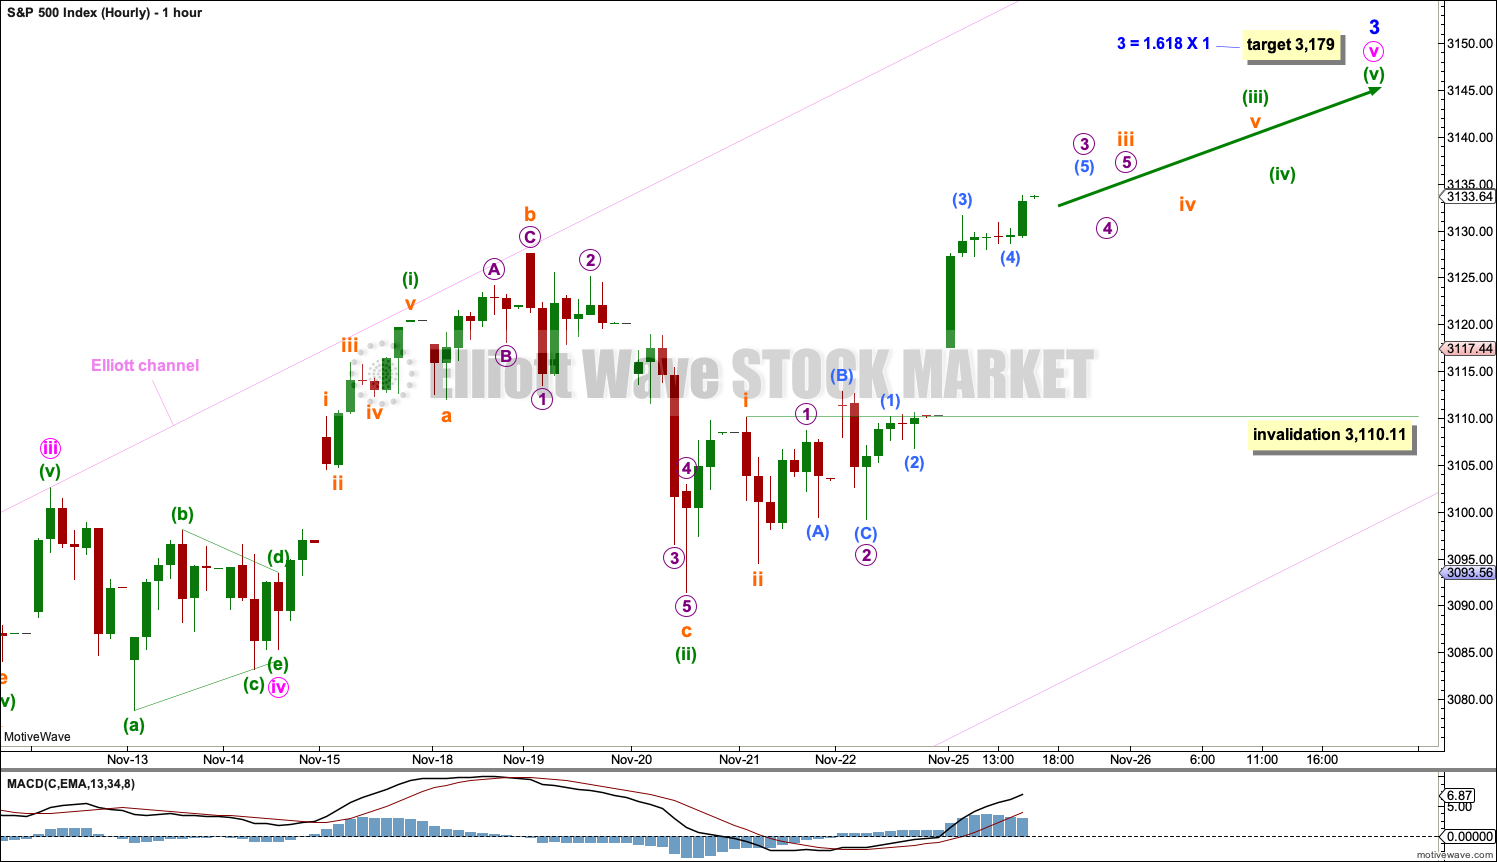
Within minor wave 3, minute wave iv subdivides as a small triangle, and minute wave v has begun and may only subdivide as a five wave motive structure, either an impulse or an ending diagonal. Impulses are more common in fifth wave positions and that is what shall be expected unless overlapping suggests a diagonal.
Within minute wave v, minuette waves (i) and (ii) may be complete. Minuette wave (ii) may have completed as an expanded flat correction.
Minuette wave (iii) may only subdivide as an impulse. Within the impulse, subminuette wave iv may not move into subminuette wave i territory below 3,110.11.
Within the larger structure of minor wave 3 (best viewed on the daily chart now), minute wave i was relatively short and minute wave iii was a long extension. Two of the three actionary waves within an impulse may be extended, but not all three. Minute wave v may also be extending.
SECOND WAVE COUNT
WEEKLY CHART
Click chart to enlarge.
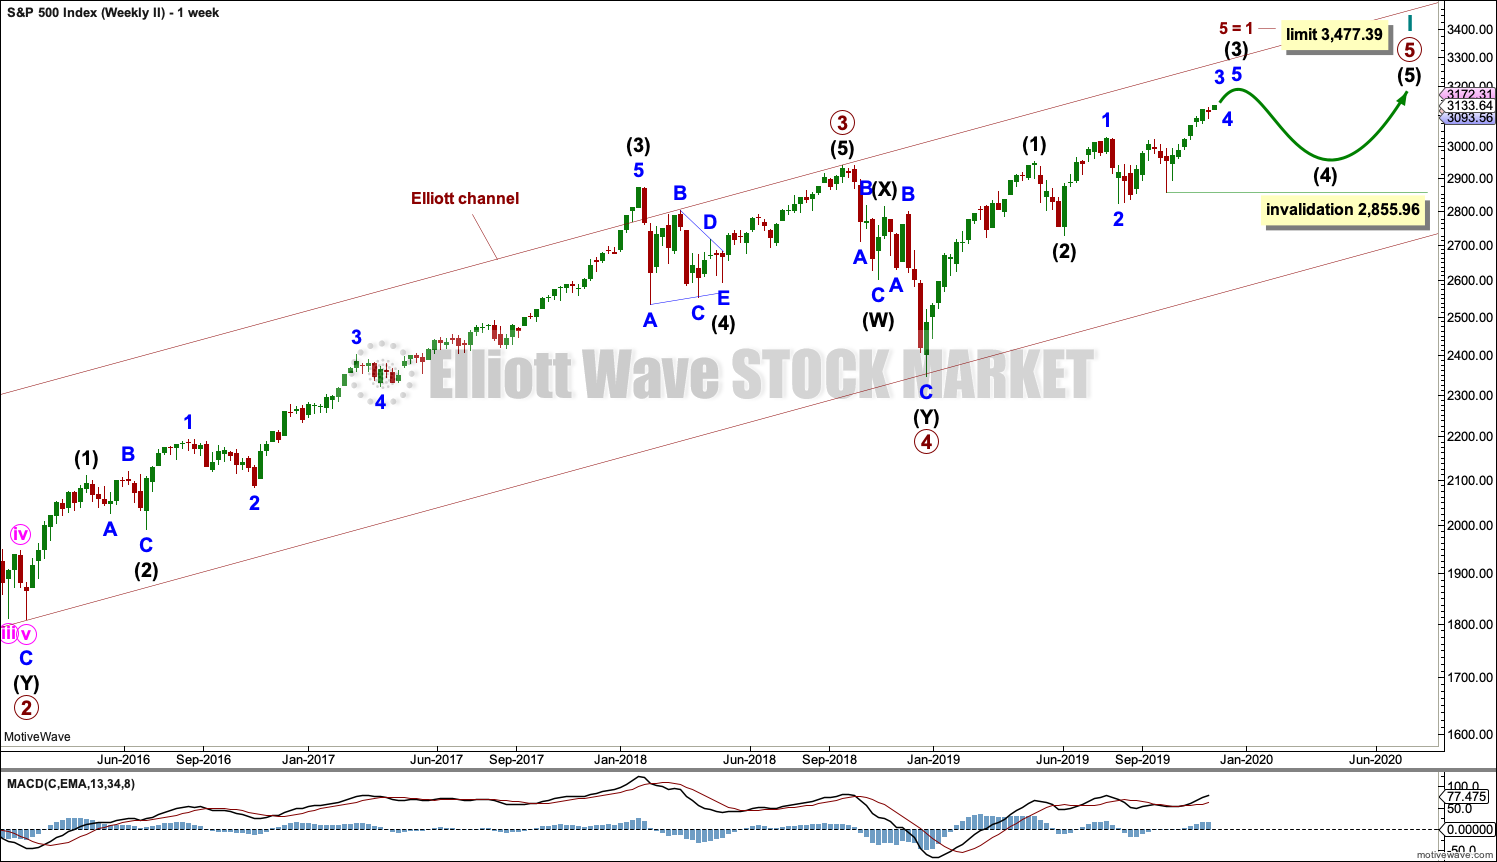
This weekly chart is almost identical to the first weekly chart, with the sole exception being the degree of labelling.
This weekly chart moves the degree of labelling for the impulse beginning in March 2009 all down one degree. This difference is best viewed on monthly charts.
The impulse is still viewed as nearing an end; a fifth wave is still seen as needing to complete higher. This wave count labels it primary wave 5.
Primary wave 5 may be subdividing as either an impulse, in the same way that cycle wave V is seen for the first weekly chart.
TECHNICAL ANALYSIS
WEEKLY CHART
Click chart to enlarge. Chart courtesy of StockCharts.com.
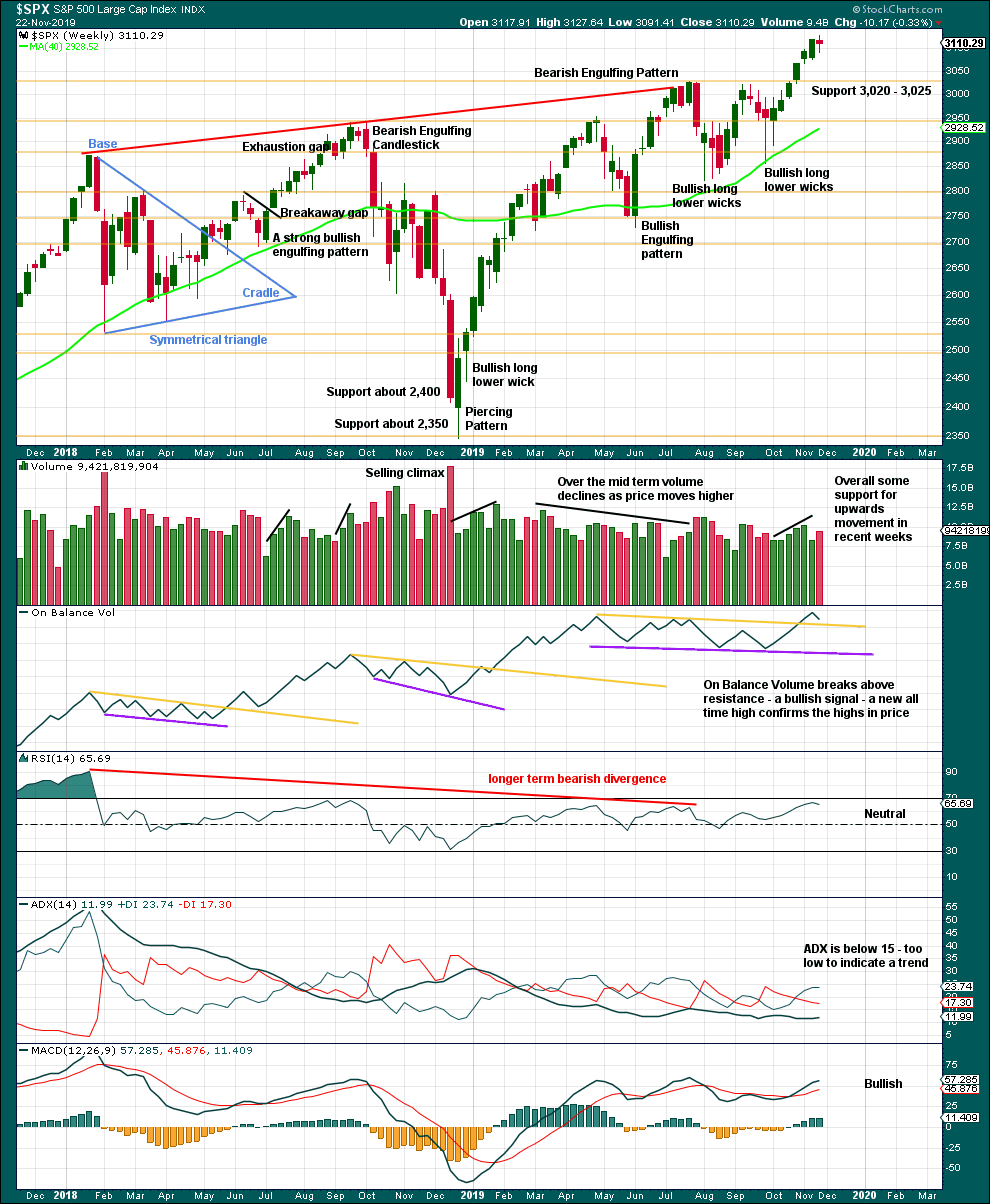
It is very clear that the S&P is in an upwards trend and the bull market is continuing. Price does not move in straight lines; there will be pullbacks and consolidations along the way.
Now that resistance has been overcome, energy has been released to the upside and there were six green weekly candlesticks in a row. Corrections are normal and to be expected; they may be more short term in nature at this stage.
Last week price has moved higher with a higher high and a higher low, although the candlestick has closed red. To judge the short-term volume profile last week it would be better to view daily volume.
DAILY CHART
Click chart to enlarge. Chart courtesy of StockCharts.com.
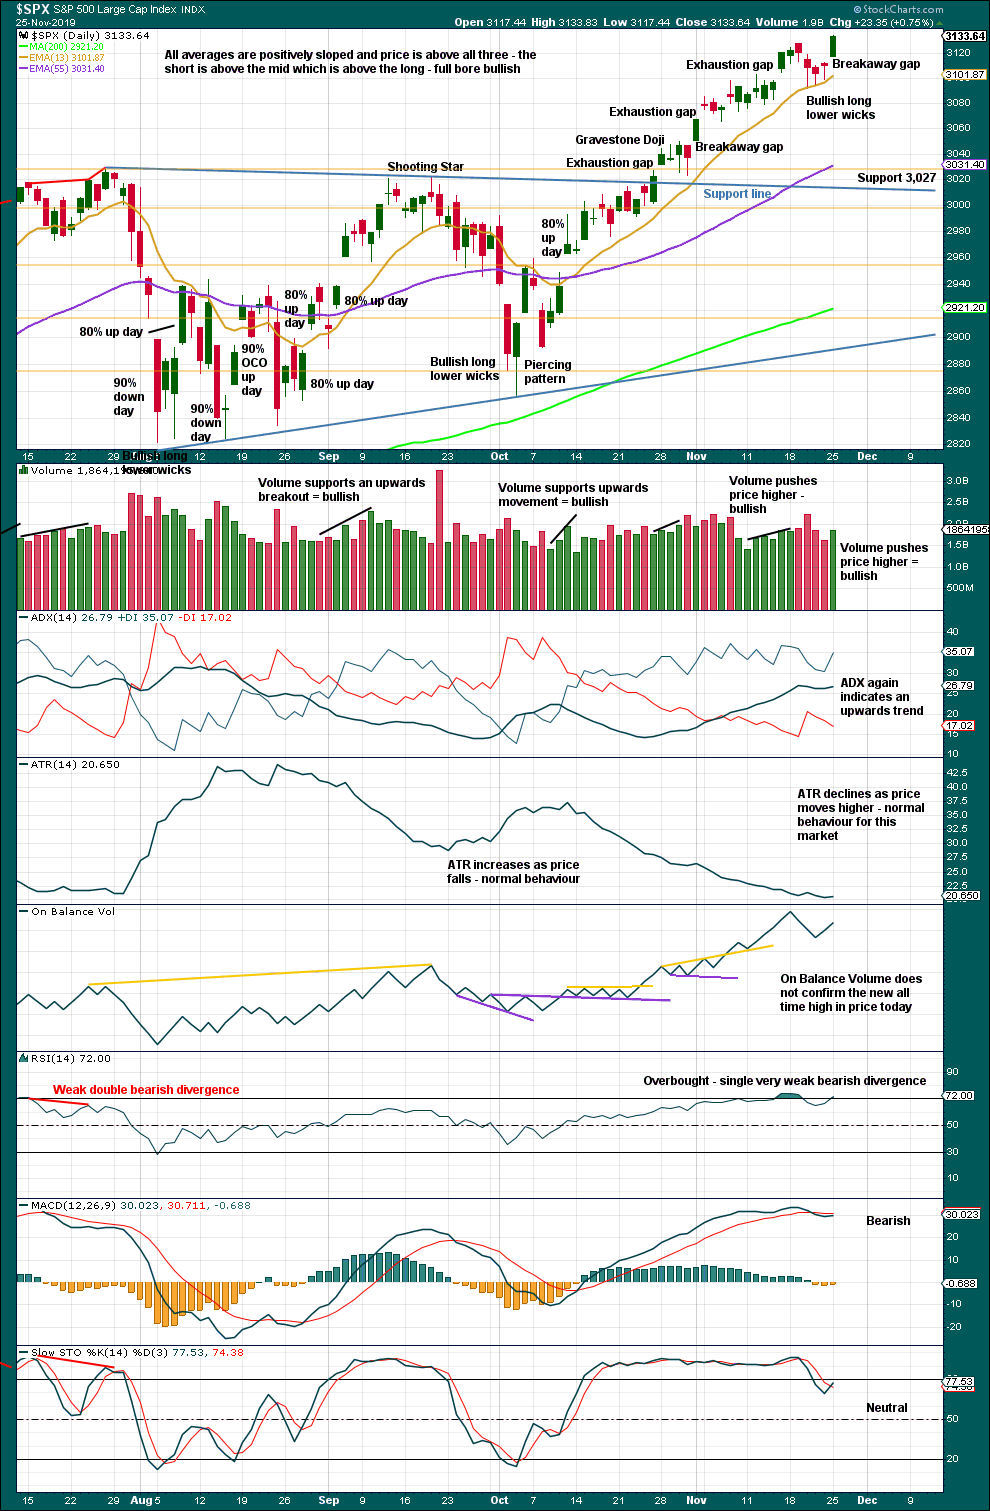
There is an upwards trend in place. There will be corrections along the way.
A breakaway gap today may offer support about 3,112.87.
Bearish divergence between price and On Balance Volume today is short term and weak; it may disappear. Bearish divergence between price and RSI is even weaker and more short term, so it will be given no weight.
When this market is in a bullish trend, RSI can reach deeply overbought and remain there for some weeks. This small pullback has brought RSI down from overbought back into neutral territory, but only just. There is again a little room for price to move higher.
BREADTH – AD LINE
WEEKLY CHART
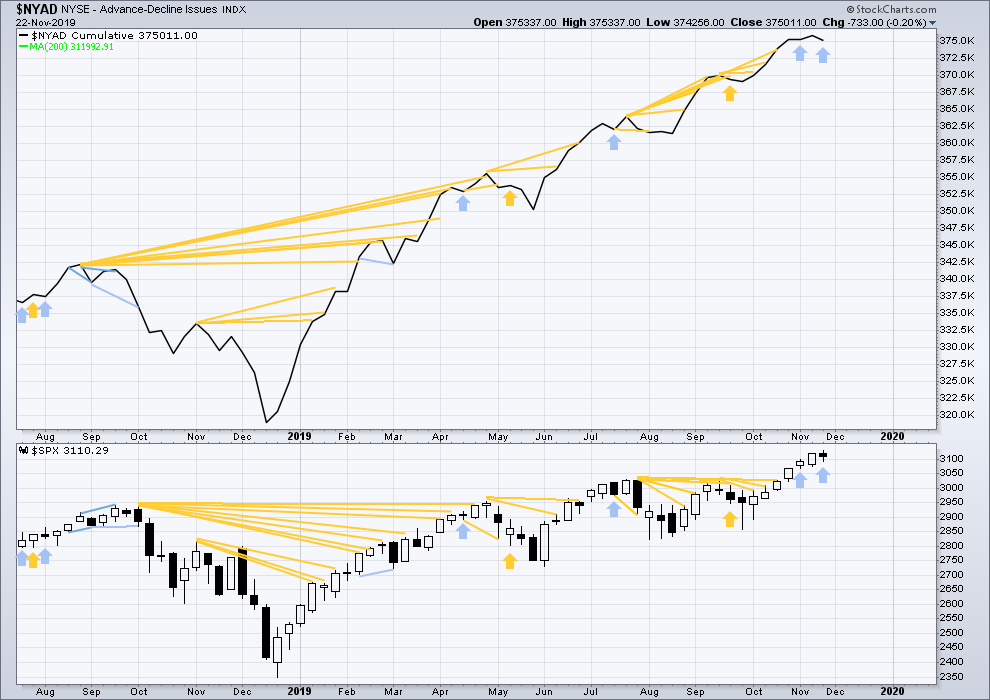
Click chart to enlarge. Chart courtesy of StockCharts.com. So that colour blind members are included, bearish signals
will be noted with blue and bullish signals with yellow.
Bear markets from the Great Depression and onwards have been preceded by an average minimum of 4 months divergence between price and the AD line with only two exceptions in 1946 and 1976. With the AD line making new all time highs last week, the end of this bull market and the start of a new bear market is very likely a minimum of 4 months away, which is mid March 2020.
In all bear markets in the last 90 years there is some positive correlation (0.6022) between the length of bearish divergence and the depth of the following bear market. No to little divergence is correlated with more shallow bear markets. Longer divergence is correlated with deeper bear markets.
If a bear market does develop here, it comes after no bearish divergence. It would therefore more likely be shallow.
All of small, mid and large caps have made new swing highs above the prior swing high on the 13th of September, but only large caps have made new all time highs. This upwards movement appears to be mostly driven by large caps, which is a feature of aged bull markets. This bull market at over 10 years duration certainly fits the definition of aged.
Mid and small caps have not yet made new all time highs.
Last week price has moved higher, but the AD line has moved slightly lower. This divergence is bearish for the short term.
DAILY CHART
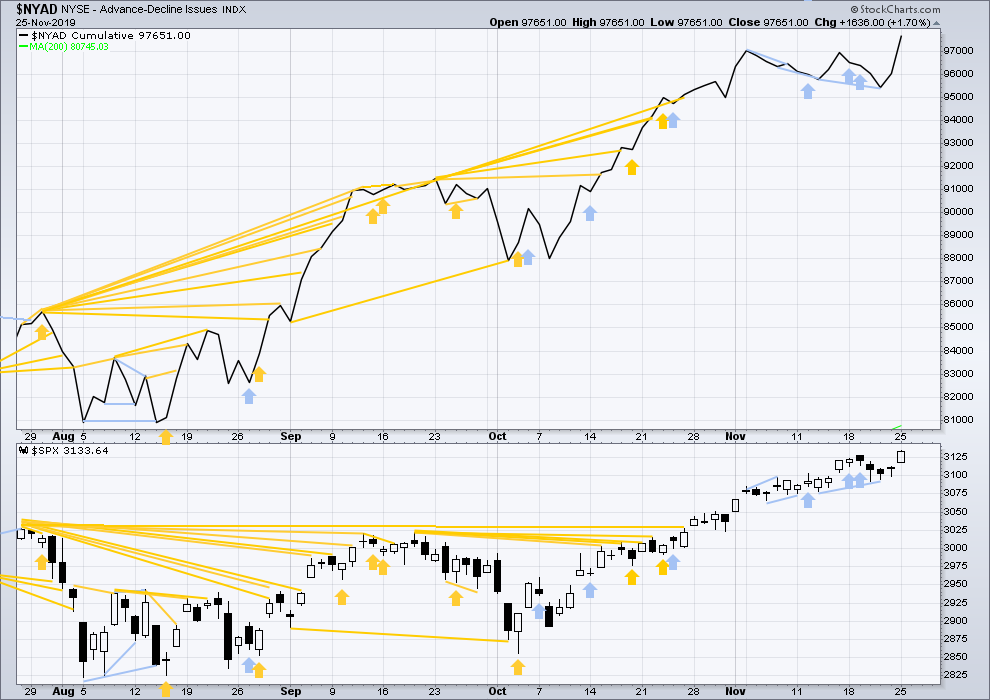
Click chart to enlarge. Chart courtesy of StockCharts.com. So that colour blind members are included, bearish signals
will be noted with blue and bullish signals with yellow.
Breadth should be read as a leading indicator.
Today both price and the AD line have made new all time highs. There is strong support from rising market breadth, which is bullish and strongly supports the Elliott wave count.
VOLATILITY – INVERTED VIX CHART
WEEKLY CHART
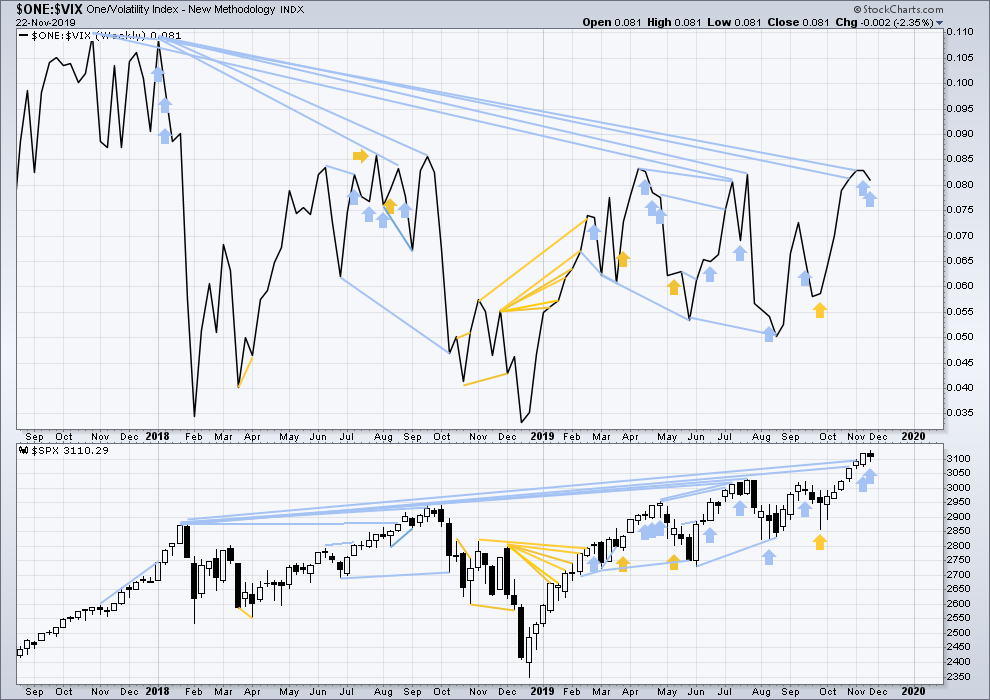
Click chart to enlarge. Chart courtesy of StockCharts.com. So that colour blind members are included, bearish signals
will be noted with blue and bullish signals with yellow.
The all time high for inverted VIX was on 30th October 2017. There is now over two years of bearish divergence between price and inverted VIX.
The rise in price is not coming with a normal corresponding decline in VIX; VIX remains elevated. This long-term divergence is bearish and may yet develop further as the bull market matures.
This divergence may be an early warning, a part of the process of a top developing that may take years. It may is clearly not useful in timing a trend change from bull to a fully fledged bear market.
This week price has moved higher, but inverted VIX has moved lower. This divergence is bearish for the short term and shall be given a little weight as it confirms bearish divergence with the AD line.
DAILY CHART
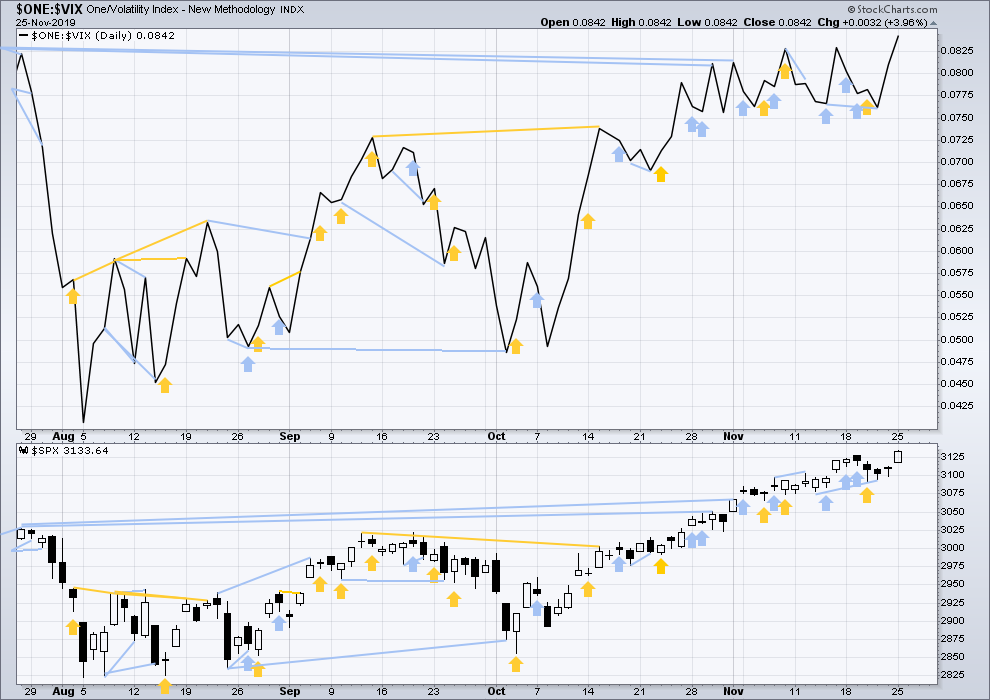
Click chart to enlarge. Chart courtesy of StockCharts.com. So that colour blind members are included, bearish signals
will be noted with blue and bullish signals with yellow.
Today both price and inverted VIX have moved higher. Both have made new short-term highs. There is no short-term divergence.
DOW THEORY
Dow Theory confirmed a bear market in December 2018. This does not necessarily mean a bear market at Grand Super Cycle degree though; Dow Theory makes no comment on Elliott wave counts. On the 25th of August 2015 Dow Theory also confirmed a bear market. The Elliott wave count sees that as part of cycle wave II. After Dow Theory confirmation of a bear market in August 2015, price went on to make new all time highs and the bull market continued.
DJIA: 23,344.52 – a close on the 19th of December at 23,284.97 confirms a bear market.
DJT: 9,806.79 – price has closed below this point on the 13th of December.
S&P500: 2,532.69 – a close on the 19th of December at 2,506.96 provides support to a bear market conclusion.
Nasdaq: 6,630.67 – a close on the 19th of December at 6,618.86 provides support to a bear market conclusion.
With all the indices having moved higher following a Dow Theory bear market confirmation, Dow Theory would confirm a bull market if the following highs are made:
DJIA: 26,951.81 – a close above this point has been made on the 3rd of July 2019.
DJT: 11,623.58 – to date DJT has failed to confirm an ongoing bull market.
S&P500: 2,940.91 – a close above this point was made on the 29th of April 2019.
Nasdaq: 8,133.30 – a close above this point was made on the 26th of April 2019.
Published @ 05:13 p.m. EST.
—
Careful risk management protects your trading account(s).
Follow my two Golden Rules:
1. Always trade with stops.
2. Risk only 1-5% of equity on any one trade.
—
New updates to this analysis are in bold.
So what event is our EW model predicting to initiate the minor 3? Another drop of less than stellar news re: US/China trade agreement. In fact, I wouldn’t be surprised if each of the coming successively larger iv waves are aligned with US/China trade news.
Is tomorrow (Wed) a half day? I think Friday is.
hourly chart updated:
I’ve added a very short term narrow Elliott channel about the middle of the current third wave of minuette (iii). If subminuette iv gets down that far look for support at the lower edge.
subminuette iv would likely end somewhere within the price territory of the fourth wave of one lesser degree
that’s micro 4 which has its range from 3,138.80 to 3,134.79.
It is not as strong as the main 10 year trendline, but the reason why it stopped progressing above 3140 is due to another yearly resistance (see pic). I wonder how easy it would be for the market to break it.
If it were to hold that resistance, then 3179 level will not be reached until 01/08/20 or later.
I really like that trend line. Thanks for posting the chart. I’ll add that line to my TA chart today.
I’m always confused with dates. Do you mean 1st Aug 2020, or 8th Jan 2020?
Hi Lara,
I meant 8th of January 2020. However, the moment I posted it ES candle body finished today above that line. SPX is still below it as of today’s close. ES shows signs of breaking that resistance but it could be a fake out. We’ll see tomorrow.
2 year trend line on a monthly chart
I would expect some small degree iv wave action to initiate as price gets into the overhead cluster of 162% extensions of prior swings, in the range 3145-3155 (if not sooner). (Note that this count is slightly delta from Lara’s hourly main.)
If (when) $DJT goes up another 6% or so…Dow Theory swings over to BULL MARKET again! $DJT is at 10989 now, and needs to go above 11623.
I would expect that occurring might unlock some substantial increment institutional investment in the markets.
Today Lara is early and so am I. FIRST!
I was very early, yes. Running the risk that assessing the StockCharts data that early it is subject to change in the next hour or two.
I’ve been doing more travelling. I just spent a week in Gisborne catching up with good friends and getting some good waves. Gizzy is one of the surfing meccas here in NZ, they get more consistent swell than my home in Coromandel. We saw some of NZ’s surfing heros and past WSL pro tour members. Once, one of them, a Gizzy local, dropped in on Cesar. Twice. It’s his wave apparently.