
The S&P 500 has continued to make new highs this week exactly as the Elliott wave count expected. There is underlying strength in this market with rising breadth and new all time highs from On Balance Volume. Elliott wave targets remain the same.
Summary: Overall, expect more upwards movement with shallow and / or brief corrections along the way. A third wave is continuing higher and has good support from breadth and volume.
The next target is at 3,179 where minor wave 4 may begin (expect it to be very shallow). Thereafter, the next target is at 3,302 and then 3,336.
Three large pullbacks or consolidations during the next few months are expected: for minor wave 4, then intermediate (4), and then primary 4. Prior to each of these large corrections beginning, some weakness may begin to be evident.
The biggest picture, Grand Super Cycle analysis, is here.
Monthly charts were last published here, with video here. There are two further alternate monthly charts here, with video here.
ELLIOTT WAVE COUNTS
The two weekly Elliott wave counts below will be labelled First and Second. They may be about of even probability. When the fifth wave currently unfolding on weekly charts may be complete, then these two wave counts will diverge on the severity of the expected following bear market. To see an illustration of this future divergence monthly charts should be viewed.
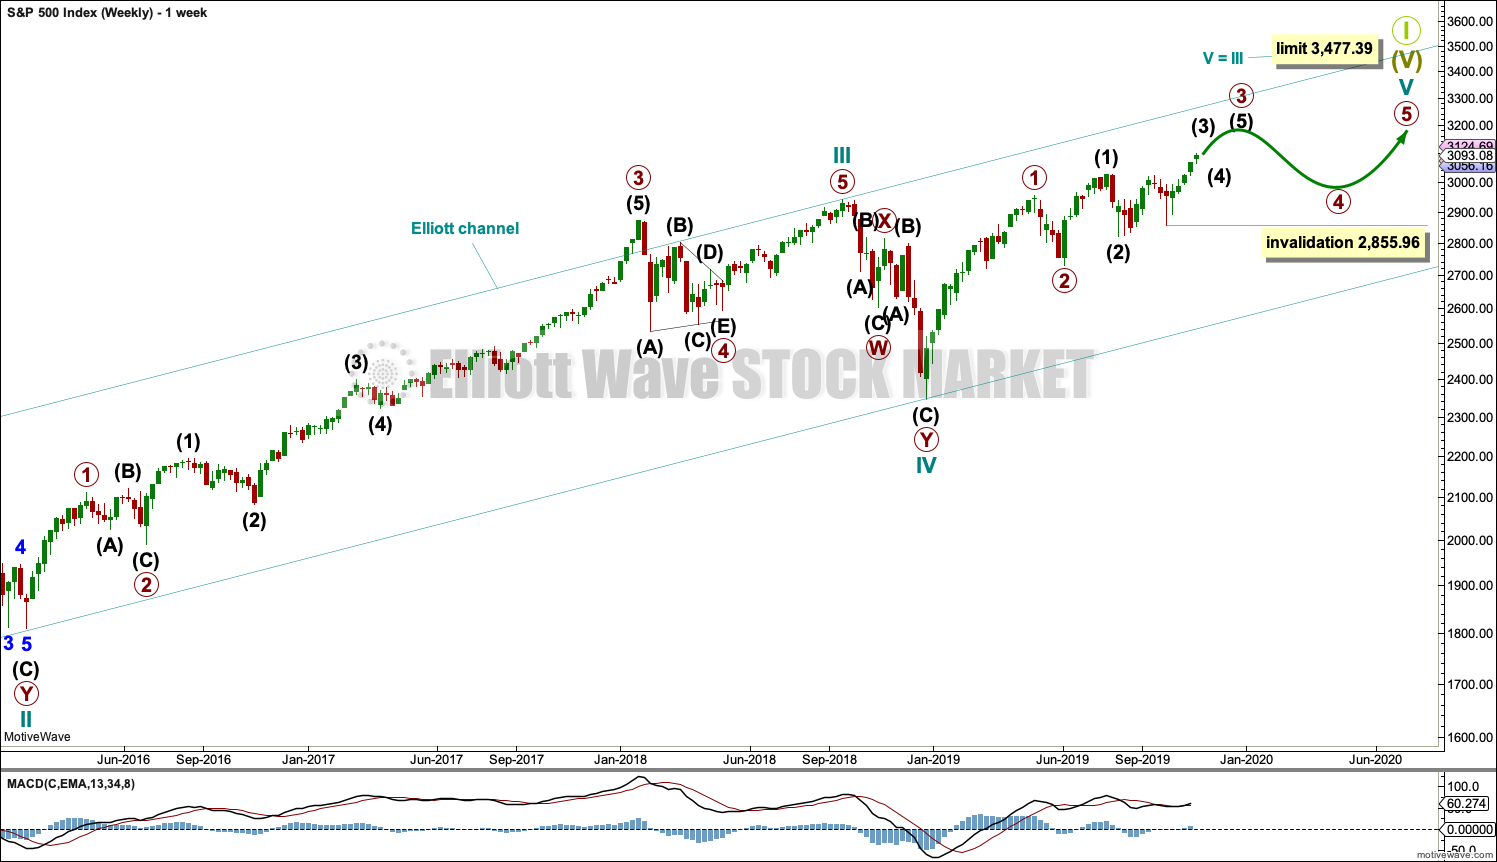
FIRST WAVE COUNT
WEEKLY CHART
Click chart to enlarge.
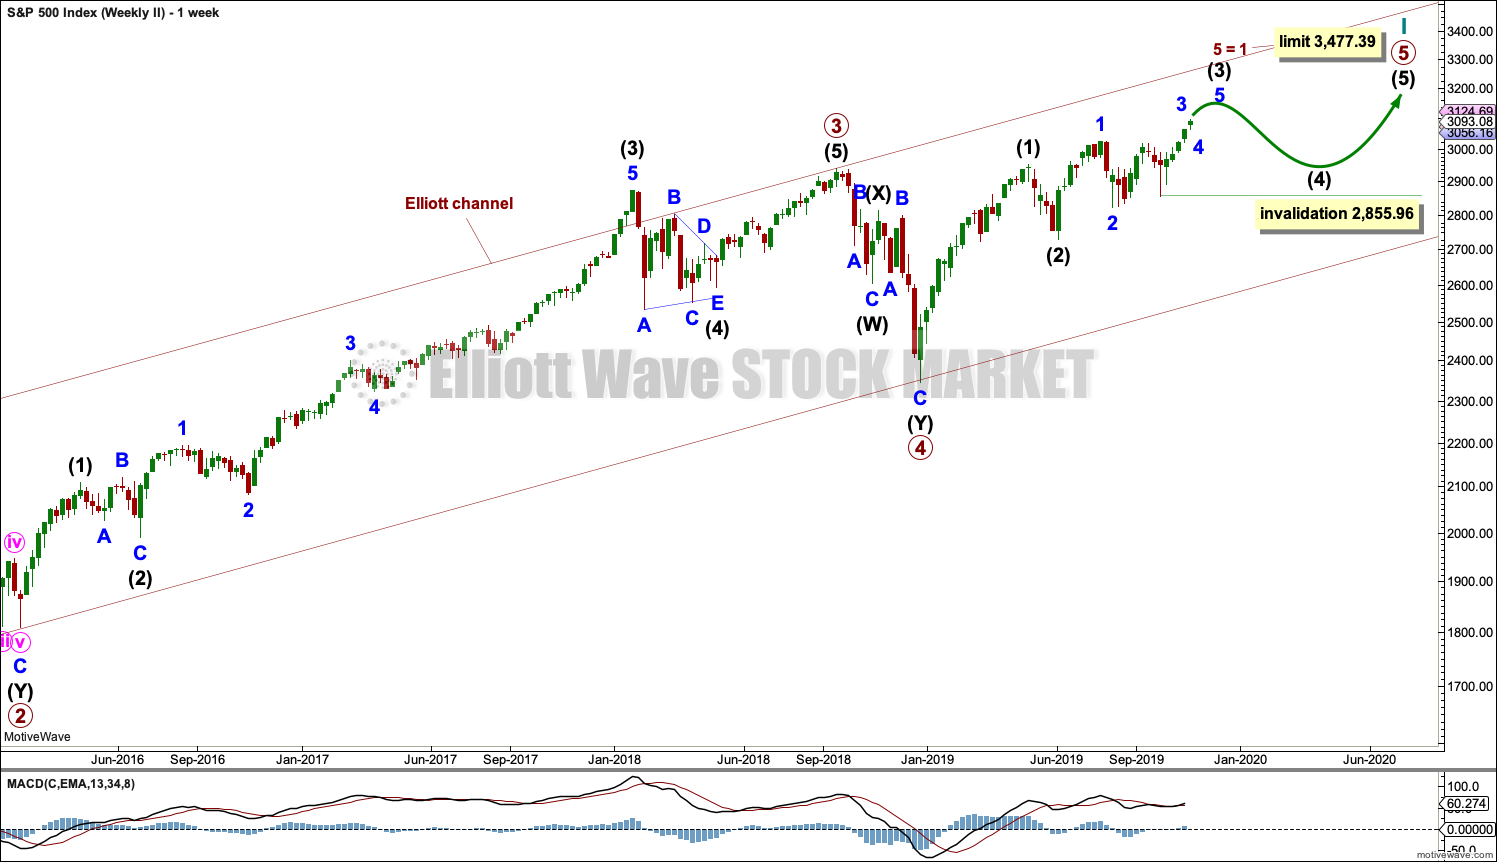
The basic Elliott wave structure consists of a five wave structure up followed by a three wave structure down (for a bull market). This wave count sees the bull market beginning in March 2009 as an incomplete five wave impulse and now within the last fifth wave, which is labelled cycle wave V. This impulse is best viewed on monthly charts. The weekly chart focusses on the end of it.
Elliott wave is fractal. This fifth wave labelled cycle wave V may end a larger fifth wave labelled Super Cycle wave (V), which may end a larger first wave labelled Grand Super Cycle wave I.
The teal Elliott channel is drawn using Elliott’s first technique about the impulse of Super Cycle wave (V). Draw the first trend line from the end of cycle wave I (off to the left of the chart, the weekly candlestick beginning 30th November 2014) to the end of cycle wave III, then place a parallel copy on the end of cycle wave II. This channel perfectly shows where cycle wave IV ended at support. The strongest portion of cycle wave III, the end of primary wave 3, overshoots the upper edge of the channel. This is a typical look for a third wave and suggests the channel is drawn correctly and the way the impulse is counted is correct.
Within Super Cycle wave (V), cycle wave III is shorter than cycle wave I. A core Elliott wave rule states that a third wave may never be the shortest. For this rule to be met in this instance, cycle wave V may not be longer in length than cycle wave III. This limit is at 3,477.39.
Cycle wave V may subdivide either as an impulse or an ending diagonal. Impulses are much more common. An alternate wave count, which looked at the possibility of a diagonal unfolding, has been invalidated with a new all time high.
The daily chart below will focus on movement from the end of intermediate wave (1) within primary wave 3.
In historic analysis, two further monthly charts have been published that do not have a limit to upwards movement and are more bullish than this wave count. Members are encouraged to consider those possibilities (links below summary) alongside the wave counts presented on a daily and weekly basis.
Within cycle wave V, primary waves 1 and 2 may be complete. Within primary wave 3, intermediate waves (1) and (2) may be complete. Within the middle of intermediate wave (3), no second wave correction may move beyond its start below 2,855.96.
DAILY CHART
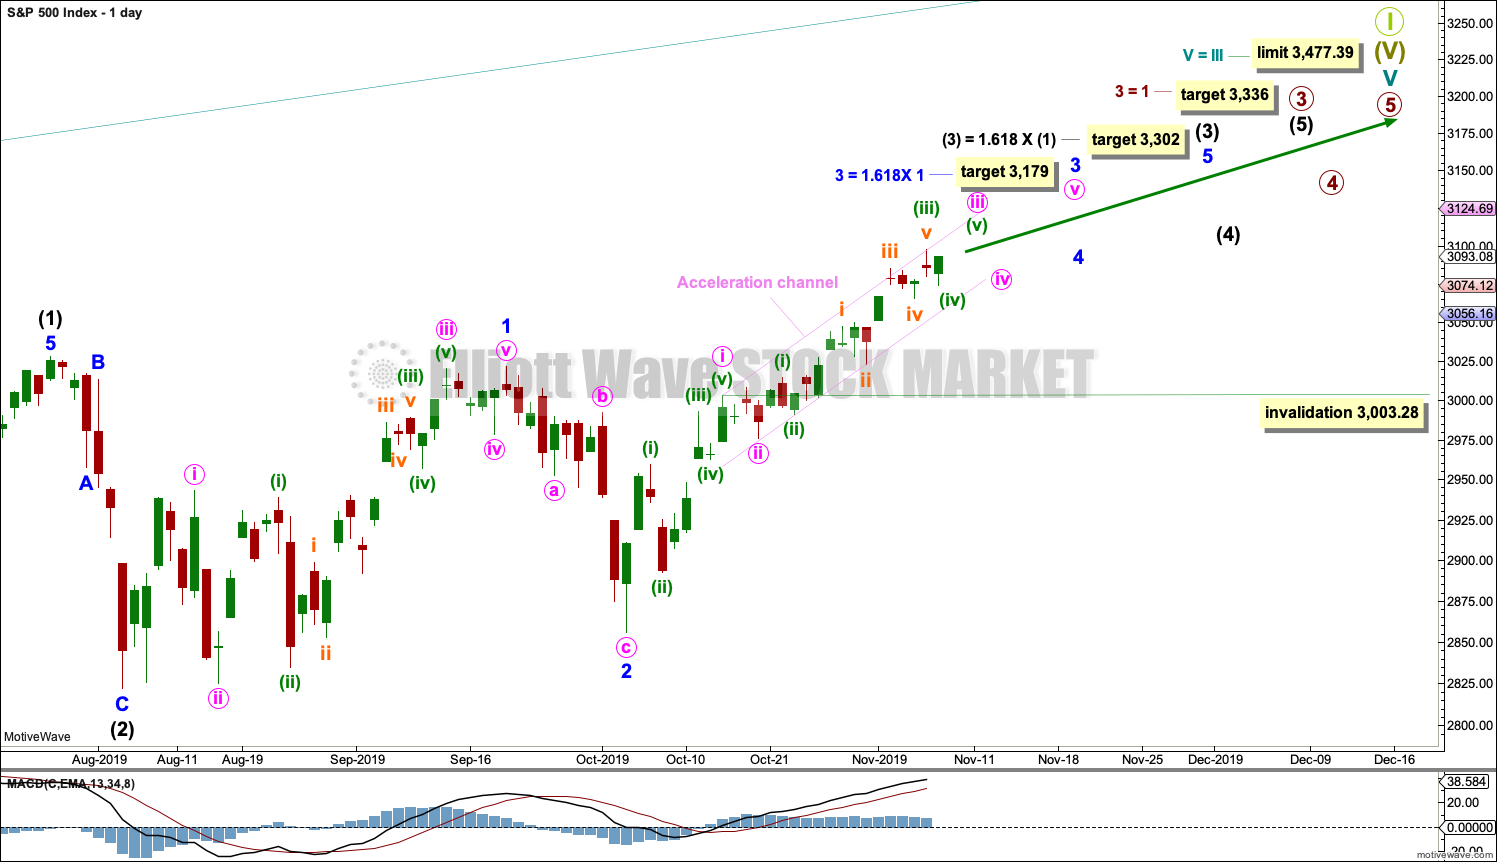
Click chart to enlarge.
All of primary wave 3, intermediate wave (3) and minor wave 3 may only subdivide as impulses.
Minor wave 3 may be underway and may have passed through its middle. Minor wave 3 now shows an increase in momentum beyond minor wave 1; MACD supports this wave count. Within minor wave 3, minute wave iv may not move into minute wave i price territory below 3,003.28.
Intermediate wave (3) must move far enough above the end of intermediate wave (1) to then allow intermediate wave (4) to unfold and remain above intermediate wave (1) price territory. While intermediate wave (3) has now moved beyond the end of intermediate wave (1), meeting a core Elliott wave rule, it still needs to continue higher to give room for intermediate wave (4).
The target for intermediate wave (3) fits with a target calculated for minor wave 3.
Minor wave 2 was a sharp deep pullback, so when it arrives minor wave 4 may be expected to be a very shallow sideways consolidation to exhibit alternation. Minor wave 2 lasted 2 weeks, so minor wave 4 may be about the same duration to have good proportion.
HOURLY CHART
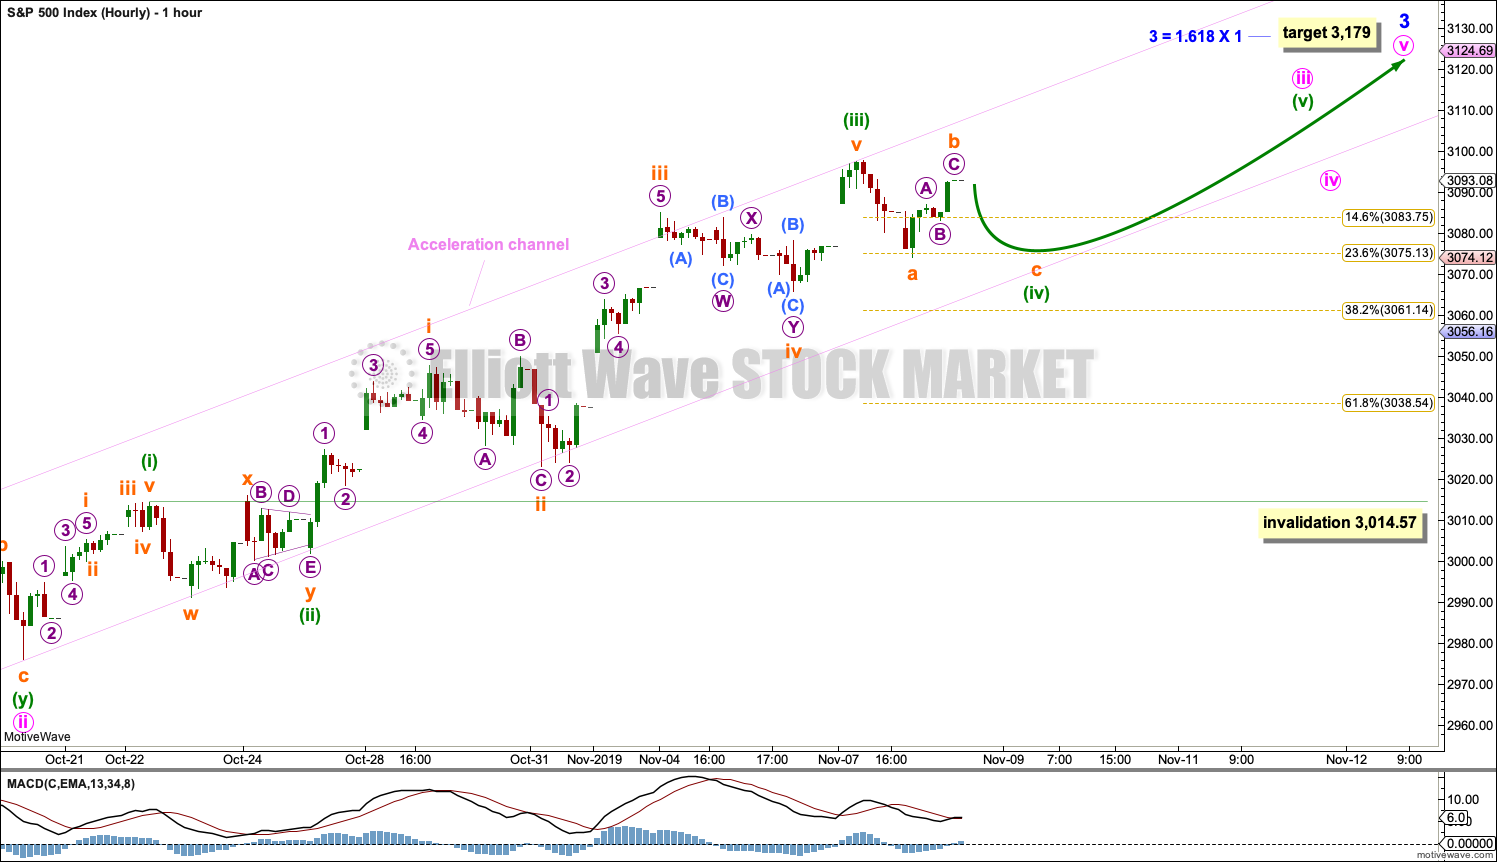
Click chart to enlarge.
There are multiple ways now to label upwards movement from the end of minor wave 2.
At the end of this week, classic analysis suggests the two hourly wave counts should again be swapped over.
It is possible that minor wave 3 is incomplete. Within it, minute wave iii may be incomplete.
Within minute wave iii, minuette wave (iv) may complete on Monday as a very shallow quick correction. Thereafter, upwards movement may continue towards the original target for minor wave 3.
On the five minute chart, the downwards wave labelled subminuette wave a within minuette wave (iv) looks very much like an impulse, although it may also be seen as a single or triple zigzag. If this wave is an impulse, then minuette wave (iv) may be incomplete and subminuette wave b may not move beyond the start of subminuette wave a above 3,097.70.
If the downwards wave labelled subminuette wave a is a single or multiple zigzag, then it would be possible to label minuette wave (iv) over there. If Monday begins with a new all time high, this chart would be relabelled to see minuette wave (iv) complete.
When a third wave may be unfolding, expect any surprises to be to the upside.
Minuette wave (iv) may not move into minuette wave (i) price territory below 3,014.57. However, minuette wave (iv) may be expected to be shallow and to find final support at the lower edge of the acceleration channel, if it were to get down that far.
ALTERNATE HOURLY CHART
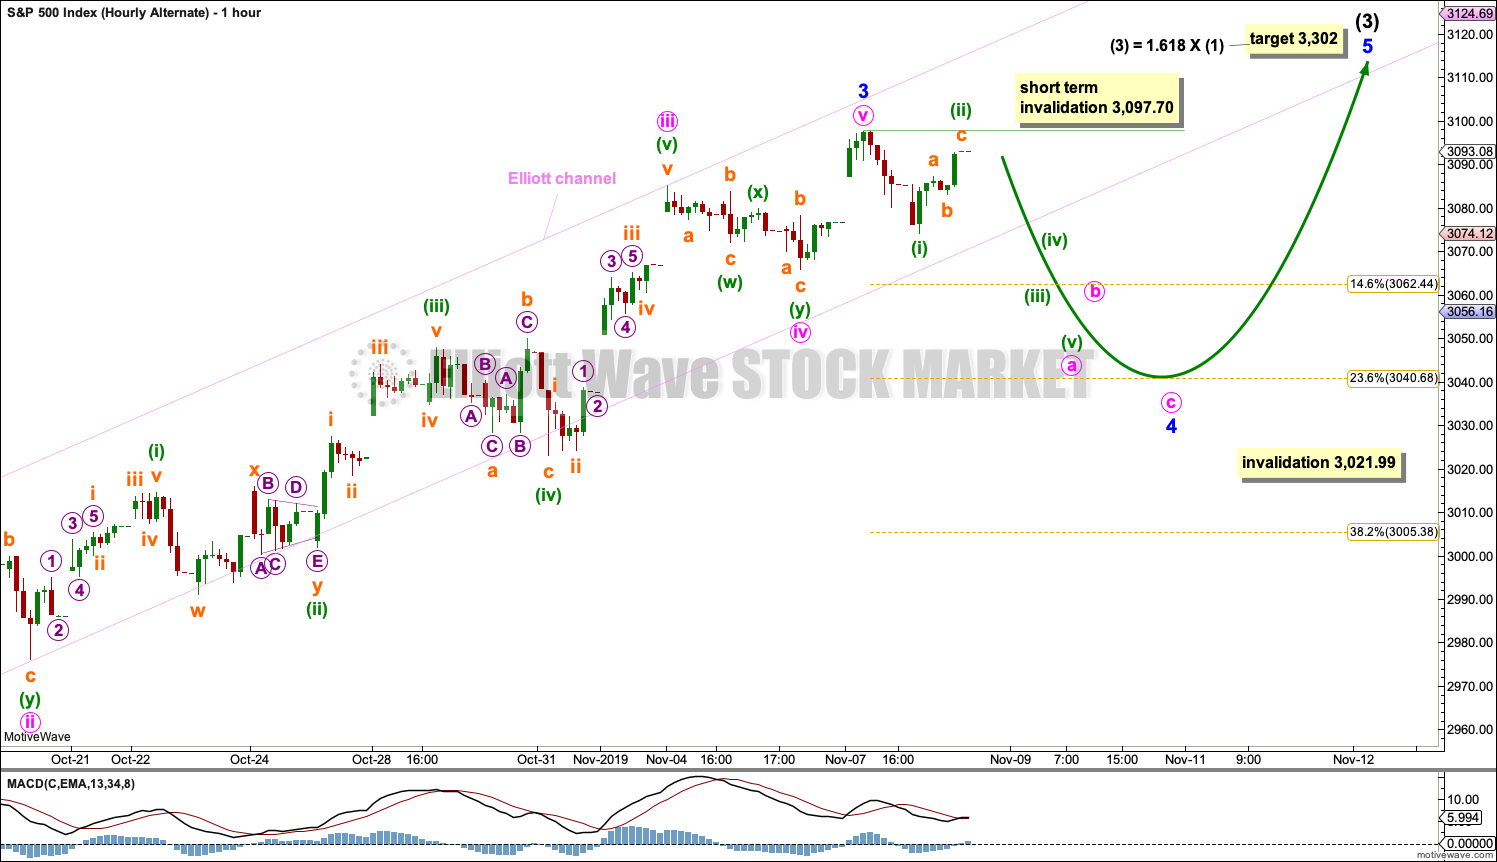
Click chart to enlarge.
Each of the currently unfolding third waves of minute wave iii, minor wave 3, intermediate wave (3) and primary wave 3 may only subdivide as simple impulses.
It is possible that minor wave 3 could be over. There is no Fibonacci ratio between minor waves 3 and 1, and minor wave 3 would be longer than minor wave 1.
Within minor wave 3, minute wave iii is shorter than minute wave i. This indicates it is very unlikely that minute wave v would be extended.
Minor wave 2 was a deep 0.83 zigzag lasting 10 sessions. Minor wave 4 may be very shallow and may be a sideways time consuming structure such as a combination, triangle or flat.
SECOND WAVE COUNT
WEEKLY CHART
Click chart to enlarge.
This weekly chart is almost identical to the first weekly chart, with the sole exception being the degree of labelling.
This weekly chart moves the degree of labelling for the impulse beginning in March 2009 all down one degree. This difference is best viewed on monthly charts.
The impulse is still viewed as nearing an end; a fifth wave is still seen as needing to complete higher. This wave count labels it primary wave 5.
Primary wave 5 may be subdividing as either an impulse, in the same way that cycle wave V is seen for the first weekly chart.
TECHNICAL ANALYSIS
MONTHLY CHART
A monthly technical analysis chart will be published again when the month of November is completed.
WEEKLY CHART
Click chart to enlarge. Chart courtesy of StockCharts.com.
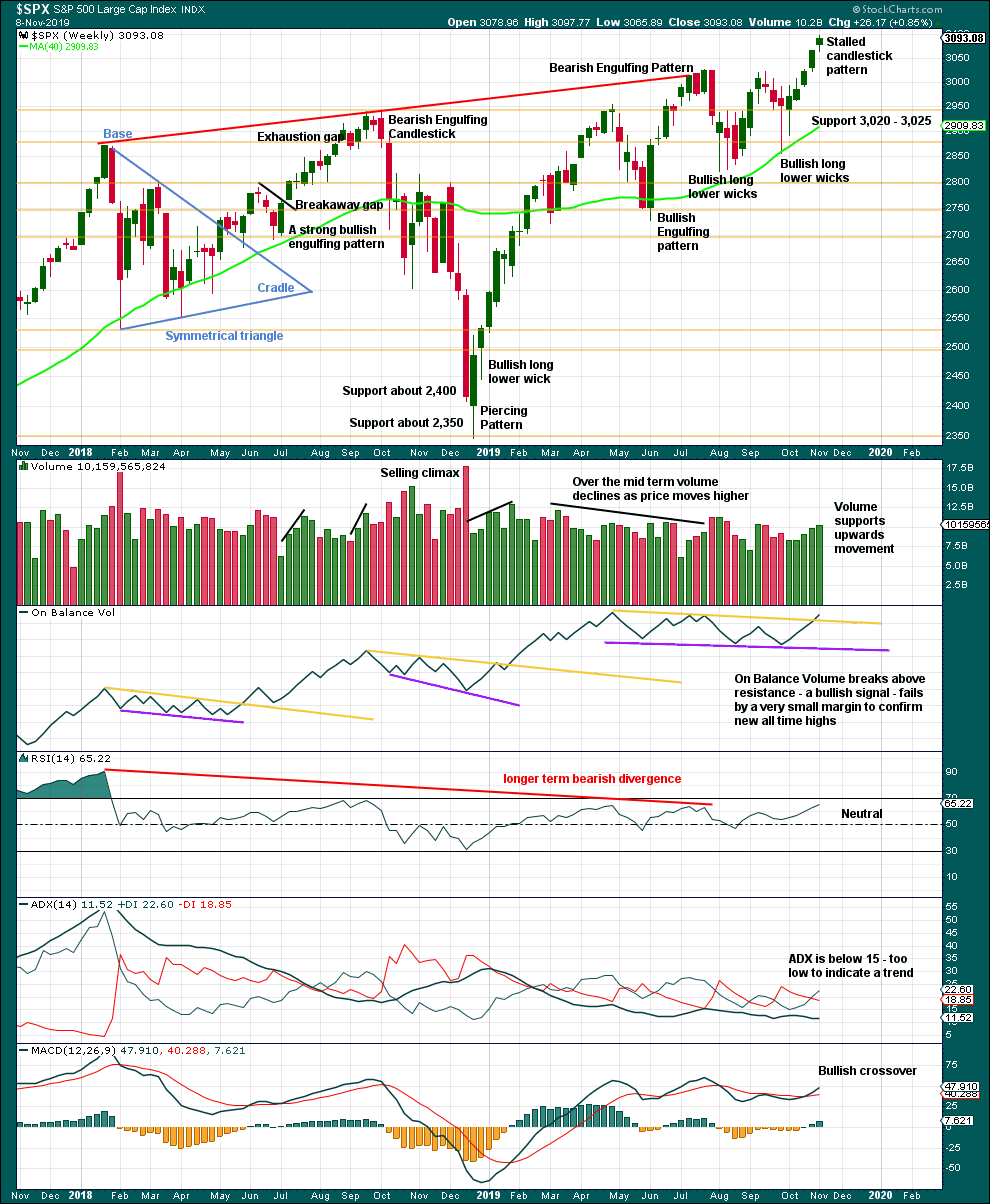
It is very clear that the S&P is in an upwards trend and the bull market is continuing. Price does not move in straight lines; there will be pullbacks and consolidations along the way.
Now that resistance has been overcome, expect a possible release of energy and any surprises should be to the upside. Corrections are normal and to be expected; they may be more short term in nature at this stage.
This week again price overall has support from rising volume. A smaller real body for this last weekly candlestick completes a Stalled candlestick pattern, but volume undermines the bearishness of this pattern and it shall be given little weight in this analysis for that reason.
The divergence between price and On Balance Volume is extremely small; On Balance Volume is off its prior high by only the smallest of margins. This is not replicated at the monthly or daily time frames, so it shall be given no weight in this analysis.
DAILY CHART
Click chart to enlarge. Chart courtesy of StockCharts.com.
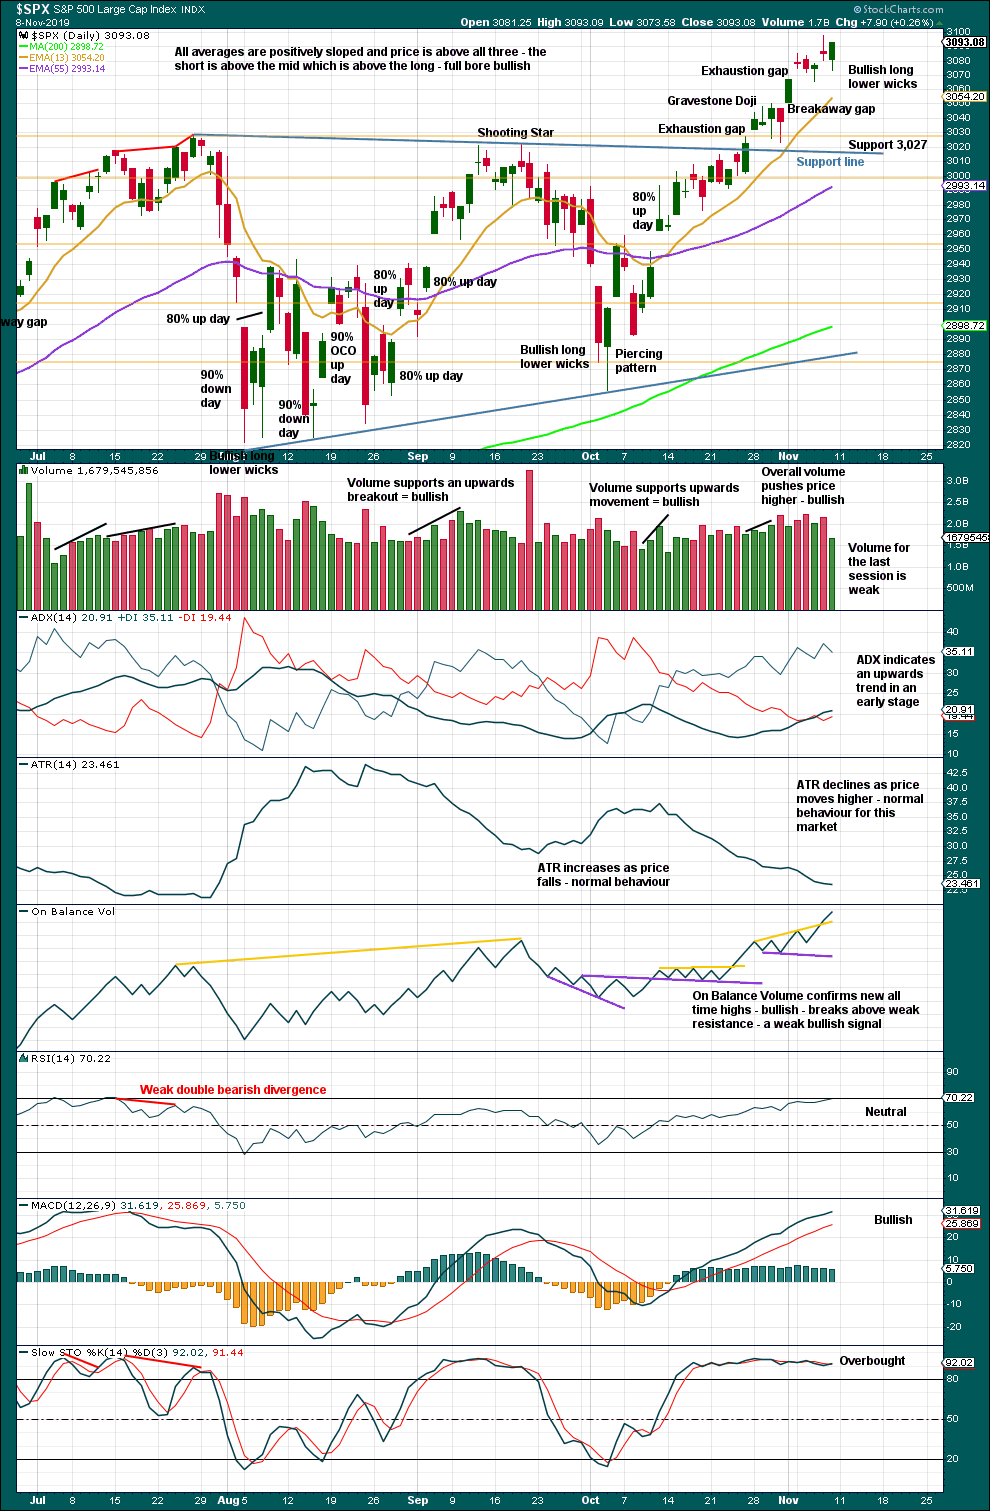
There is an upwards trend in place. There will be corrections along the way. On Balance Volume confirms new all time highs in price.
A long lower wick and price closing only 0.01 point off the high for Friday’s session strongly suggests more upwards movement on Monday.
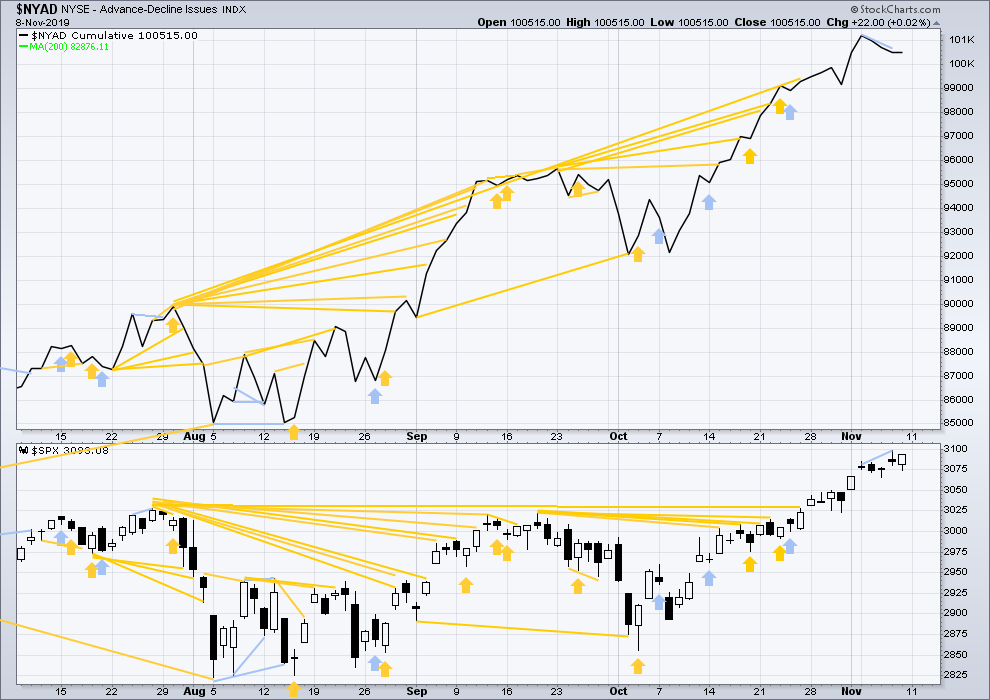
BREADTH – AD LINE
WEEKLY CHART
Click chart to enlarge. Chart courtesy of StockCharts.com. So that colour blind members are included, bearish signals
will be noted with blue and bullish signals with yellow.
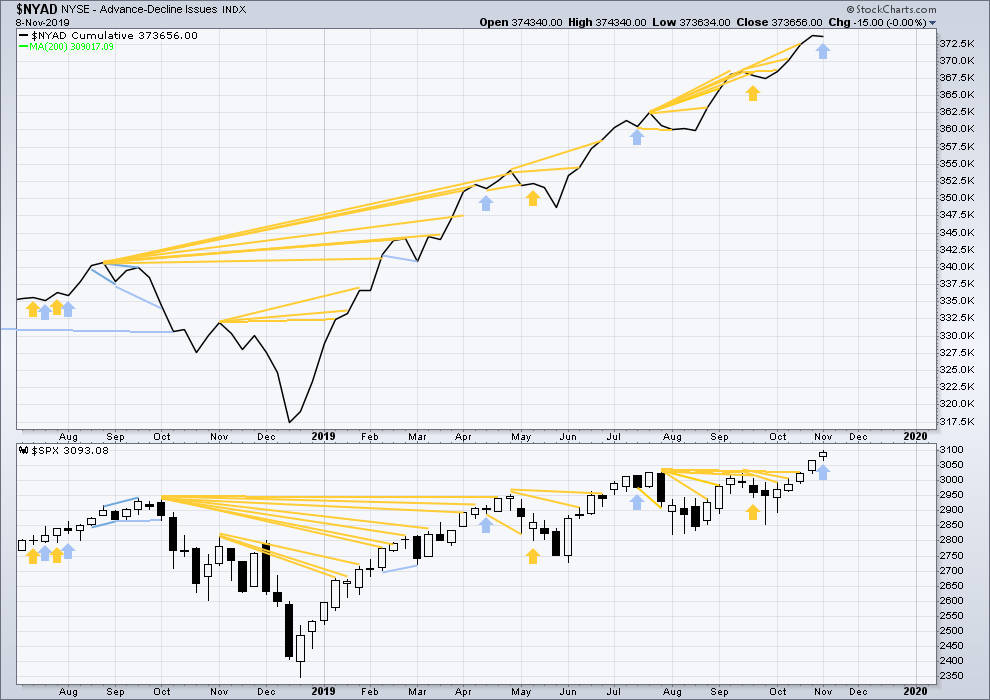
Bear markets from the Great Depression and onwards have been preceded by an average minimum of 4 months divergence between price and the AD line with only two exceptions in 1946 and 1976. With the AD line making new all time highs last week, the end of this bull market and the start of a new bear market is very likely a minimum of 4 months away, which is beginning March 2020.
In all bear markets in the last 90 years there is some positive correlation (0.6022) between the length of bearish divergence and the depth of the following bear market. No to little divergence is correlated with more shallow bear markets. Longer divergence is correlated with deeper bear markets.
If a bear market does develop here, it comes after no bearish divergence. It would therefore more likely be shallow.
Last week all of small, mid and large caps have made new swing highs above the prior swing high on the 13th of September, but only large caps have made new all time highs. This upwards movement appears to be mostly driven by large caps, which is a feature of aged bull markets. This bull market at over 10 years duration certainly fits the definition of aged.
Mid and small caps have not yet made new all time highs.
This week price moves higher, but the AD line has declined very slightly. Upwards movement this week does not have support from rising market breadth, but this divergence is very slight. This may be an early warning of a more time consuming consolidation which may come in the next one to few weeks.
DAILY CHART
Click chart to enlarge. Chart courtesy of StockCharts.com. So that colour blind members are included, bearish signals
will be noted with blue and bullish signals with yellow.
Breadth should be read as a leading indicator.
Short-term bearish divergence noted for Thursday has been followed by a downwards session for Friday. It may be resolved here, or it may yet need another downwards session to resolve it.
On Friday price has moved lower, but the AD line is essentially flat. There is no real divergence here.
VOLATILITY – INVERTED VIX CHART
WEEKLY CHART
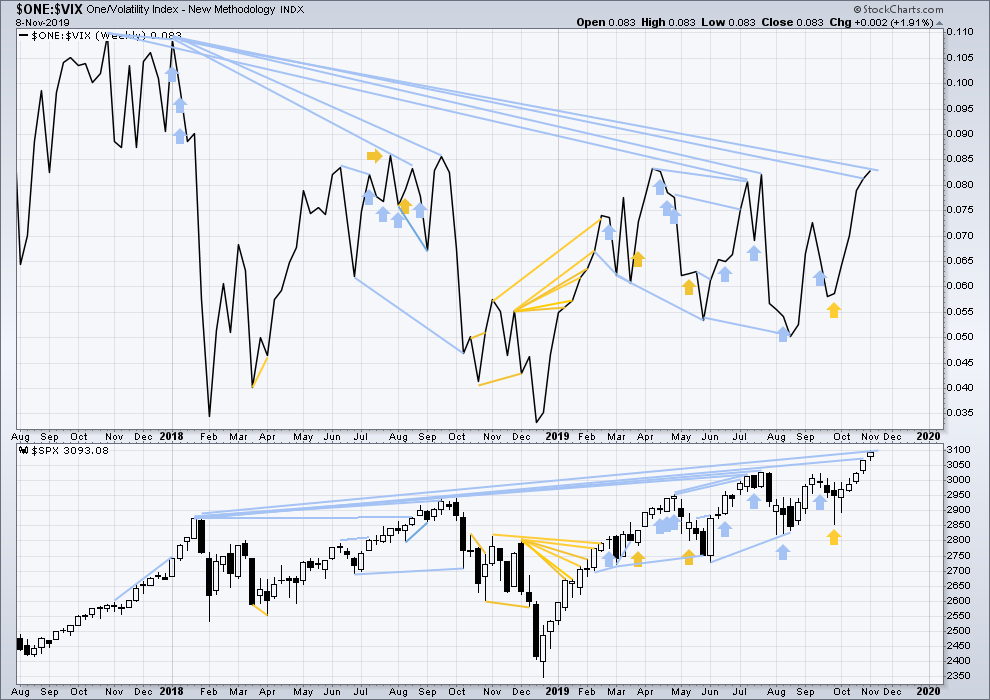
Click chart to enlarge. Chart courtesy of StockCharts.com. So that colour blind members are included, bearish signals
will be noted with blue and bullish signals with yellow.
The all time high for inverted VIX was on 30th October 2017. There is now over two years of bearish divergence between price and inverted VIX.
The rise in price is not coming with a normal corresponding decline in VIX; VIX remains elevated. This long-term divergence is bearish and may yet develop further as the bull market matures.
This divergence may be an early warning, a part of the process of a top developing that may take years. It may is clearly not useful in timing a trend change from bull to a fully fledged bear market.
This week both price and inverted VIX have moved higher. Price has made new highs, but inverted VIX has not. Long and mid-term divergence remains, but short-term divergence has now disappeared.
DAILY CHART
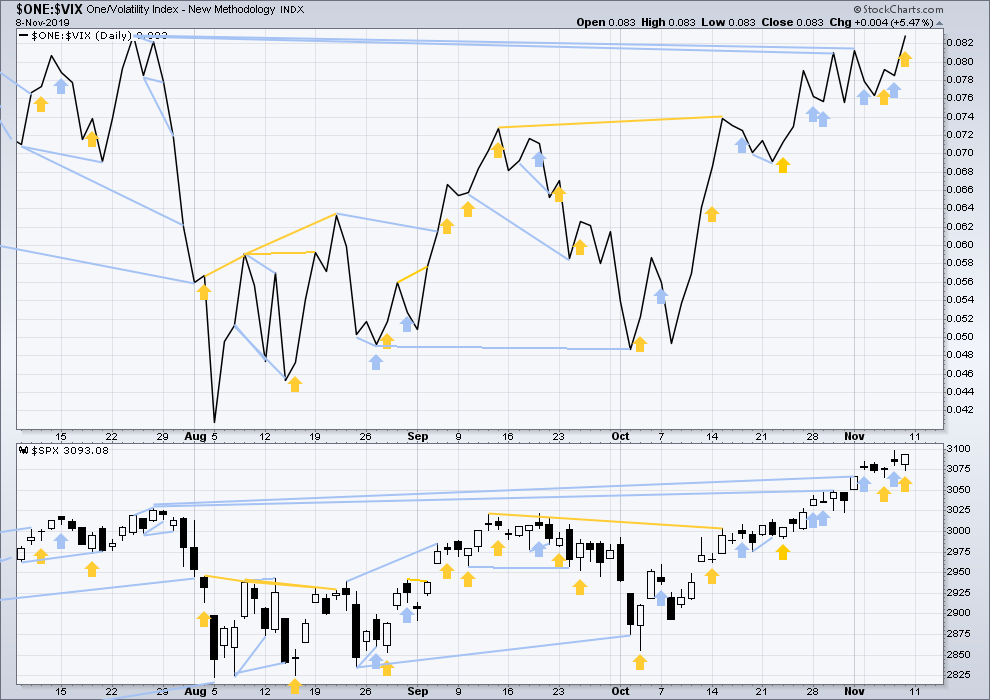
Click chart to enlarge. Chart courtesy of StockCharts.com. So that colour blind members are included, bearish signals
will be noted with blue and bullish signals with yellow.
On Friday price has moved lower with a lower low and a lower high, although the candlestick closed green. Inverted VIX has moved higher. This divergence is bullish for the short term.
DOW THEORY
Dow Theory confirmed a bear market in December 2018. This does not necessarily mean a bear market at Grand Super Cycle degree though; Dow Theory makes no comment on Elliott wave counts. On the 25th of August 2015 Dow Theory also confirmed a bear market. The Elliott wave count sees that as part of cycle wave II. After Dow Theory confirmation of a bear market in August 2015, price went on to make new all time highs and the bull market continued.
DJIA: 23,344.52 – a close on the 19th of December at 23,284.97 confirms a bear market.
DJT: 9,806.79 – price has closed below this point on the 13th of December.
S&P500: 2,532.69 – a close on the 19th of December at 2,506.96 provides support to a bear market conclusion.
Nasdaq: 6,630.67 – a close on the 19th of December at 6,618.86 provides support to a bear market conclusion.
With all the indices having moved higher following a Dow Theory bear market confirmation, Dow Theory would confirm a bull market if the following highs are made:
DJIA: 26,951.81 – a close above this point has been made on the 3rd of July 2019.
DJT: 11,623.58 – to date DJT has failed to confirm an ongoing bull market.
S&P500: 2,940.91 – a close above this point was made on the 29th of April 2019.
Nasdaq: 8,133.30 – a close above this point was made on the 26th of April 2019.
Published @ 10:57 p.m. EST.
—
Careful risk management protects your trading account(s).
Follow my two Golden Rules:
1. Always trade with stops.
2. Risk only 1-5% of equity on any one trade.
—
New updates to this analysis are in bold.
main wave count updated
I’m going to label minuette (iv) over, as this bounce looks too deep to be part of subminuette c
but also, minuette (iv) could be continuing sideways as a small triangle, it that completes and looks right I may relabel it a triangle
alternate hourly chart updated
this one is looking a little less likely today
maaaaaybe there’s a triangle finishing up in RUT. But I will be surprised zero to see price break below it and blow away that model.
I put two short analysis videos on my youtube channel (AAPL and SPX), just search for specktrading there. With a little luck and a tail wind I’ll be putting up fresh material there regularly. A thumbs up if you do check it out would be nice, tia!
Thumbs up from me!
Great start on YouTube, Kevin. You got a thumbs up from me too. I also doubled your subscriber base! Have a great day.
From small little seeds, beanstalks are grown! TY Rodney.
Robert Miner (in a free video, no proprietary content here) is strongly suggesting that SPX is in an ending diagonal of an ending diagonal, as roughly sketched in the chart here. What is your view of the legitimacy and probability of this? It is obviously extremely bearish and there doesn’t appear to be any support for it re: market internals at this time (Miner never includes internals in his overall analysis). Structurally, is it sound? Thanks.
that doesn’t meet EW rules
all sub-waves within ending diagonals must all subdivide as zigzags
so the fifth wave cannot be an ending diagonal.
I believe from memory that he said this exact same thing some 2 or 3 years ago, calling for a huge long term top which of course never eventuated.
yea, I’ve frequently found his EW analysis to be very sloppy, thanks!
The RUT mess. If first you don’t succeed, try try again…
And here’s the minor 1 detail…
I think your minor Y within intermediate (2) is a running flat.
That can be avoided and it may be an expanded flat if you move minute a over to the left.
OR
an alternate which should be considered there, is intermediate (2) ended at the low you have labelled minute a, and intermediate (3) is extending. That’s actually more bullish.
Thanks Lara. My prior model was indeed what you describe as the alternate to be considered. But then the minor 2 back down looks so much like continuation of the large correction. I’ll track both. Right now I don’t believe that matters too much at the daily tf, where is the question of when is this impulse up I’ve labeled minor 1 going to pivot into a minor 2. Thanks for the guidance.
“Right now I don’t believe that matters too much at the daily tf”
totally agreed
the bigger picture is the one to focus on
Watch for indications of a weekly pivot this coming week. Chart shows the reasons; lots of ’em.
The pivot zone is 3086-3128.
Hey, hey, hey. #1. Have a great weekend.