
New all time highs were expected. This week they have shown up. The Elliott wave count targets are recalculated.
Summary: The next target is at 3,179. Overall, expect upwards movement to continue and exhibit some further increase in momentum before a larger pullback arrives.
Three large pullbacks or consolidations during the next few months are expected: for minor wave 4, then intermediate (4), and then primary 4. Prior to each of these large corrections beginning, some weakness may begin to be evident. This week there is some small divergence between price and On Balance Volume, but that is all. Other technical indicators show underlying strength in this bull market.
For the short term, the next small consolidation or pullback may begin about 3,069.
The biggest picture, Grand Super Cycle analysis, is here.
Monthly charts were last published here, with video here. There are two further alternate monthly charts here, with video here.
ELLIOTT WAVE COUNTS
The two weekly Elliott wave counts below will be labelled First and Second. They may be about of even probability. When the fifth wave currently unfolding on weekly charts may be complete, then these two wave counts will diverge on the severity of the expected following bear market. To see an illustration of this future divergence monthly charts should be viewed.
FIRST WAVE COUNT
WEEKLY CHART
Click chart to enlarge.
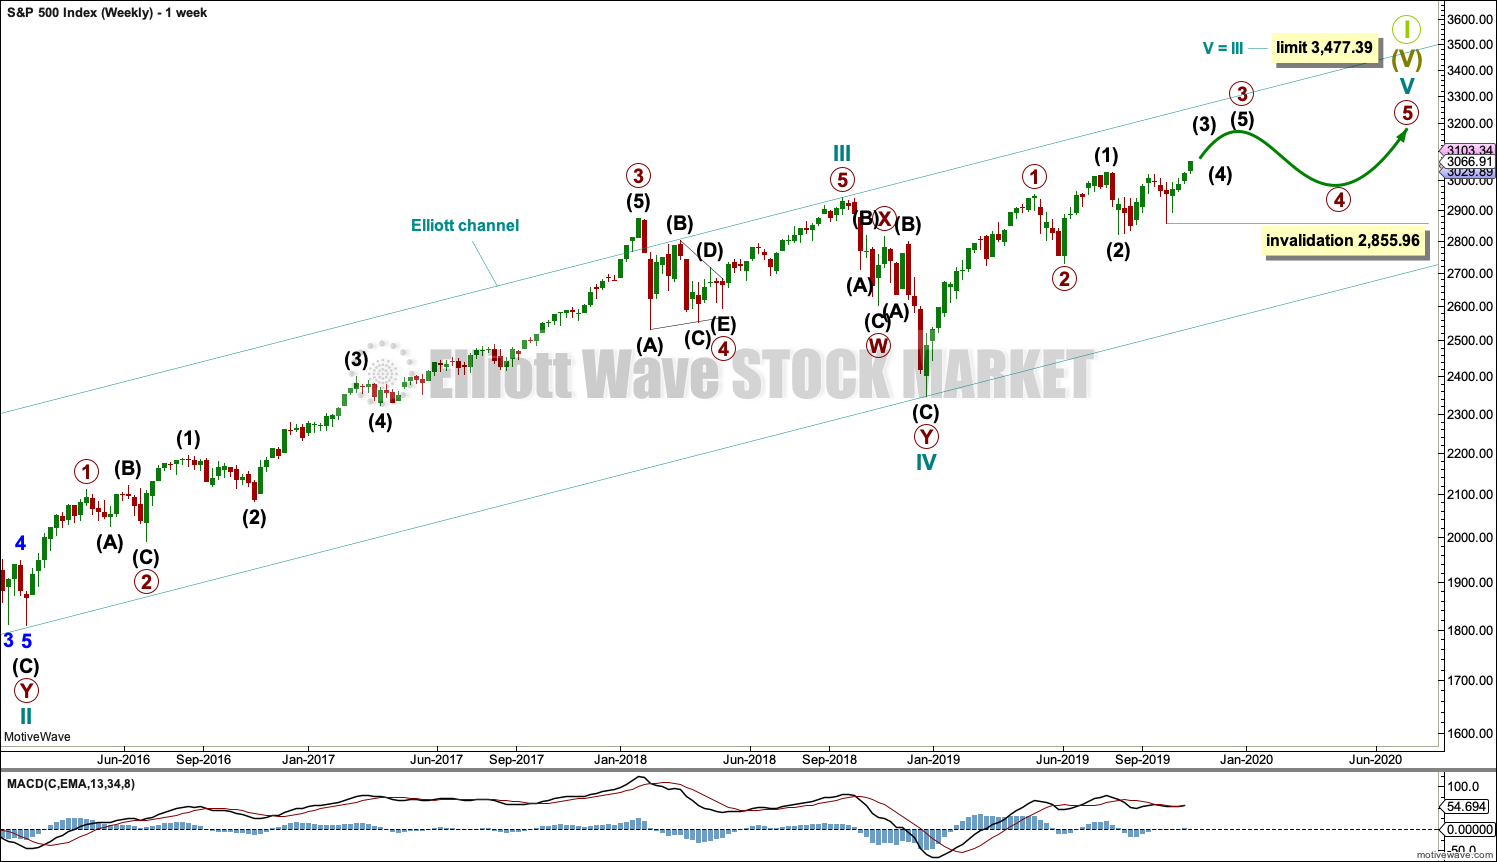
The basic Elliott wave structure consists of a five wave structure up followed by a three wave structure down (for a bull market). This wave count sees the bull market beginning in March 2009 as an incomplete five wave impulse and now within the last fifth wave, which is labelled cycle wave V. This impulse is best viewed on monthly charts. The weekly chart focusses on the end of it.
Elliott wave is fractal. This fifth wave labelled cycle wave V may end a larger fifth wave labelled Super Cycle wave (V), which may end a larger first wave labelled Grand Super Cycle wave I.
The teal Elliott channel is drawn using Elliott’s first technique about the impulse of Super Cycle wave (V). Draw the first trend line from the end of cycle wave I (off to the left of the chart, the weekly candlestick beginning 30th November 2014) to the end of cycle wave III, then place a parallel copy on the end of cycle wave II. This channel perfectly shows where cycle wave IV ended at support. The strongest portion of cycle wave III, the end of primary wave 3, overshoots the upper edge of the channel. This is a typical look for a third wave and suggests the channel is drawn correctly and the way the impulse is counted is correct.
Within Super Cycle wave (V), cycle wave III is shorter than cycle wave I. A core Elliott wave rule states that a third wave may never be the shortest. For this rule to be met in this instance, cycle wave V may not be longer in length than cycle wave III. This limit is at 3,477.39.
Cycle wave V may subdivide either as an impulse or an ending diagonal. Impulses are much more common. An alternate wave count, which looked at the possibility of a diagonal unfolding, has been invalidated with a new all time high.
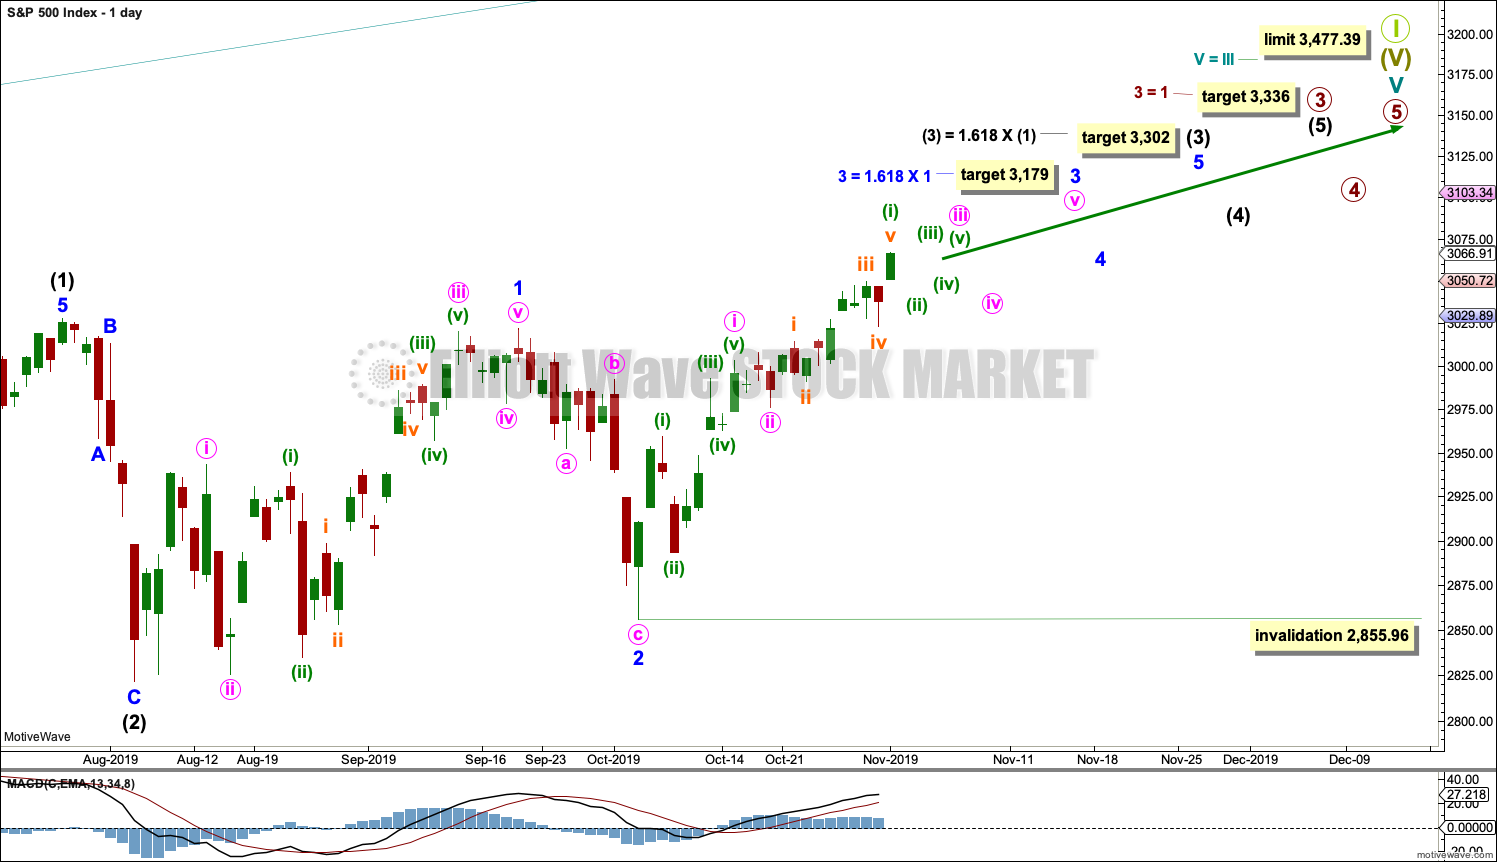
The daily chart below will focus on movement from the end of intermediate wave (1) within primary wave 3.
In historic analysis, two further monthly charts have been published that do not have a limit to upwards movement and are more bullish than this wave count. Members are encouraged to consider those possibilities (links below summary) alongside the wave counts presented on a daily and weekly basis.
Within cycle wave V, primary waves 1 and 2 may be complete. Within primary wave 3, intermediate waves (1) and (2) may be complete. Within the middle of intermediate wave (3), no second wave correction may move beyond its start below 2,855.96.
DAILY CHART
Click chart to enlarge.
Primary wave 3 may have begun.
All of primary wave 3, intermediate wave (3) and minor wave 3 may only subdivide as impulses. Within each impulse, its second wave correction may not move beyond the start of its first wave.
Minor wave 3 may be underway and may have not yet passed through its middle. Within minor wave 3, no second wave correction may move beyond its start below 2,855.96.
Intermediate wave (3) must move far enough above the end of intermediate wave (1) to then allow intermediate wave (4) to unfold and remain above intermediate wave (1) price territory.
The target for intermediate wave (3) is today recalculated. This fits with a new target calculated today for minor wave 3.
When minor wave 3 may be complete, then a multi-week pullback or consolidation for minor wave 4 may begin. Minor wave 4 must remain above minor wave 1 price territory at 3,021.99.
HOURLY CHART
Click chart to enlarge.
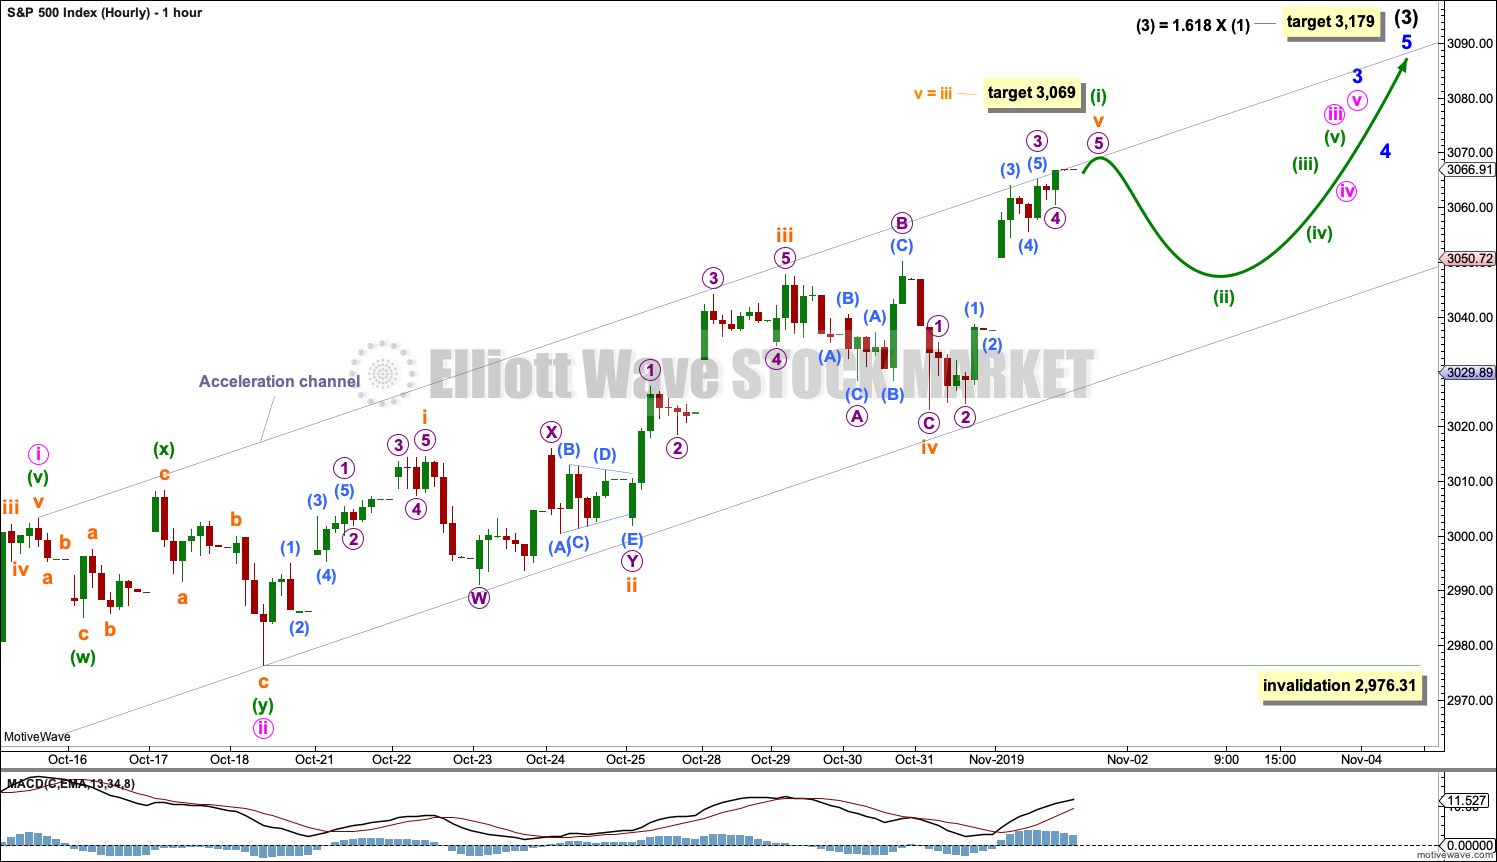
There are multiple ways now to label upwards movement from the end of minor wave 2. This labelling follows on from the last hourly chart, but the degree of labelling within minute wave iii has been moved down one.
Each of the currently unfolding third waves of minute wave iii, minor wave 3, intermediate wave (3) and primary wave 3 may only subdivide as simple impulses. Within minute wave iii, minuette wave (i) may be almost complete. Minuette wave (ii) may not move beyond the start of minuette wave (i) below 2,976.31.
Towards the middle and possibly also the end of minor wave 3 some further increase in upwards momentum may develop.
Draw an acceleration channel about the impulse of minor wave 3: draw the first trend line from the end of minute wave i to the last high, then place a parallel copy on the end of minute wave ii. Along the way up, the lower edge may provide support for any deeper pullbacks. Keep redrawing the channel as price keeps rising.
SECOND WAVE COUNT
WEEKLY CHART
Click chart to enlarge.
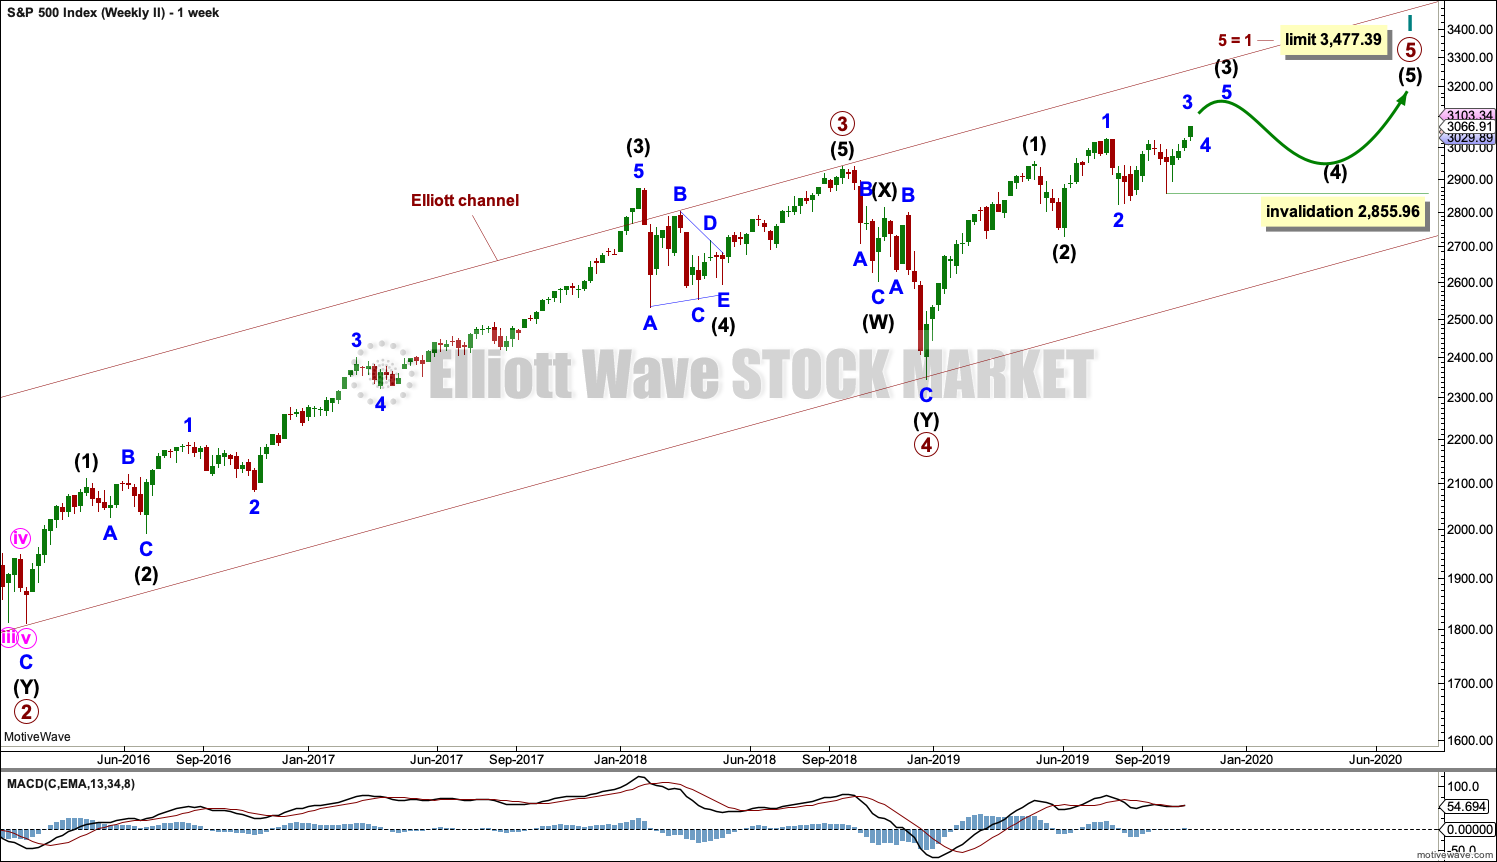
This weekly chart is almost identical to the first weekly chart, with the sole exception being the degree of labelling.
This weekly chart moves the degree of labelling for the impulse beginning in March 2009 all down one degree. This difference is best viewed on monthly charts.
The impulse is still viewed as nearing an end; a fifth wave is still seen as needing to complete higher. This wave count labels it primary wave 5.
Primary wave 5 may be subdividing as either an impulse, in the same way that cycle wave V is seen for the first weekly chart.
TECHNICAL ANALYSIS
MONTHLY CHART
Click chart to enlarge. Chart courtesy of StockCharts.com.
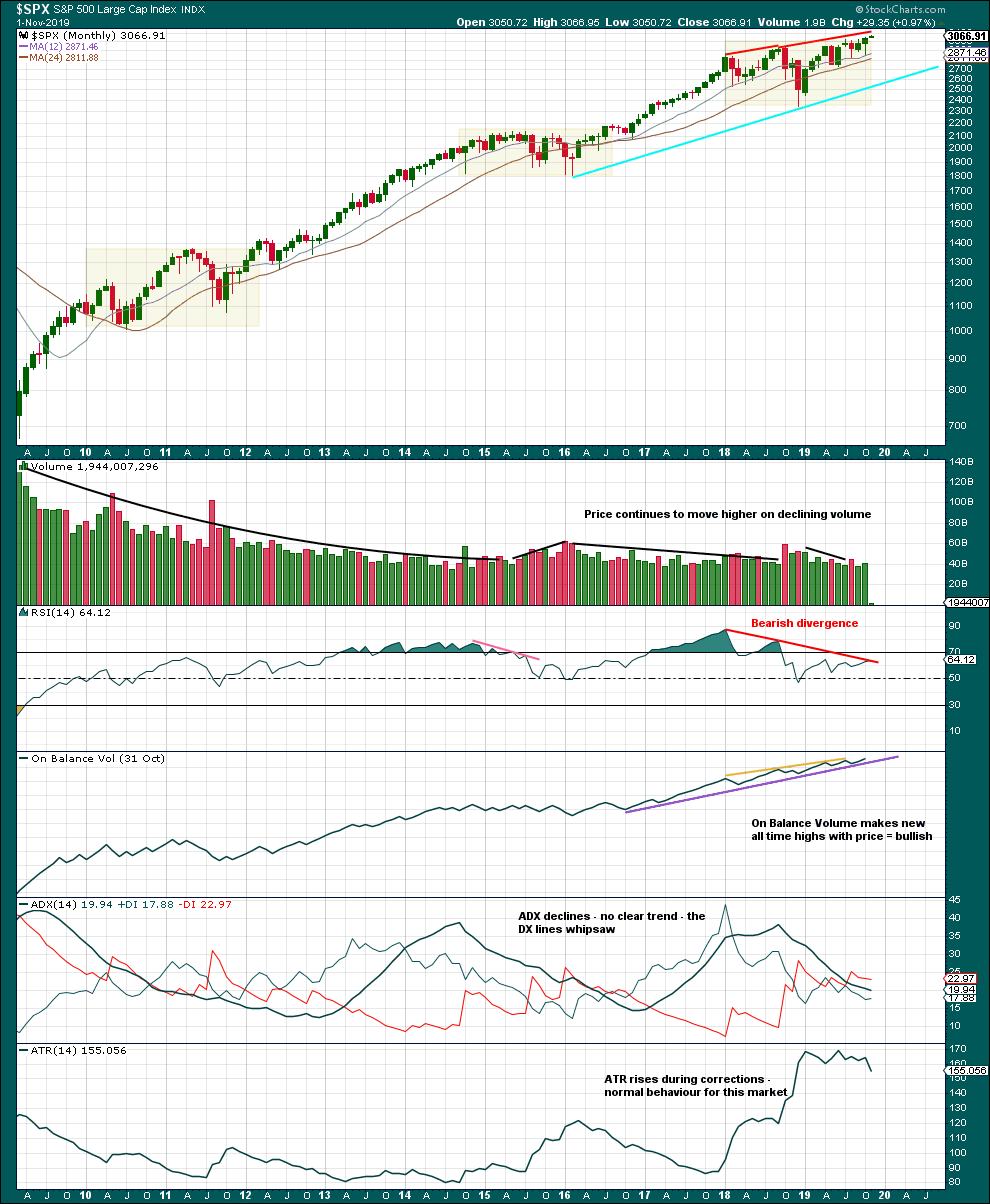
This monthly chart shows the entire bull market since its inception in March 2009. Within this bull market, there are so far three large consolidation boxes highlighted. A basic technical analysis concept is the longer price consolidates within a zone, the longer and further price may travel after a breakout. Price can back test support at prior resistance, and sometimes may re-enter the consolidation zone, before moving up and away.
Currently, price may have this week broken out of a large consolidation. It would be reasonable to now expect upwards movement for a reasonable amount of time after this breakout. It is also possible that pullbacks may re-enter the prior consolidation zone which had resistance about 3,027.
Bearish divergence between price and RSI may develop further before the bull market ends. Occasionally divergence can disappear, but for now it is valid. Given the stage that the Elliott wave count is in with a fifth wave unfolding, some developing weakness at this time frame should be expected.
Note that while On Balance Volume exhibits small divergence with price at lower time frames, it does not at the monthly chart level.
WEEKLY CHART
Click chart to enlarge. Chart courtesy of StockCharts.com.
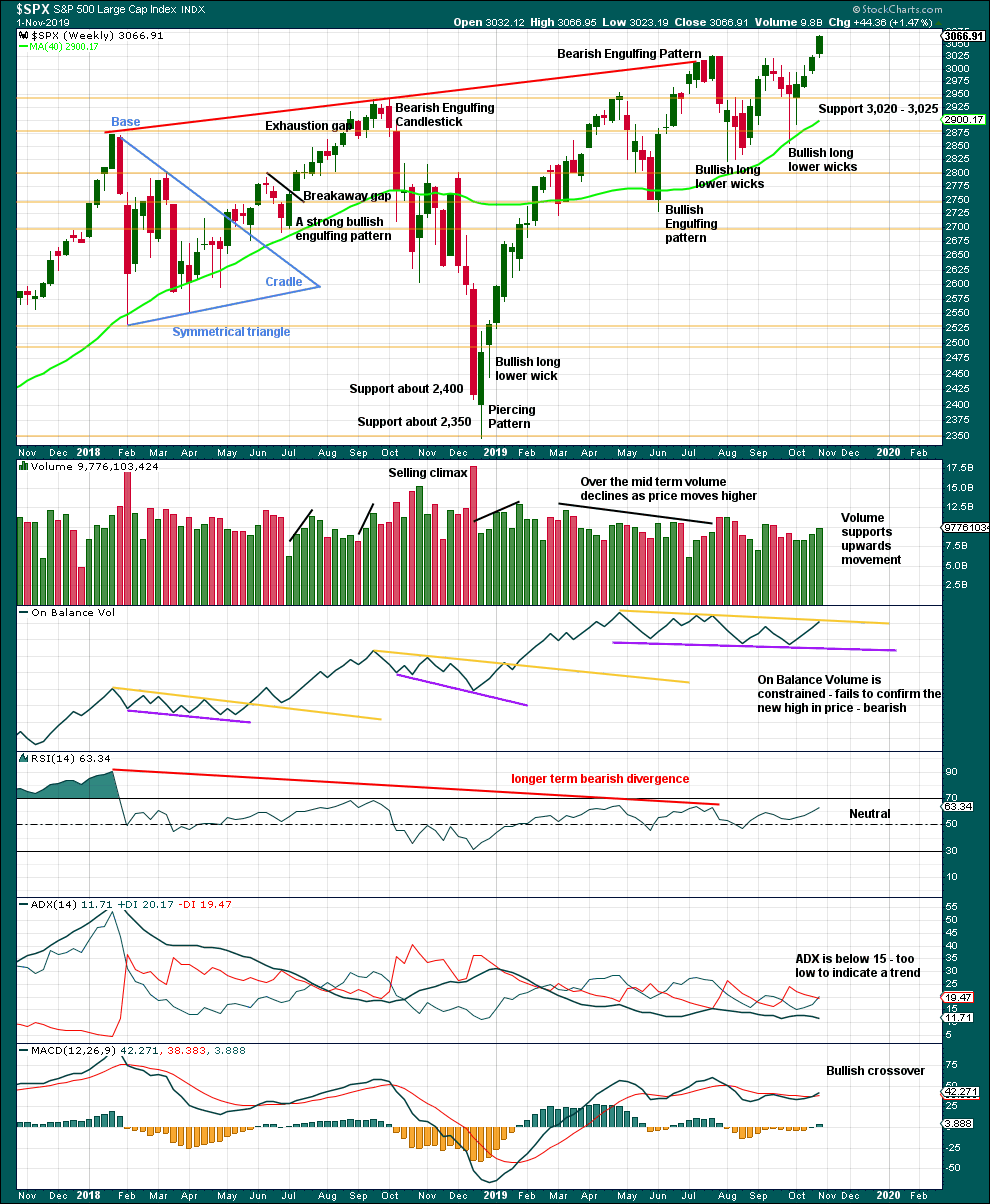
This week sees a breakout above resistance.
Some developing bearishness in On Balance Volume this week with divergence and resistance suggests a pullback may develop sooner rather than later here.
However, it is very clear that the S&P is in an upwards trend and the bull market is continuing. Price does not move in straight lines; there will be pullbacks and consolidations along the way.
Now that resistance has been overcome and a new all time high is seen, expect a possible release of energy and any surprises should be to the upside. Corrections are normal and to be expected; they may be more short term in nature at this stage.
DAILY CHART
Click chart to enlarge. Chart courtesy of StockCharts.com.
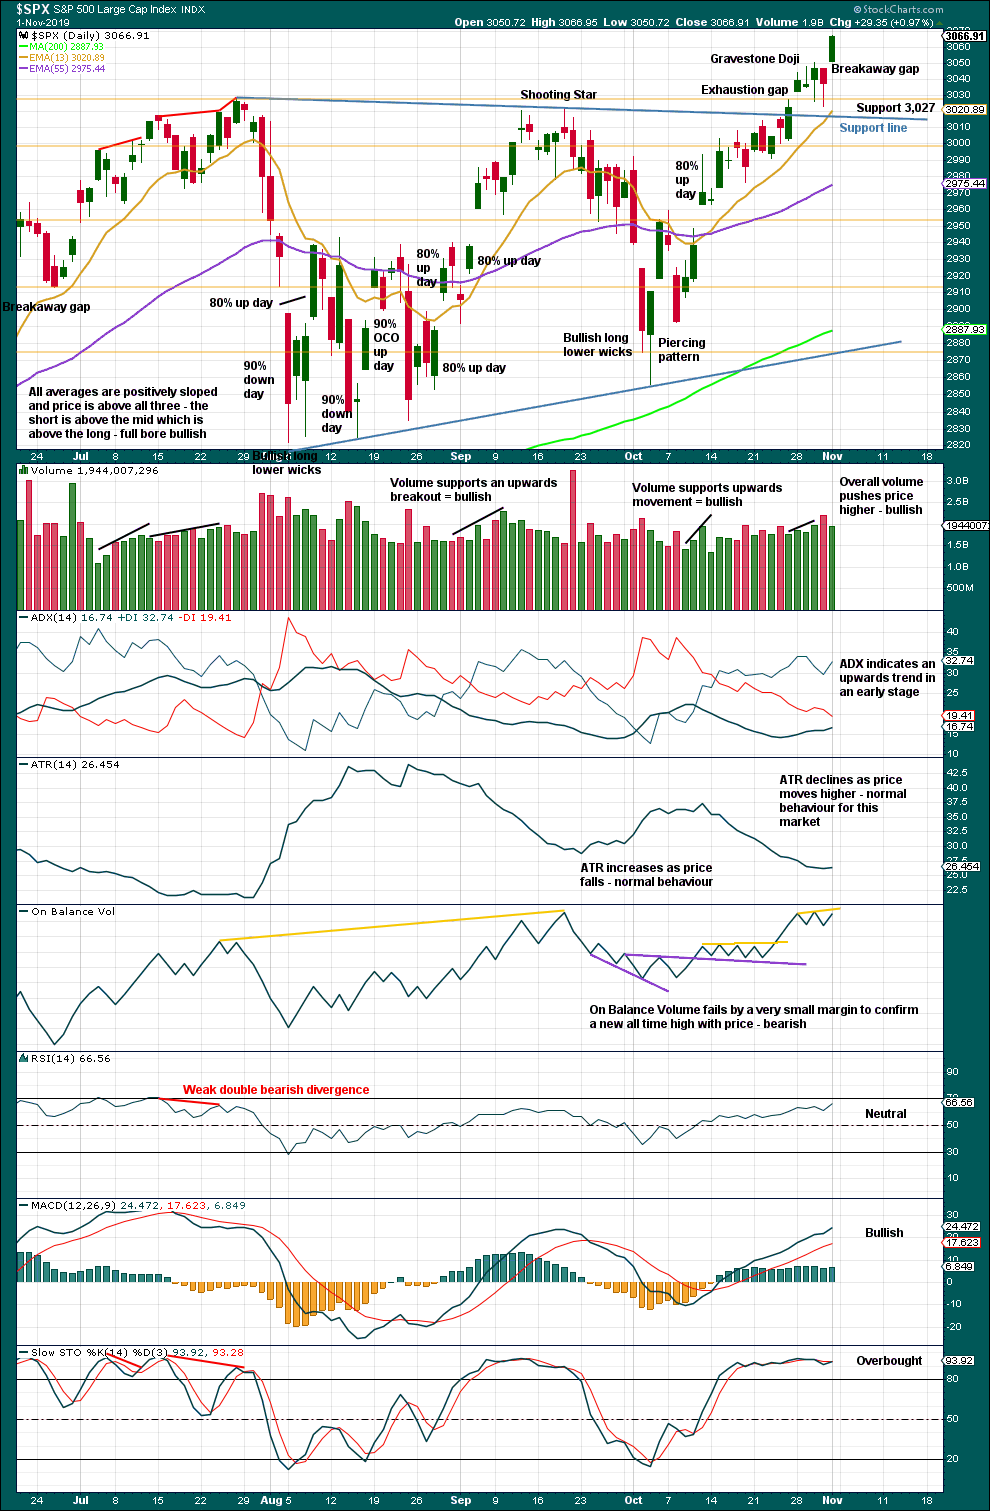
Price has broken above a small correction on Friday with another gap. This may so far be labelled a breakaway gap and may offer support now about 3,046.90.
Bearishness from On Balance Volume at the daily chart level is slight and may possibly be more short term in nature. However, it may also point to a slightly deeper or more time consuming correction about to develop here. Look for strong support about 3,027 if that does happen.
BREADTH – AD LINE
WEEKLY CHART
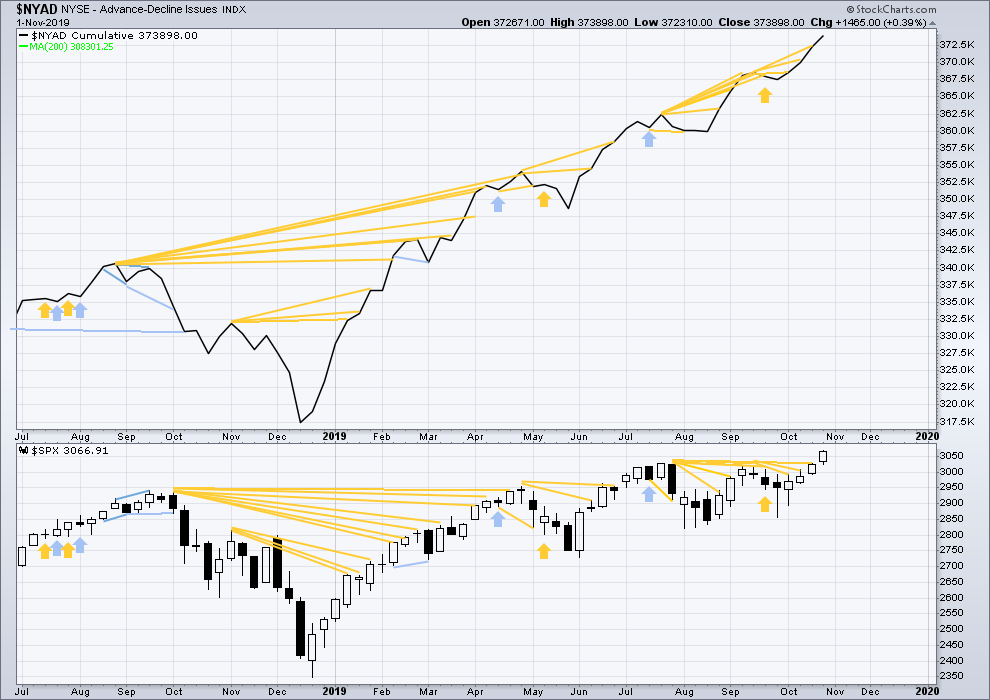
Click chart to enlarge. Chart courtesy of StockCharts.com. So that colour blind members are included, bearish signals
will be noted with blue and bullish signals with yellow.
Bear markets from the Great Depression and onwards have been preceded by an average minimum of 4 months divergence between price and the AD line with only two exceptions in 1946 and 1976. With the AD line making new all time highs continuing this week, the end of this bull market and the start of a new bear market is very likely a minimum of 4 months away, which is beginning March 2020.
In all bear markets in the last 90 years there is some positive correlation (0.6022) between the length of bearish divergence and the depth of the following bear market. No to little divergence is correlated with more shallow bear markets. Longer divergence is correlated with deeper bear markets.
If a bear market does develop here, it comes after no bearish divergence. It would therefore more likely be shallow.
This week all of small, mid and large caps have made new swing highs above the prior swing high on the 13th of September, but only large caps have made new all time highs. This upwards movement appears to be mostly driven by large caps, which is a feature of aged bull markets. This bull market at over 10 years duration certainly fits the definition of aged.
Mid and small caps are not too far off all time highs, with mid caps stronger and small caps weakest.
DAILY CHART
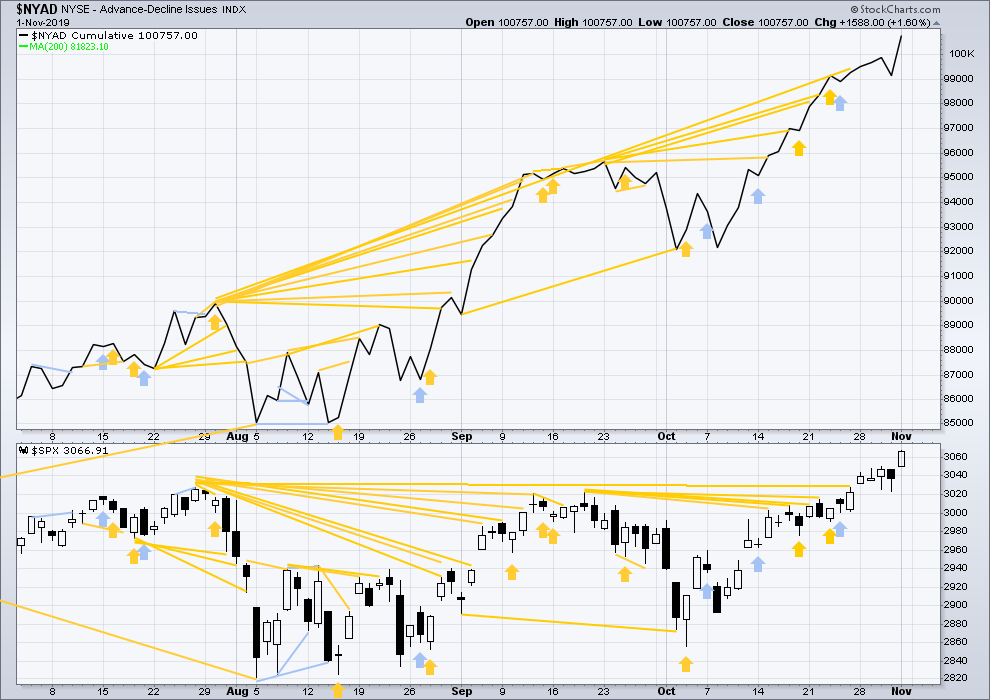
Click chart to enlarge. Chart courtesy of StockCharts.com. So that colour blind members are included, bearish signals
will be noted with blue and bullish signals with yellow.
Breadth should be read as a leading indicator.
Short-term bearish divergence noted in last analysis has been revised by Stockcharts and is no longer evident.
The AD line on Friday confirms a new all time high from price. Upwards movement has support from strongly rising market breadth. This is bullish.
VOLATILITY – INVERTED VIX CHART
WEEKLY CHART
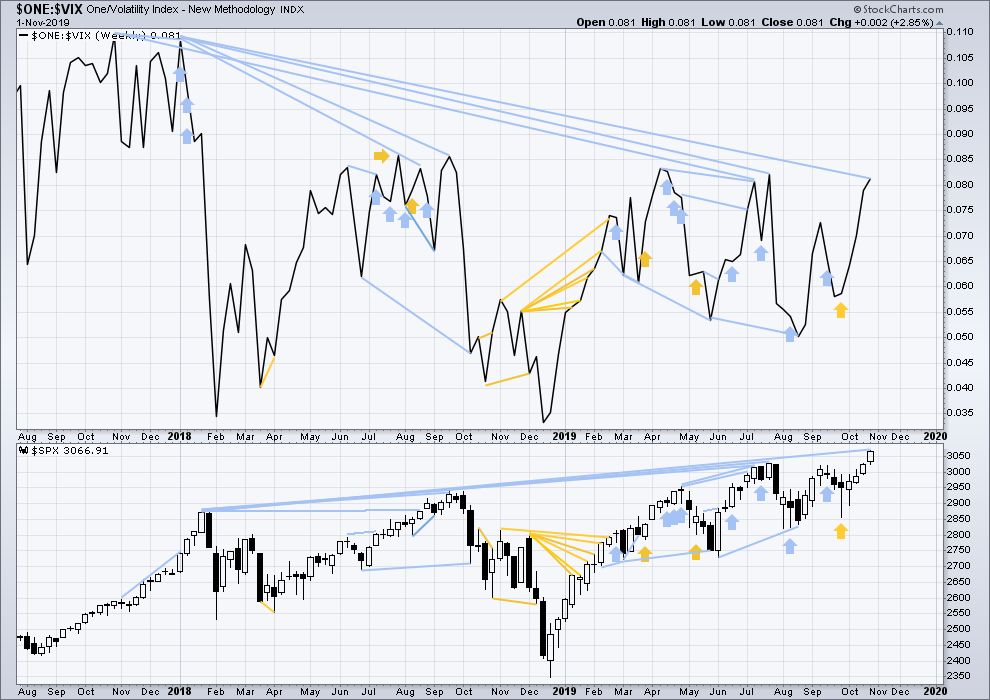
Click chart to enlarge. Chart courtesy of StockCharts.com. So that colour blind members are included, bearish signals
will be noted with blue and bullish signals with yellow.
The all time high for inverted VIX (which is the same as the low for VIX) was on 30th October 2017. There is now over two years of bearish divergence between price and inverted VIX.
The rise in price is not coming with a normal corresponding decline in VIX; VIX remains elevated. This long-term divergence is bearish and may yet develop further as the bull market matures.
This divergence may be an early warning, a part of the process of a top developing that may take years. It may is clearly not useful in timing a trend change from bull to a fully fledged bear market.
This week both price and inverted VIX have moved higher. Price has made new short-term swing highs, but inverted VIX has not. This divergence is slight and short term, and it adds to the longer term bearish divergence.
DAILY CHART
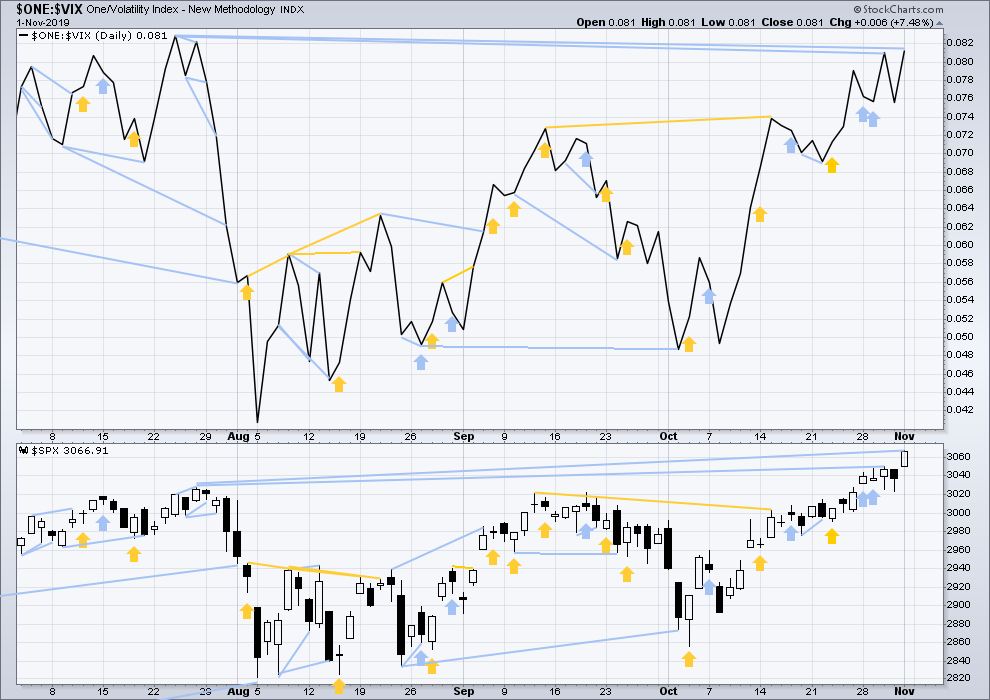
Click chart to enlarge. Chart courtesy of StockCharts.com. So that colour blind members are included, bearish signals
will be noted with blue and bullish signals with yellow.
Today both price and inverted VIX have moved higher. Price has made new mid-term swing highs, but inverted VIX has failed to make corresponding mid-term highs by a fairly small margin. This divergence is bearish.
DOW THEORY
Dow Theory confirmed a bear market in December 2018. This does not necessarily mean a bear market at Grand Super Cycle degree though; Dow Theory makes no comment on Elliott wave counts. On the 25th of August 2015 Dow Theory also confirmed a bear market. The Elliott wave count sees that as part of cycle wave II. After Dow Theory confirmation of a bear market in August 2015, price went on to make new all time highs and the bull market continued.
DJIA: 23,344.52 – a close on the 19th of December at 23,284.97 confirms a bear market.
DJT: 9,806.79 – price has closed below this point on the 13th of December.
S&P500: 2,532.69 – a close on the 19th of December at 2,506.96 provides support to a bear market conclusion.
Nasdaq: 6,630.67 – a close on the 19th of December at 6,618.86 provides support to a bear market conclusion.
With all the indices having moved higher following a Dow Theory bear market confirmation, Dow Theory would confirm a bull market if the following highs are made:
DJIA: 26,951.81 – a close above this point has been made on the 3rd of July 2019.
DJT: 11,623.58 – to date DJT has failed to confirm an ongoing bull market.
S&P500: 2,940.91 – a close above this point was made on the 29th of April 2019.
Nasdaq: 8,133.30 – a close above this point was made on the 26th of April 2019.
Published @ 06:17 p.m. EST.
—
Careful risk management protects your trading account(s).
Follow my two Golden Rules:
1. Always trade with stops.
2. Risk only 1-5% of equity on any one trade.
—
New updates to this analysis are in bold.
Hourly chart updated:
There’s a mistake in my chart published above 🙁
3,179 is the target for minor 3, not intermediate (3). You can see all the targets correctly on the daily chart.
I’m moving the degree of labelling up one degree again today within minor 3. Minute iii may be over at todays high. If so it is shorter than minute i. That’s okay, the target at 3,179 for minute v can still be met and all EW rules met.
Minute iv may be shallow, there may now be support at the lower edge of todays gap at 3,066.95. That will be labelled a measuring gap, a target calculated from that gap is at 3,094.
Great timing on including the monthly Lara. That broader context is needed to get perspective on what is potentially happening here, a major phase shift in this market from a few years of high volatility corrective/sideways action back to a low volatility strong and continuous up trend in the higher time frames (monthly). Sure hopeful for this because managing through occasional 6%, 11%, and even 20% corrections is really challenging! Verne may like it but I don’t. I like relatively easy (though it’s never easy) and low stress, and selling premium underneath price in a strong bull market is about as easy as things get in trading I believe. Here’s to a few year’s worth of up trending monthly candlesticks! And thanks for the clear heads up re: the coming sequence of 3 successively larger corrections.
I fully agree. Buy and hold investors have experienced volatile sideways movement in the last two years. It has not been very satisfying or rewarding.
I think that is one reason there is so much money on the sidelines right now relatively speaking. As I said several times, once breaking out above the 3000-3020 level, that sidelines money would propel us to 3100. And here we are, almost. Now we have a Minor degree target of 3179. In bull markets, surprises are to the upside along with target adjustments.
Bullish sentiment has increased and this is a short term warning. When the top is in, I suspect bullish sentiment to be very high.
I am guessing today may see a new ATH for OBV. Weekly might come on Friday’s close.
Lara. Question. You mention 3179. Is this where you see the next large pullback correct ?
Yes.
Although it may not be so much of a pullback as a sideways consolidation which may be very shallow.
Congratulations to the Saffas. The best team won. .. awesome display . Unbelievably strong in the scrum.
Fully deserved.
Got it. #1.