
A breach of the channel on the hourly chart indicated a small pullback may be underway.
Price remains above the invalidation point. Both short-term Elliott wave counts remain valid.
Summary: The next target is at 3,120. Overall, expect upwards movement to continue.
For the short term, the next small consolidation or pullback may begin about 3,067.
The biggest picture, Grand Super Cycle analysis, is here.
Monthly charts were last published here, with video here. There are two further alternate monthly charts here, with video here.
ELLIOTT WAVE COUNTS
The two weekly Elliott wave counts below will be labelled First and Second. They may be about of even probability. When the fifth wave currently unfolding on weekly charts may be complete, then these two wave counts will diverge on the severity of the expected following bear market. To see an illustration of this future divergence monthly charts should be viewed.
FIRST WAVE COUNT
WEEKLY CHART
Click chart to enlarge.
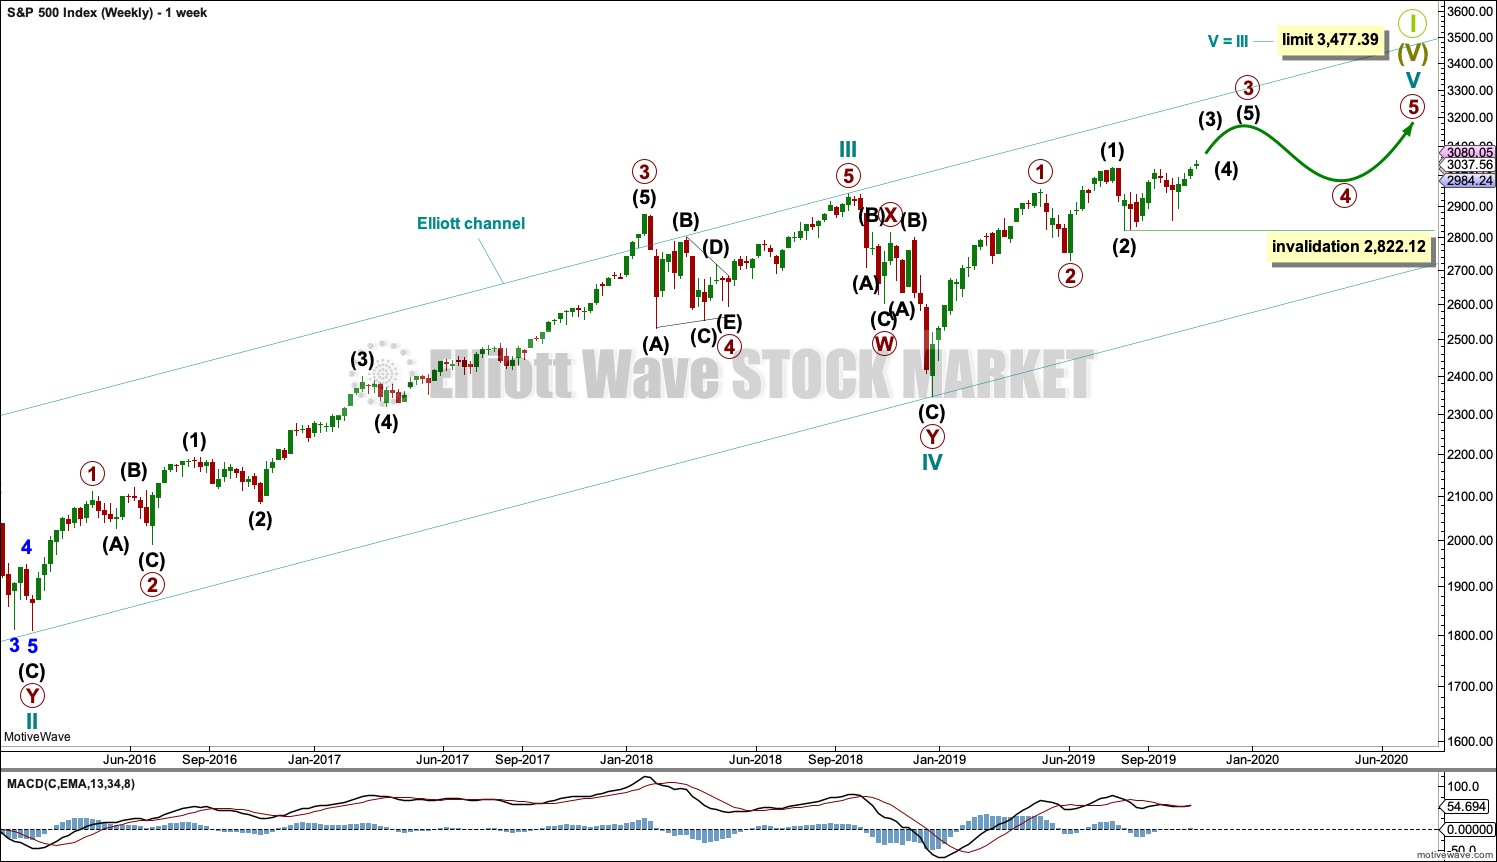
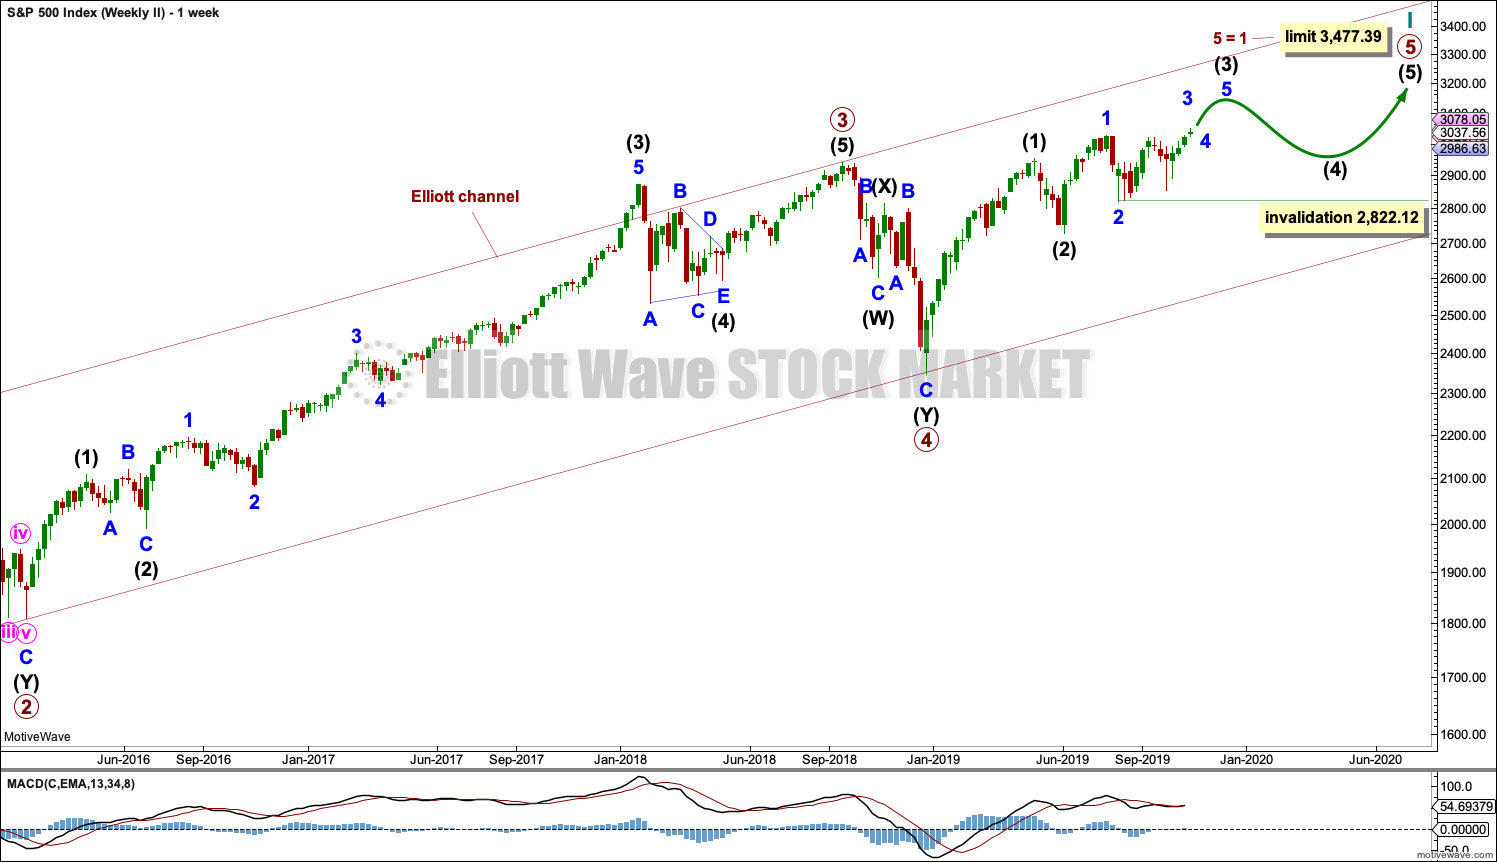
The basic Elliott wave structure consists of a five wave structure up followed by a three wave structure down (for a bull market). This wave count sees the bull market beginning in March 2009 as an incomplete five wave impulse and now within the last fifth wave, which is labelled cycle wave V. This impulse is best viewed on monthly charts. The weekly chart focusses on the end of it.
Elliott wave is fractal. This fifth wave labelled cycle wave V may end a larger fifth wave labelled Super Cycle wave (V), which may end a larger first wave labelled Grand Super Cycle wave I.
The teal Elliott channel is drawn using Elliott’s first technique about the impulse of Super Cycle wave (V). Draw the first trend line from the end of cycle wave I (off to the left of the chart, the weekly candlestick beginning 30th November 2014) to the end of cycle wave III, then place a parallel copy on the end of cycle wave II. This channel perfectly shows where cycle wave IV ended at support. The strongest portion of cycle wave III, the end of primary wave 3, overshoots the upper edge of the channel. This is a typical look for a third wave and suggests the channel is drawn correctly and the way the impulse is counted is correct.
Within Super Cycle wave (V), cycle wave III is shorter than cycle wave I. A core Elliott wave rule states that a third wave may never be the shortest. For this rule to be met in this instance, cycle wave V may not be longer in length than cycle wave III. This limit is at 3,477.39.
Cycle wave V may subdivide either as an impulse or an ending diagonal. Impulses are much more common. An alternate wave count, which looked at the possibility of a diagonal unfolding, has been invalidated with a new all time high.
The daily chart below will focus on movement from the end of intermediate wave (1) within primary wave 3.
In historic analysis, two further monthly charts have been published that do not have a limit to upwards movement and are more bullish than this wave count. Members are encouraged to consider those possibilities (links below summary) alongside the wave counts presented on a daily and weekly basis.
Within cycle wave V, primary waves 1 and 2 may be complete. Within primary wave 3, intermediate waves (1) and (2) may be complete. Within intermediate wave (3), no second wave correction may move beyond its start below 2,822.12.
DAILY CHART
Click chart to enlarge.
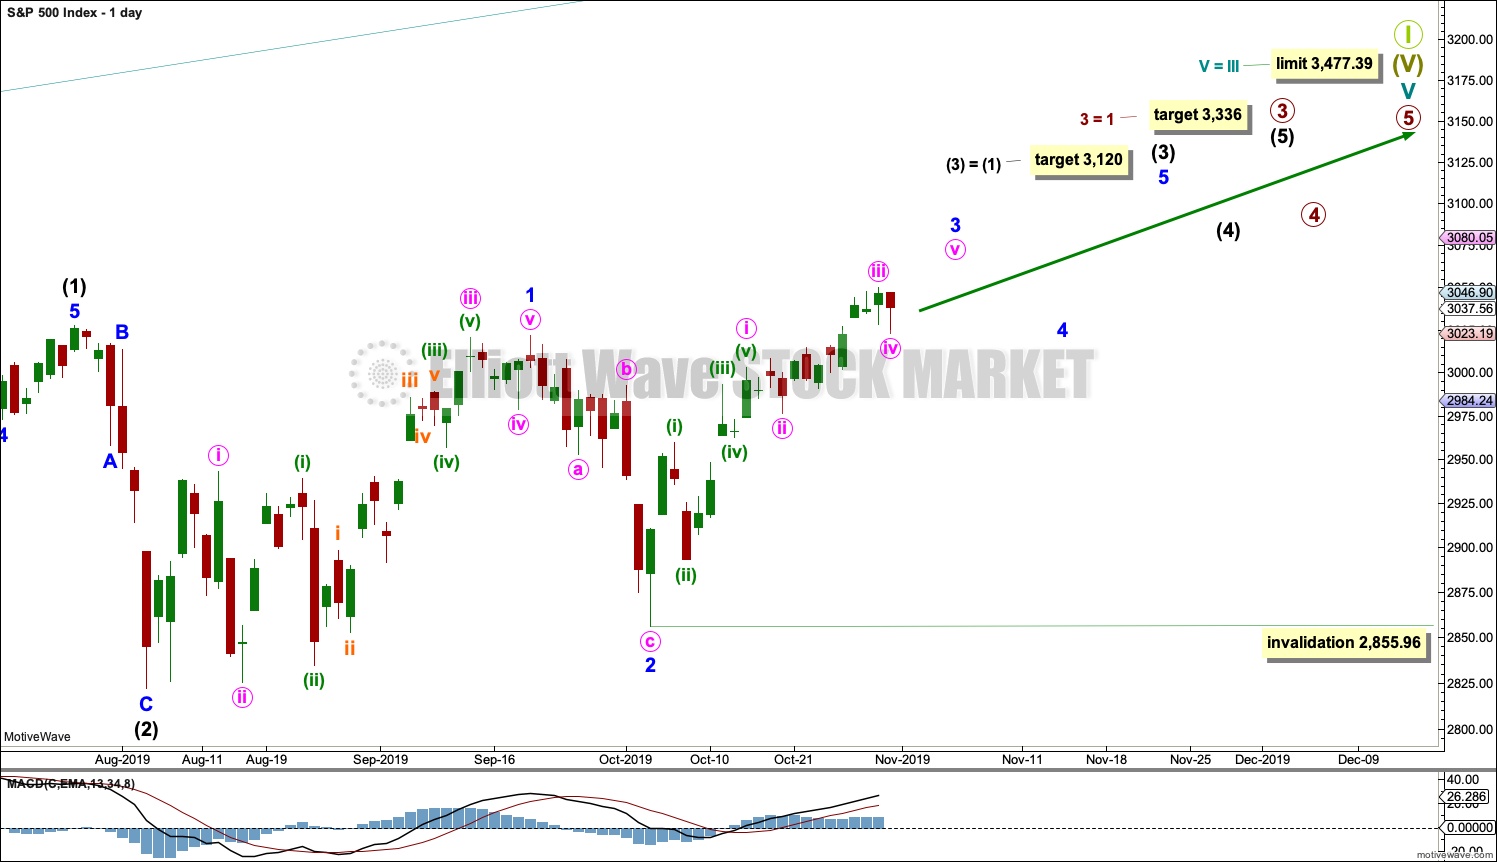
Primary wave 3 may have begun.
All of primary wave 3, intermediate wave (3) and minor wave 3 may only subdivide as impulses. Within each impulse, its second wave correction may not move beyond the start of its first wave.
Minor wave 3 may be underway and may have passed through its middle (main hourly chart). Within minor wave 3, if minute wave ii is yet to unfold (alternate hourly chart below), then it may not move beyond the start of minute wave i below 2,855.96.
Intermediate wave (3) must move far enough above the end of intermediate wave (1) to then allow intermediate wave (4) to unfold and remain above intermediate wave (1) price territory.
HOURLY CHART
Click chart to enlarge.
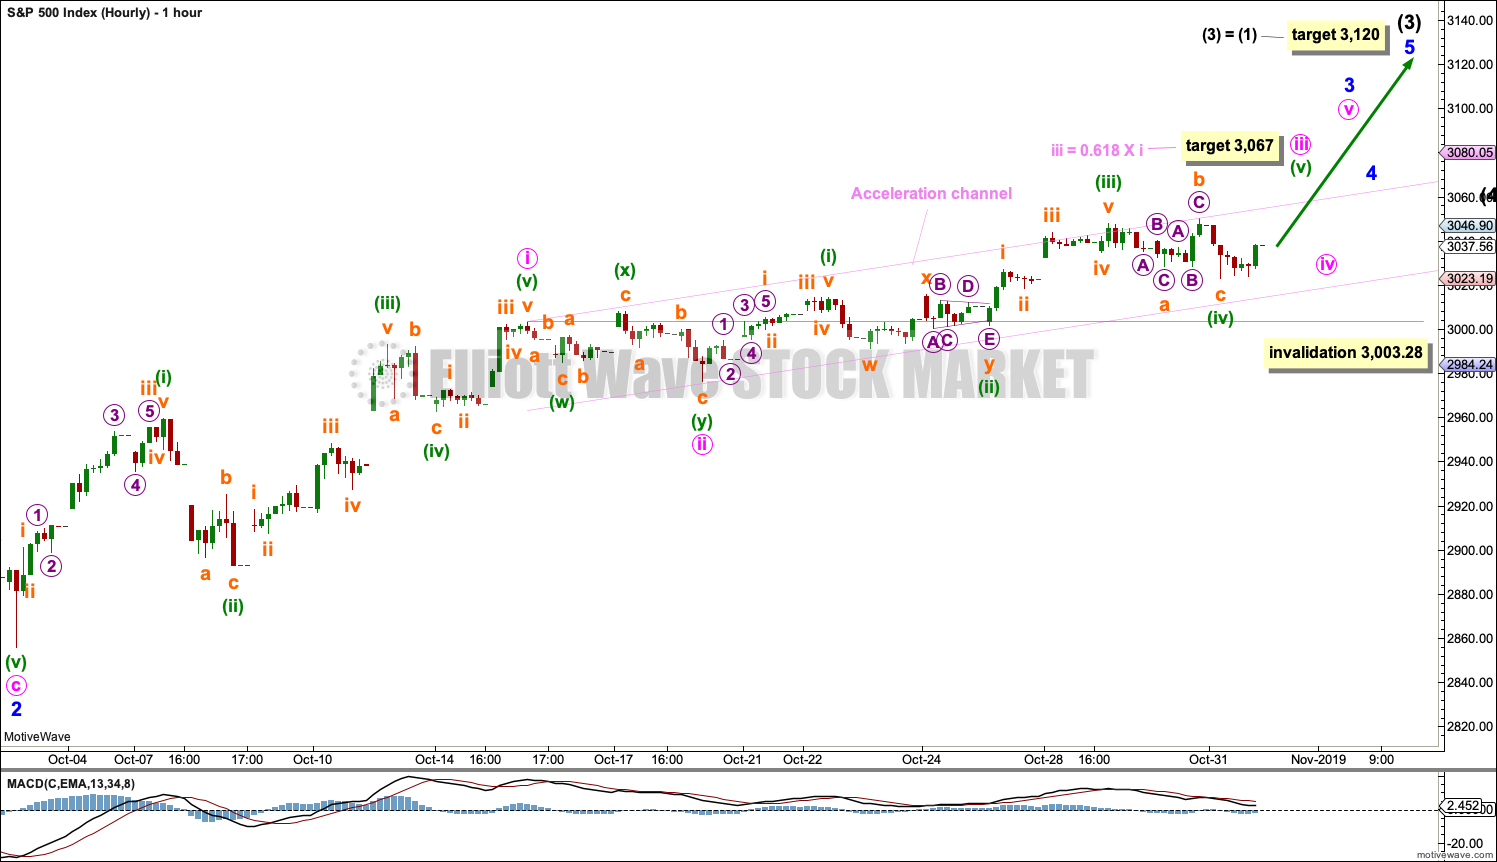
There are multiple ways now to label upwards movement from the end of minor wave 2. It is possible that the middle of the third wave has passed, with weaker momentum than the first wave. The fifth wave may be weaker still so that the third wave is not the weakest.
Within minute wave iii, minuette wave (ii) may have completed as a double combination and now minuette wave (iv) may be complete as an expanded flat.
A target is calculated for minute wave iii to end, which may be met in another one to few days.
Minute wave iv may not move into minute wave i price territory below 3,003.28.
Draw an acceleration channel about the impulse of minor wave 3: draw the first trend line from the end of minute wave i to the last high, then place a parallel copy on the end of minute wave ii. When minute wave iii may be complete, then the lower edge of this channel may provide support for minute wave iv.
This remains the main wave count today because it now fits best with the target for intermediate wave (3) to end.
If price makes a new low below 3,003.28, then use the alternate wave count below.
ALTERNATE HOURLY CHART
Click chart to enlarge.
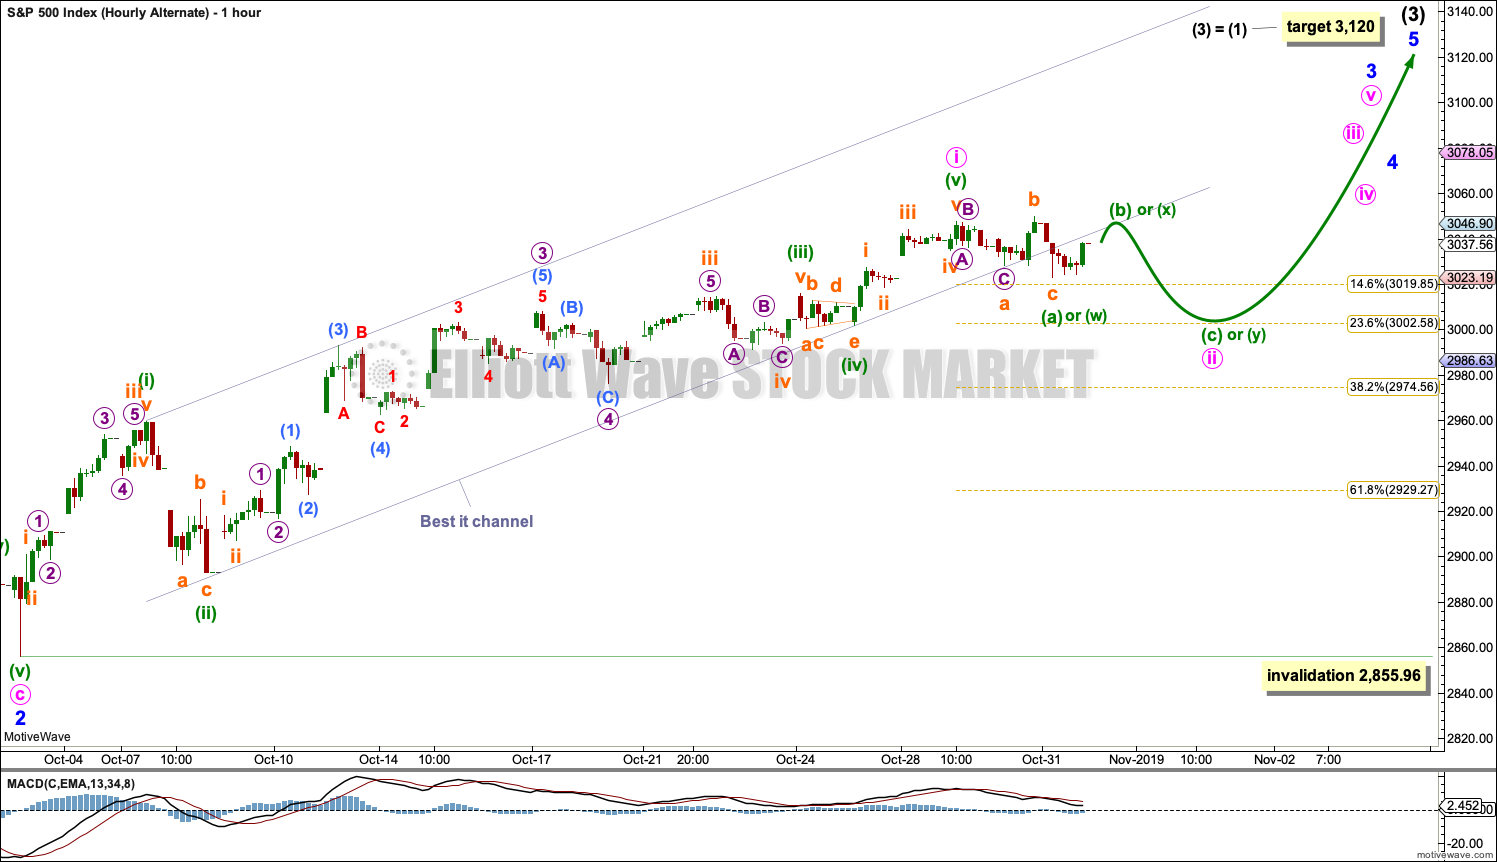
This labelling of upwards movement from the end of minor wave 2 better fits MACD. If minute wave i is complete, then the strongest middle portion of sub-micro wave (3) corresponds with the strongest momentum from MACD.
Minute wave ii may end about the 0.236 Fibonacci ratio. Minute wave ii may not move beyond the start of minute wave i below 2,855.96. The upwards pull of a third wave at three degrees may force minute wave ii to be shallow.
The degree of labelling within minute wave ii is today moved down one degree. Only minuette wave (a) may be complete as a flat correction if minute wave ii continues further as a single flat correction. Minuette wave (a) may also be relabelled minuette wave (w) if minute wave ii unfolds as a double flat or double combination.
If minute wave ii continues further as a single flat correction, then within it minuette wave (b) must retrace a minimum 0.90 length of minuette wave (a) at 3,045.40 or above. Thereafter, minuette wave (c) should move below the end of minuette wave (a) at 3,023.19 to avoid a truncation.
If minute wave ii continues as a double flat or double combination, then minuette wave (w) may be a complete flat correction. Minuette wave (x) may be complete. Or it may move higher; there is no minimum requirement for the length of minuette wave (x) within a double. Minuette wave (y) may unfold as either a zigzag or triangle if minute wave ii is a double combination, or as a flat if minute wave ii is a double flat. Minuette wave (y) may end about the same level as minuette wave (w) at 3,023.19, so that the whole structure takes up time and moves sideways.
Today this wave count remains an alternate because there is not much room above for the structure of intermediate wave (3) to complete before the target at 3,120.
SECOND WAVE COUNT
WEEKLY CHART
Click chart to enlarge.
This weekly chart is almost identical to the first weekly chart, with the sole exception being the degree of labelling.
This weekly chart moves the degree of labelling for the impulse beginning in March 2009 all down one degree. This difference is best viewed on monthly charts.
The impulse is still viewed as nearing an end; a fifth wave is still seen as needing to complete higher. This wave count labels it primary wave 5.
Primary wave 5 may be subdividing as either an impulse, in the same way that cycle wave V is seen for the first weekly chart.
TECHNICAL ANALYSIS
WEEKLY CHART
Click chart to enlarge. Chart courtesy of StockCharts.com.
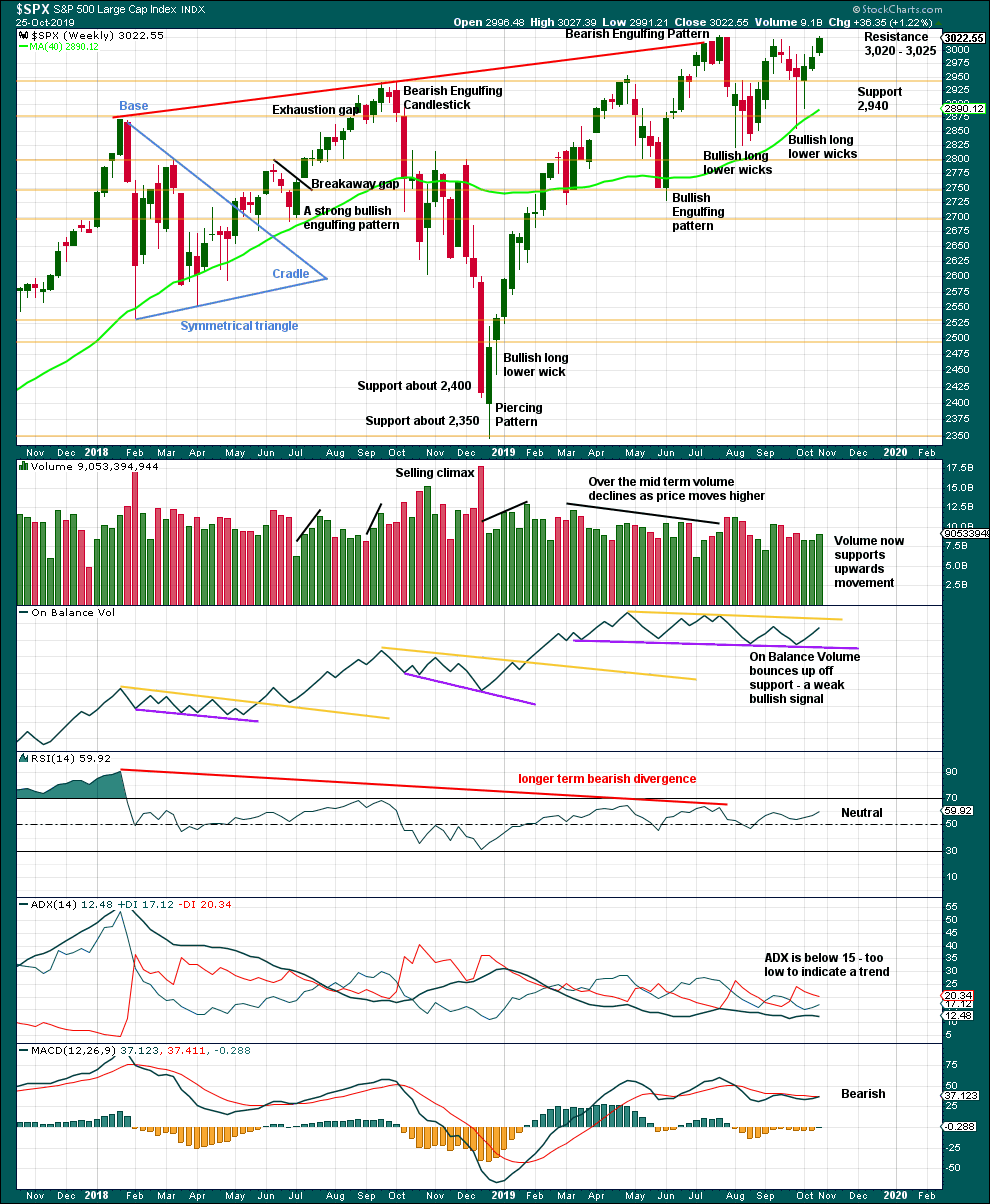
There is still a series of higher highs (with the exception of the last high) and higher lows from the low in December 2018. This is the basic definition of an upwards trend. For that view to shift then a lower low below 2,822.12 would need to be seen.
Last week looks more clearly bullish with some support from volume. There is strong resistance which has been overcome.
DAILY CHART
Click chart to enlarge. Chart courtesy of StockCharts.com.
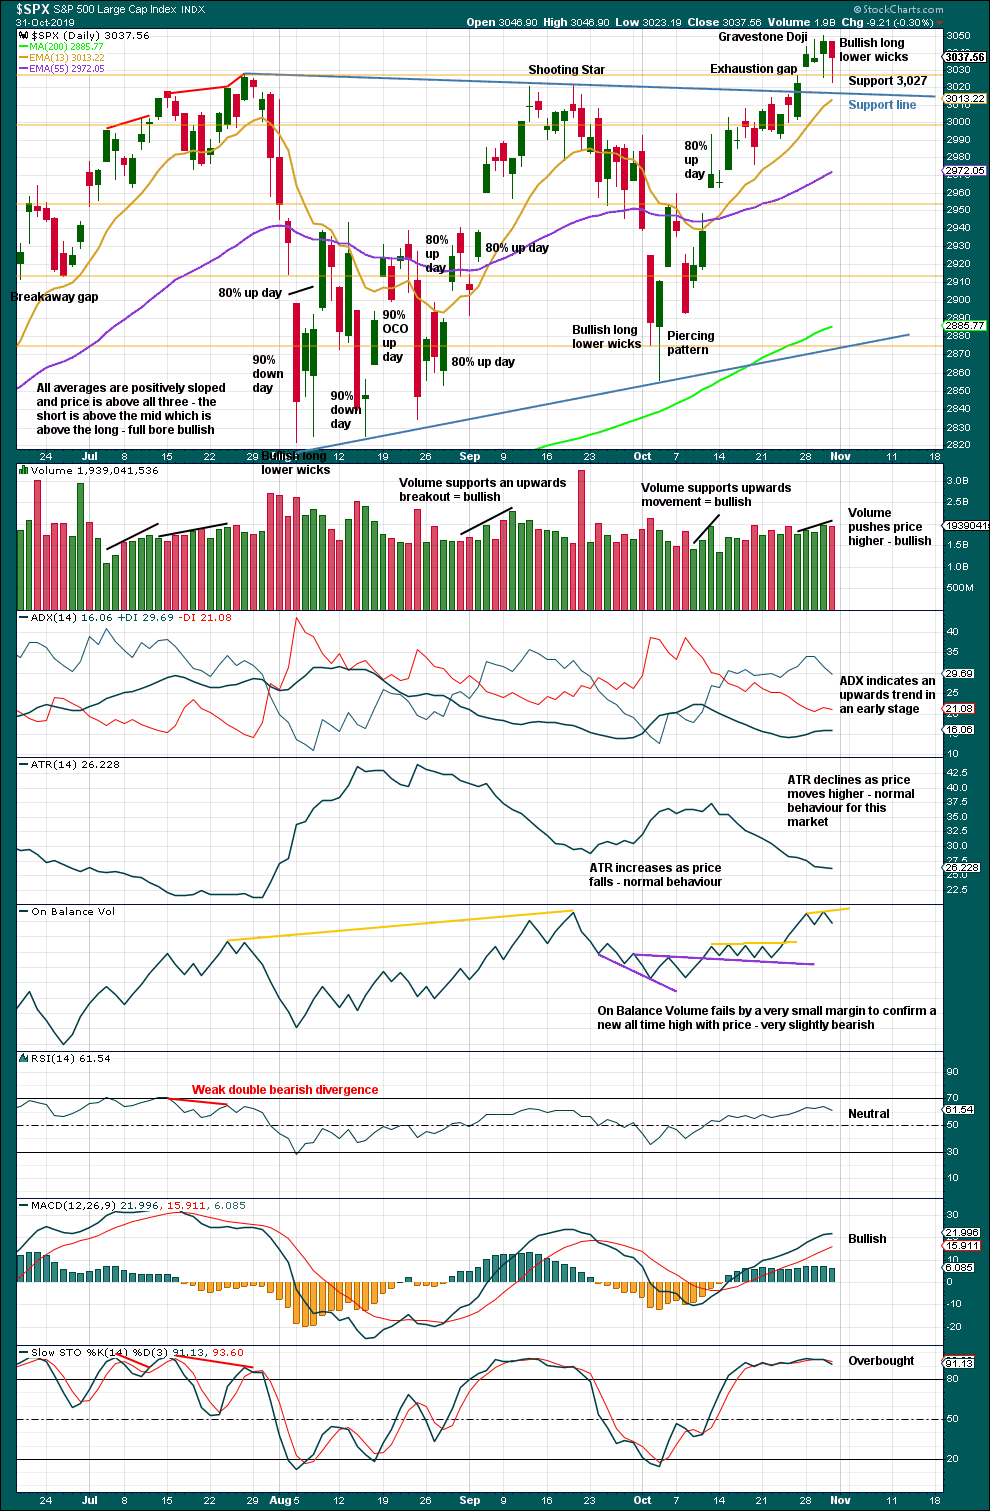
There is now a series of higher highs and higher lows since the 5th of August. Strength in 90% up days and back to back 80% up days off lows indicate the lows may still be sustainable.
Closure of the breakaway gap indicates it should now be considered an exhaustion gap. Along with the Gravestone Doji, this is bearish.
Two long lower wicks now in a row is fairly bullish. Support about 3,027 has not been broken on a closing basis; it may continue to be strong. This last session looks like a fairly normal and common test of support after a breakout.
BREADTH – AD LINE
WEEKLY CHART
Click chart to enlarge. Chart courtesy of StockCharts.com. So that colour blind members are included, bearish signals
will be noted with blue and bullish signals with yellow.
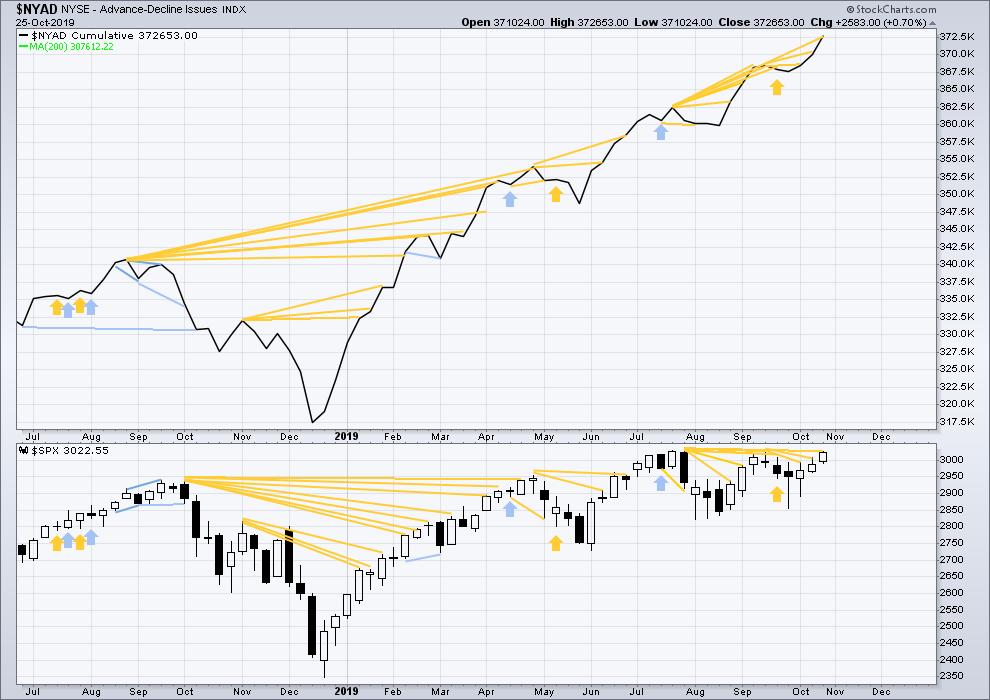
Bear markets from the Great Depression and onwards have been preceded by an average minimum of 4 months divergence between price and the AD line with only two exceptions in 1946 and 1976. With the AD line making new all time highs again this week, the end of this bull market and the start of a new bear market is very likely a minimum of 4 months away, which is end February 2020.
In all bear markets in the last 90 years there is some positive correlation (0.6022) between the length of bearish divergence and the depth of the following bear market. No to little divergence is correlated with more shallow bear markets. Longer divergence is correlated with deeper bear markets.
If a bear market does develop here, it comes after no bearish divergence. It would therefore more likely be shallow.
Last week only large caps have made a new high above the prior swing high in mid September. Small and mid caps have not. This current rise is driven mostly by larger caps, which is a feature more typical of an aged bull market.
The new all time high from the AD line last week is again a very bullish signal. This strongly supports the main Elliott wave count.
DAILY CHART
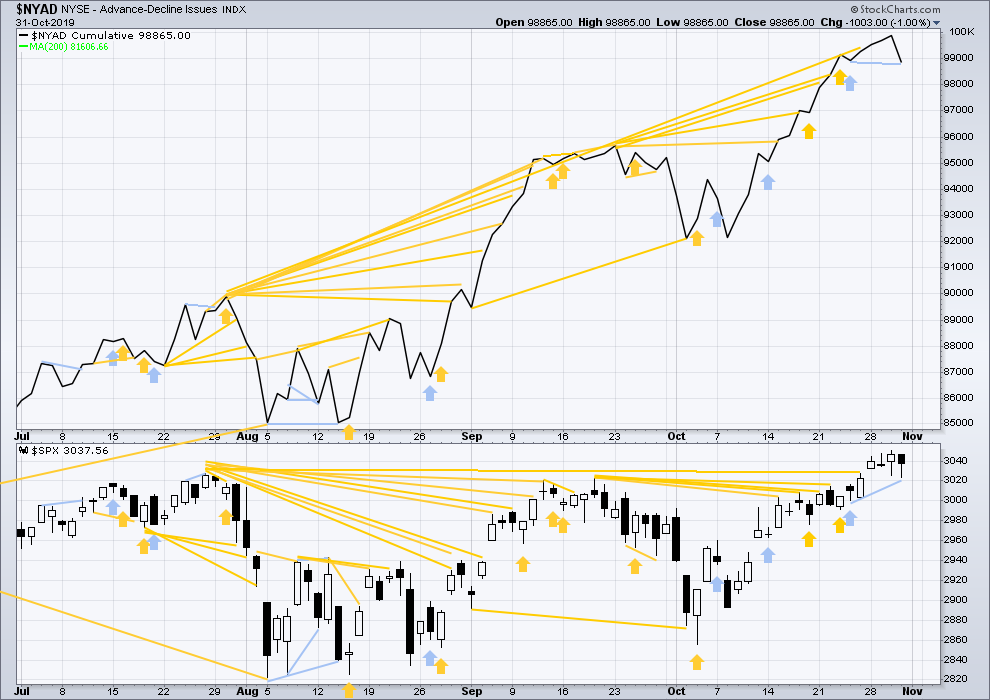
Click chart to enlarge. Chart courtesy of StockCharts.com. So that colour blind members are included, bearish signals
will be noted with blue and bullish signals with yellow.
Breadth should be read as a leading indicator.
Today the AD line has made a new short-term low below the low of the 24th of October, but price has not. This divergence is bearish for the short term and supports the alternate hourly Elliott wave count.
VOLATILITY – INVERTED VIX CHART
WEEKLY CHART
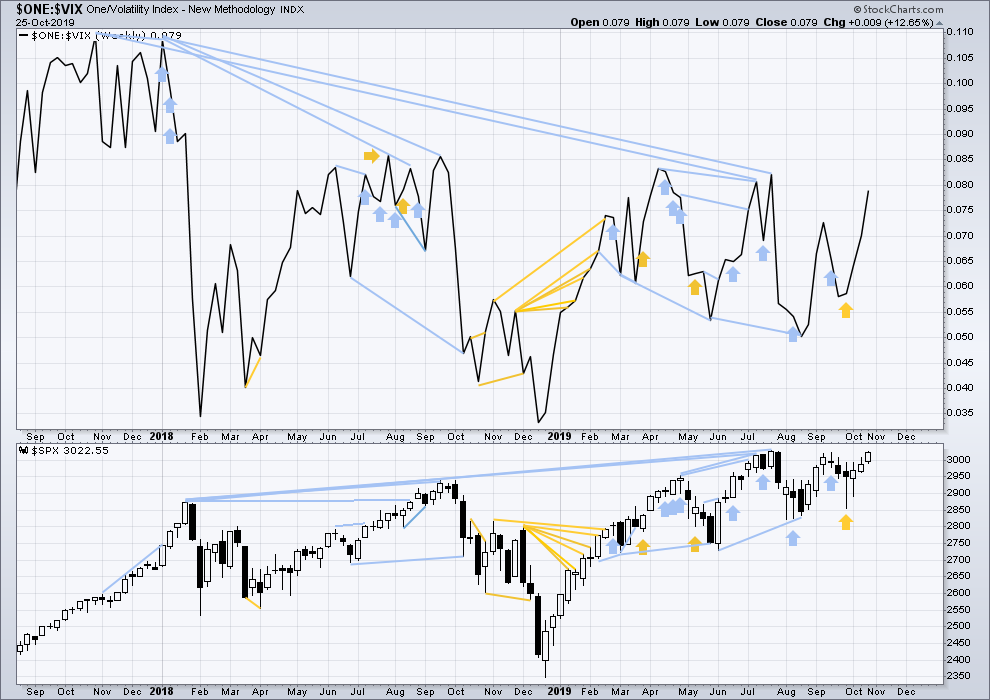
Click chart to enlarge. Chart courtesy of StockCharts.com. So that colour blind members are included, bearish signals
will be noted with blue and bullish signals with yellow.
The all time high for inverted VIX (which is the same as the low for VIX) was on 30th October 2017. There is now almost two years of bearish divergence between price and inverted VIX.
The rise in price is not coming with a normal corresponding decline in VIX; VIX remains elevated. This long-term divergence is bearish and may yet develop further as the bull market matures.
This divergence may be an early warning, a part of the process of a top developing that may take years. It may not be useful in timing a trend change.
Last week both price and inverted VIX have moved higher. Both have made new short-term swing highs. There is no new divergence.
DAILY CHART
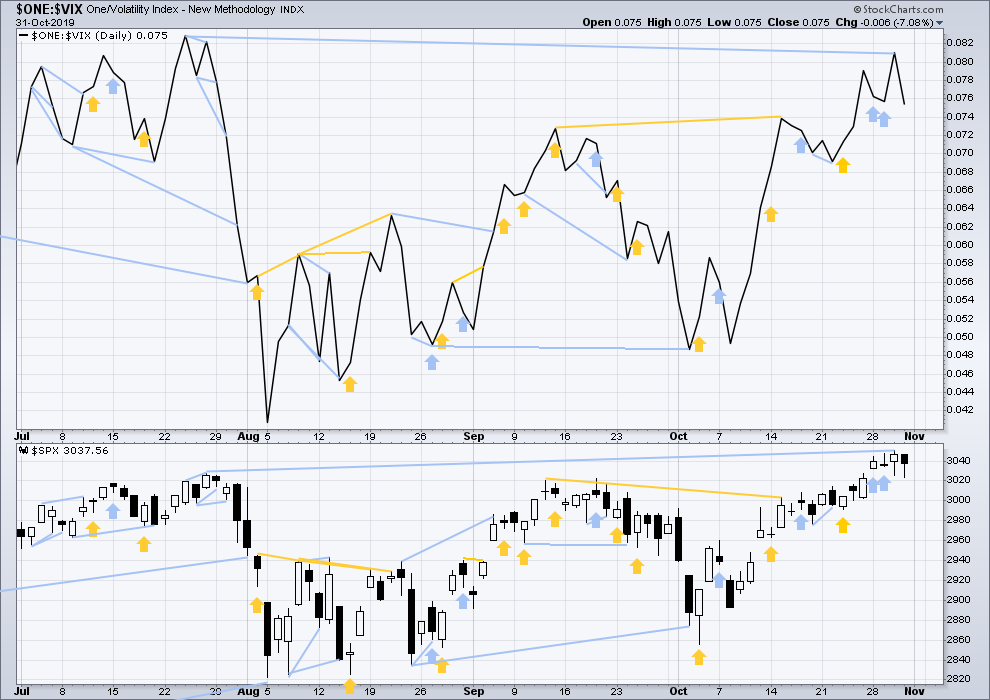
Click chart to enlarge. Chart courtesy of StockCharts.com. So that colour blind members are included, bearish signals
will be noted with blue and bullish signals with yellow.
Today both price and inverted VIX have moved lower. Neither have made new short-term swing lows. There is no divergence to confirm divergence between price and the AD line today.
DOW THEORY
Dow Theory confirmed a bear market in December 2018. This does not necessarily mean a bear market at Grand Super Cycle degree though; Dow Theory makes no comment on Elliott wave counts. On the 25th of August 2015 Dow Theory also confirmed a bear market. The Elliott wave count sees that as part of cycle wave II. After Dow Theory confirmation of a bear market in August 2015, price went on to make new all time highs and the bull market continued.
DJIA: 23,344.52 – a close on the 19th of December at 23,284.97 confirms a bear market.
DJT: 9,806.79 – price has closed below this point on the 13th of December.
S&P500: 2,532.69 – a close on the 19th of December at 2,506.96 provides support to a bear market conclusion.
Nasdaq: 6,630.67 – a close on the 19th of December at 6,618.86 provides support to a bear market conclusion.
With all the indices having moved higher following a Dow Theory bear market confirmation, Dow Theory would confirm a bull market if the following highs are made:
DJIA: 26,951.81 – a close above this point has been made on the 3rd of July 2019.
DJT: 11,623.58 – to date DJT has failed to confirm an ongoing bull market.
S&P500: 2,940.91 – a close above this point was made on the 29th of April 2019.
Nasdaq: 8,133.30 – a close above this point was made on the 26th of April 2019.
Published @ 06:17 p.m. EST.
—
Careful risk management protects your trading account(s).
Follow my two Golden Rules:
1. Always trade with stops.
2. Risk only 1-5% of equity on any one trade.
—
New updates to this analysis are in bold.
When you’ve had so little surf for months and you miss the beach and you’ve got lots of work to do…. you go work at the beach.
I’m discarding the alternate hourly now, it just doesn’t make sense anymore.
This main hourly does.
Until intermediate wave (3) is complete (not yet) corrections may be shallow. Minor 4 may be shallow but time consuming, reliving overbought conditions.
*relieving
Hi Lara,
Based on Rodney’s comments on OBV, could you comment in your video this weekend?
I can see on your charts definite divergence on wkly, daily- barely any.
Thank you and good weekend…Melanie
Yes, I will definitely be looking at OBV carefully this week
All this bullishness I am exuding is tempered by one fly in the ointment; one BIG fly.
SPX daily on-balance volume has not made a new ATH since September 19th. Negative divergence.
SPX weekly on-balance volume has not made a new ATH since May 3rd. Again, Negative divergence.
This is quite concerning to me and Joe Granville, the inventor of On-Balance Volume analysis and acquaintance of mine, would most likely be calling for a top in place.
Is that Interim Top? Or longer term top?
Based on STOXX, DAX, NDX & possibly RTY count… there’s a possibility that this is (was) a final fifth wave since the bottom early Oct, so possibly a few days of correction but SPX is a beast on it’s own..
Here’s how I see RUT. My labeling might all be one degree too low. And of course this is the bull count; what I have as minor 1, 2, and now 3 in progress (in a continuing minute i up) could in fact be more of the massive corrective action over the last 20 some months.
Oops, messed up a few labels there…here’s a better version. Constructive criticism more than welcome!
You can’t label minor Y as w-x-y
That violates the rule that the maximum number of corrective structures in a multiple is three, because now you have four.
Could (2) be a huge flat, with C beginning where you have minute b within minor W, and subdividing as an ending contracting diagonal? Not sure if the wave lengths work for that… but that would be my next attempt to figure that correction out
This would be a 3 in the “final fifth” on the SPX. The only reason to be short would be to tactically play a 4, but you still have at minimum a 5 of 5 to higher levels before you can reasonably try a short.
We’ll, there are now 5 waves up, and SPX is entering short term target area. A little retracement may be due…
Hi Hash_Trader. I am not making any projections about a top. What I am pointing out is that bull market new highs at some point must be confirmed by On-Balance volume new highs. This has not happened for some time with the SPX at the daily or weekly time frames. It is a warning signal. If we do not get a new ATH for OBV soon at these time frames, it will be a stronger warning. But it does not tell us what wave degree will be the following correction.
I just checked the OBV at the monthly level. October has produced a new ATH for OBV for the SPX. That is good news supporting the current wave count. But it does not eliminate the need for new highs at the weekly and daily levels.
I hope this helps clarify my comments a bit.
I see it as a warning too. But not great at timing when a bigger correction may arrive.
I’m not seeing it as a warning of the end of the bull market, only a warning of an interim top which may be either minor 3 ending, or intermediate (3) ending.
It appears likely to me that this market is going to get out the swatter and smash that fly pretty soon here. Both are awfully close to ATH’s, and much of any continued bullish action and I think both will go “green light”. The daily may even make it by close of today.
Checking further, the NYSE did make a new ATH for On-Balance volume on July 26th confirming its rally. This brings some slight assurance. Note: NYSE is just today breaking out and up from an inverse head and shoulder’s pattern I published on October 18th. Below is the updated weekly chart.
Wise words
Well, well, well, we have a surprisingly strong USA payroll report and a surprisingly strong open on the US equity markets. In a bull trend, especially a 3rd wave at several degree, surprises will be to the upside. It is such a pleasure to be riding this green wave. As we say out in the western states, “Yee Ha!” Since October 3rd, the SPX has moved up almost 200 points!
Thank you Lara for your always excellent analysis and commentary. I have followed dozens of EW and other types of TA commentators over the years. I have been with EWSM since very early 2012. Lara, you are consistently the best by far. Have a great weekend and start catching some of those waves made out of H2O.
I second that motion, exceptional work Lara through the entire 2019 year. The ONLY consistently bullish analyst through it all…and the only one consistently accurate through it all!
I’m reloading by selling fresh put spreads, LMT, EW, and PANW today. On top of holdings of PG, UNH, AMP, ILMN, ISRG, UNP, ZEN. Also several in SPX and RUT. For a mix of Nov, Dec and Jan expiry.
Selling options that will expire worthless to the retail traders is a great way to go! Relatively easy money, in my view. And when it comes to risk and reward, I like easy!
I am back home now and so will be here prior to NY close for the Friday session to update hourly charts for you.
I think you should remove this expectation from yourself and members. If you are able to comment intraday from time to time, that is above and beyond the call and the promise. At critical moments it is certainly a great help. But many or most of the days, like the last week or two, it really is not necessary. Just my two cents.
That’s okay Rodney, while I try to do it and manage most days, if I can’t be here for whatever reason I’m not gonna be disappointed in myself. Because then there might be one too many disappointed people 🙂
Of all the markets I analyse it is the S&P that I enjoy the most. I open my charts in the morning with a coffee and it’s kinda like opening a Christmas present. What’s inside? Have I got it right?
Now that I’ve been doing this for over 11 years and I’m a CMT my accuracy rate has improved which improves my confidence in the method I’m using. So I hardly ever get that awful sinking feeling upon opening charts and seeing price move very strongly in a direction I didn’t expect.
I like the daily wrap-up before the close tremendously. Thank you!
The overnight market is moving up. But looking at /ES with overnight data, the chart pattern looks very similar to the evening of 9/23, after which there was a week or two of over 100 pts down in the SPX. Watch out for any early morning and then strong selling.
I lightened my total long exposure by almost 50% Thursday by closing out nicely profitable and some barely profitable sold spreads. I’ll load up again when there’s renewed indications of bullish action.
The “renewed indication” didn’t take long! That’s alright by me…play defensive, and when all the lights are green, pile on!