
Upwards movement for the session unfolded with a higher high and a higher low. This was expected.
Today On Balance Volume gives a reasonable signal that shall be given weight in this analysis. It supports the main hourly Elliott wave count.
Summary: Upwards movement may continue here to new all time highs soon. The next target is at 3,120. A reasonable bullish signal today from On Balance Volume supports the view of more upwards movement tomorrow.
For the very short term, a new low below 2,976.31 would indicate a short-term pull back. The target would be about 2,953.
A new low below 2,822.12 would add confidence to an alternate. Expect price at that stage to keep falling to 2,578 – 2,476 to find support at the lower edge of the large teal channel on weekly and daily charts. This alternate has a very low probability.
The biggest picture, Grand Super Cycle analysis, is here.
Monthly charts were last published here, with video here. There are two further alternate monthly charts here, with video here.
ELLIOTT WAVE COUNTS
The two weekly Elliott wave counts below will be labelled First and Second. They may be about of even probability. When the fifth wave currently unfolding on weekly charts may be complete, then these two wave counts will diverge on the severity of the expected following bear market. To see an illustration of this future divergence monthly charts should be viewed.
FIRST WAVE COUNT
MAIN WEEKLY CHART
Click chart to enlarge.
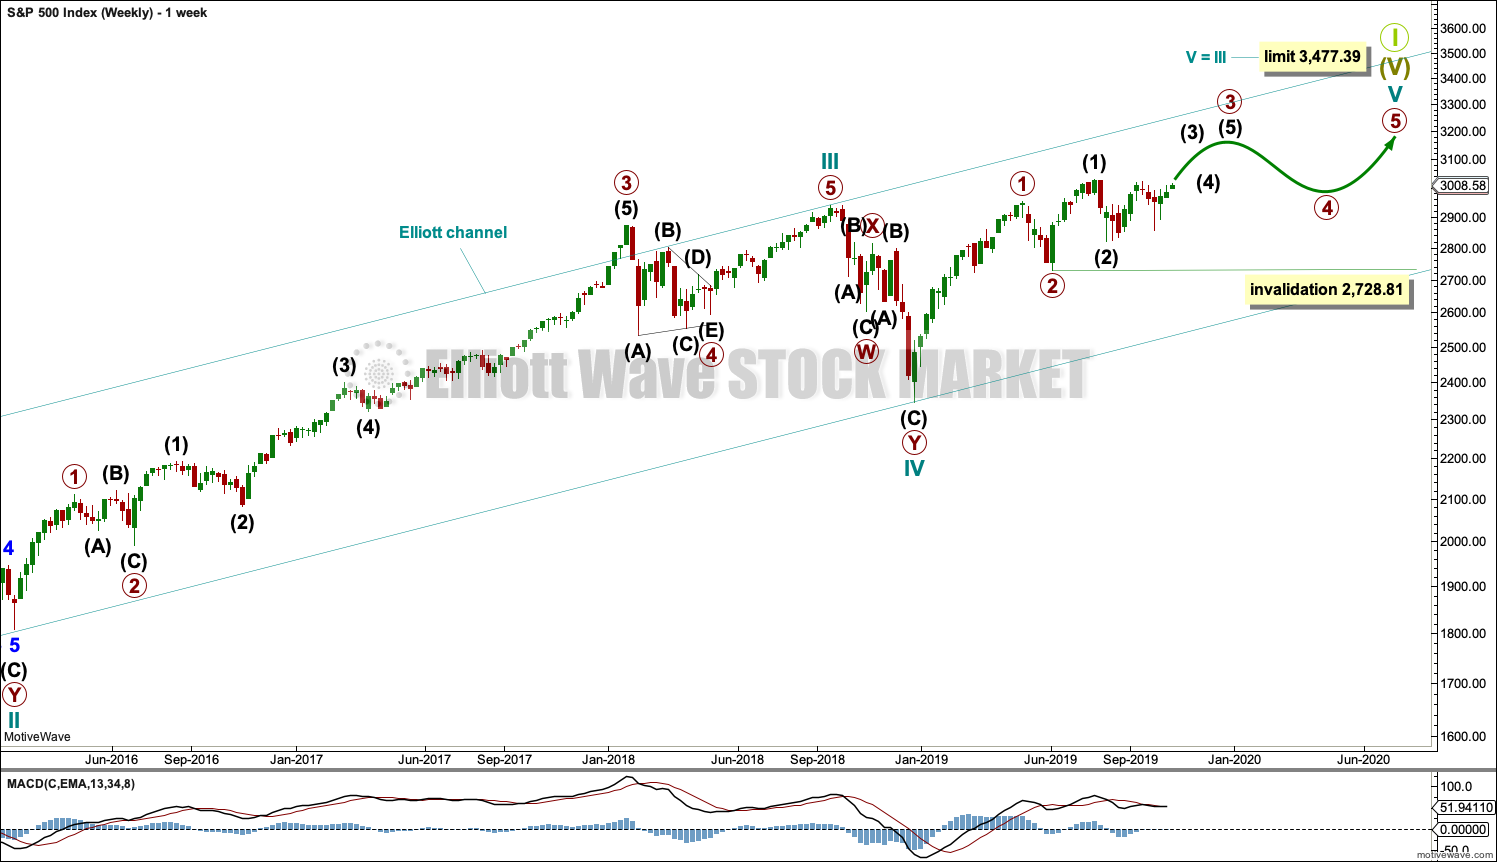
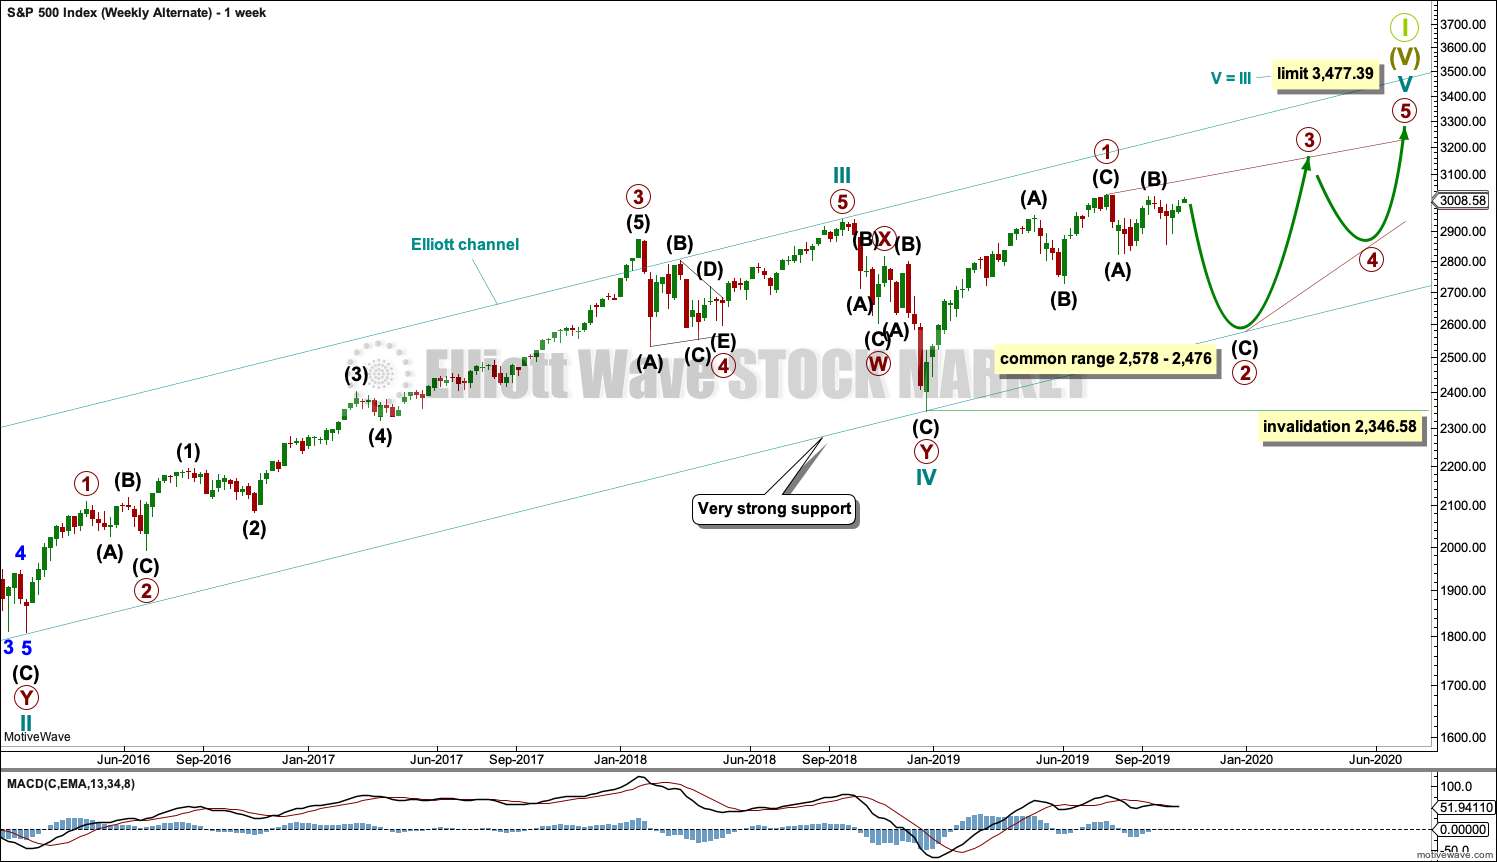
The basic Elliott wave structure consists of a five wave structure up followed by a three wave structure down (for a bull market). This wave count sees the bull market beginning in March 2009 as an incomplete five wave impulse and now within the last fifth wave, which is labelled cycle wave V. This impulse is best viewed on monthly charts. The weekly chart focusses on the end of it.
Elliott wave is fractal. This fifth wave labelled cycle wave V may end a larger fifth wave labelled Super Cycle wave (V), which may end a larger first wave labelled Grand Super Cycle wave I.
The teal Elliott channel is drawn using Elliott’s first technique about the impulse of Super Cycle wave (V). Draw the first trend line from the end of cycle wave I (off to the left of the chart, the weekly candlestick beginning 30th November 2014) to the end of cycle wave III, then place a parallel copy on the end of cycle wave II. This channel perfectly shows where cycle wave IV ended at support. The strongest portion of cycle wave III, the end of primary wave 3, overshoots the upper edge of the channel. This is a typical look for a third wave and suggests the channel is drawn correctly and the way the impulse is counted is correct.
Within Super Cycle wave (V), cycle wave III is shorter than cycle wave I. A core Elliott wave rule states that a third wave may never be the shortest. For this rule to be met in this instance, cycle wave V may not be longer in length than cycle wave III. This limit is at 3,477.39.
Cycle wave V may subdivide either as an impulse or an ending diagonal. Impulses are much more common. This main wave count expects that cycle wave V may be unfolding as an impulse.
The daily chart below will focus on movement from the end of intermediate wave (1) within primary wave 3.
In historic analysis, two further monthly charts have been published that do not have a limit to upwards movement and are more bullish than this wave count. Members are encouraged to consider those possibilities (links below summary) alongside the wave counts presented on a daily and weekly basis.
Within cycle wave V, primary waves 1 and 2 may be complete. Within primary wave 3, intermediate wave (2) may not move beyond the start of intermediate wave (1) below 2,728.81.
MAIN DAILY CHART
Click chart to enlarge.
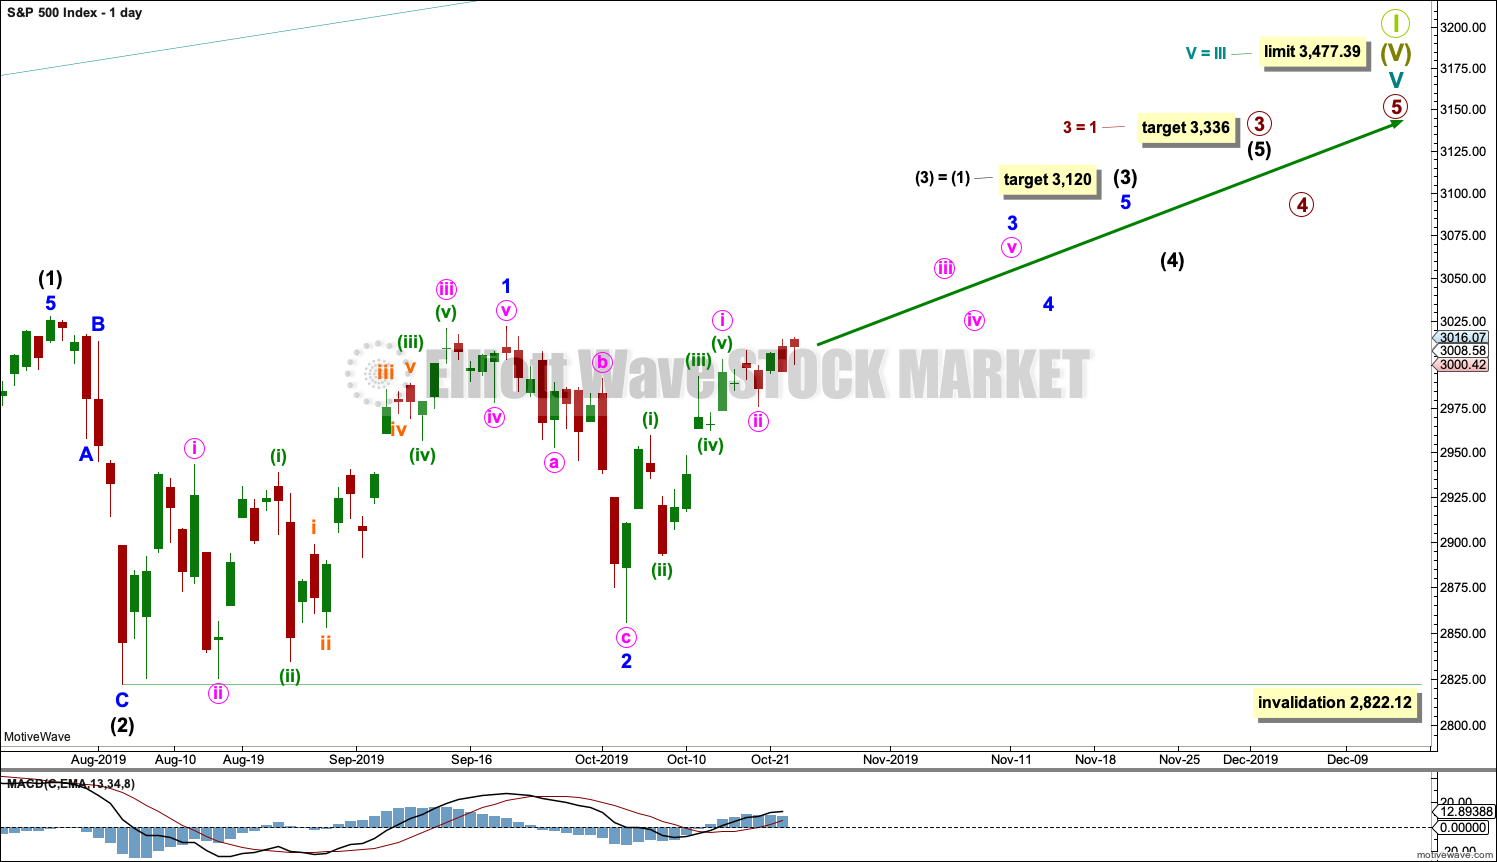
Primary wave 3 may have begun.
All of primary wave 3, intermediate wave (3) and minor wave 3 may only subdivide as impulses. Within each impulse, its second wave correction may not move beyond the start of its first wave.
Minor wave 2 may not move beyond the start of minor wave 1 below 2,822.12. It is still possible that minor wave 2 may continue lower as a double zigzag. The invalidation point is left the same to allow for this possibility. If price makes a new all time high in coming days, then the invalidation point will be moved upwards to the end of minor wave 2 at 2,855.96.
Minute wave i looks like a completed five wave impulse at the daily chart level.
Intermediate wave (3) must move far enough above the end of intermediate wave (1) to then allow intermediate wave (4) to unfold and remain above intermediate wave (1) price territory.
HOURLY CHART
Click chart to enlarge.
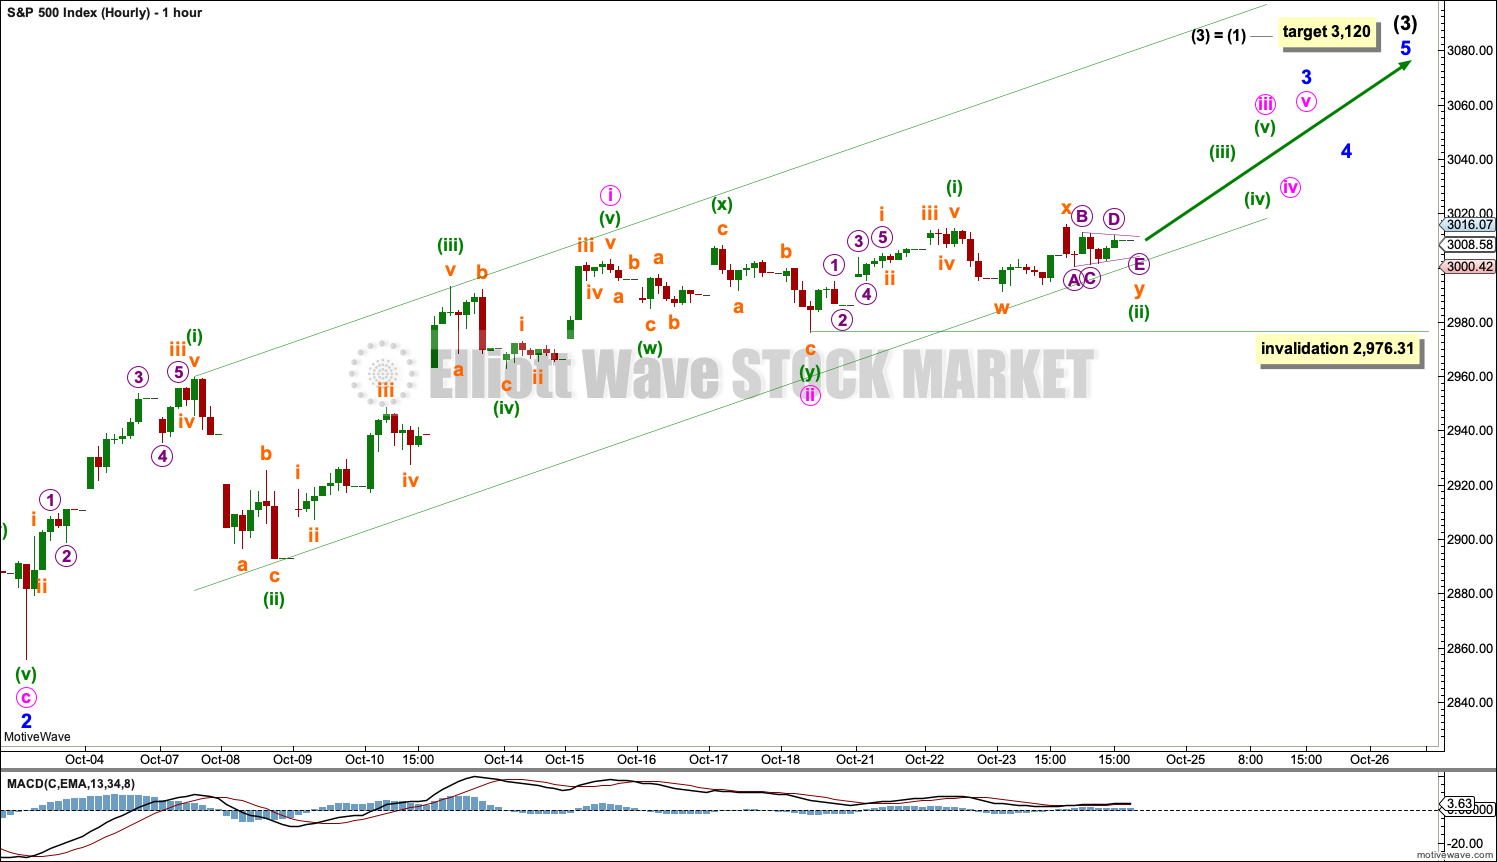
Minor wave 2 should be over.
Minor wave 3 may only subdivide as an impulse. Within the impulse, minute waves i and ii may be over. Minute wave ii may have completed as a relatively brief and shallow double zigzag.
Minute wave iii may have begun. Within minute wave iii, minuette wave (ii) may not move beyond the start of minuette wave (i) below 2,976.31. Minuette wave (ii) remains contained within the Elliott channel. The lower edge of this channel may continue to provide support if minuette wave (ii) continues as a combination as labelled with a zigzag – X – triangle.
If price makes a new low below 2,976.31 in the next day or so, then the alternate hourly chart below may be used.
ALTERNATE HOURLY CHART
Click chart to enlarge.
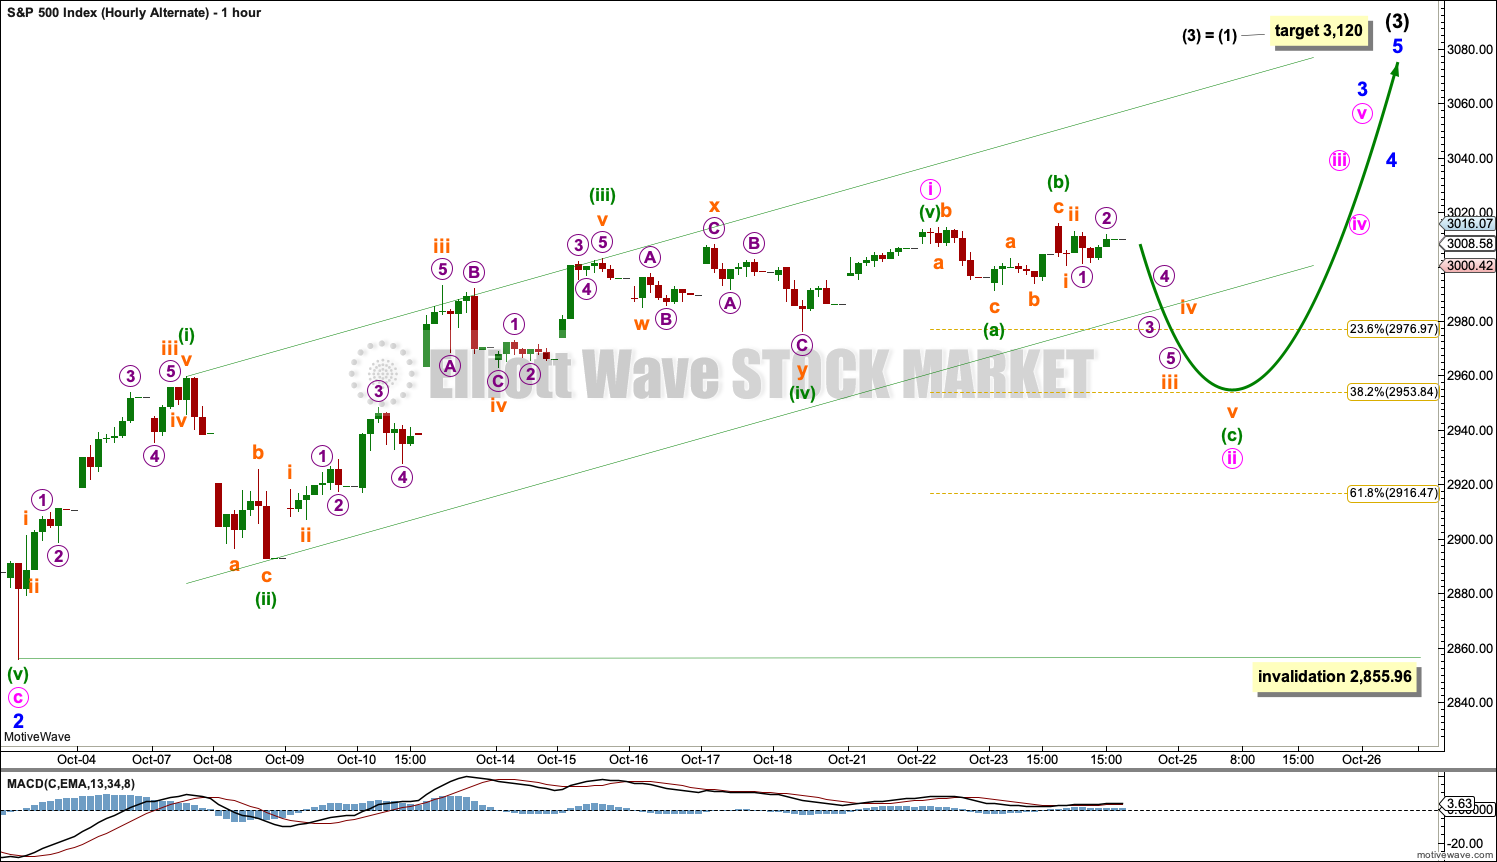
Today this wave count is relabelled.
Minor wave 3 must subdivide as an impulse. Minute wave i may have been complete at the high for the 22nd of October. Minute wave ii may have begun there.
Minute wave ii may be subdividing as an expanded flat correction. Within the flat, both minuette waves (a) and (b) both subdivide as three wave structures. Minuette wave (b) is a 1.07 length of minuette wave (a), indicating an expanded flat correction, which is within the common range of 1 to 1.38.
Minuette wave (c) may bring price down to the 0.382 Fibonacci of minute wave i.
ALTERNATE WEEKLY CHART
Click chart to enlarge.
Cycle wave V may be subdividing as an ending diagonal. Within ending diagonals, all sub-waves must subdivide as zigzags. Primary wave 1 may be over at the last all time high as a zigzag.
Primary wave 2 must complete lower as a zigzag.
The second and fourth waves within diagonals are usually very deep, commonly between 0.81 to 0.66 the depth of the prior wave. This gives a target zone for primary wave 2.
Primary wave 2 may end if it comes down to find support at the lower edge of the teal channel, which is copied over from monthly and weekly charts. This trend line should provide final support for a deeper pullback.
Primary wave 2 may not move beyond the start of primary wave 1 below 2,346.58.
Within primary wave 2, intermediate wave (B) may not move beyond the start of intermediate wave (A) above 3.027.98. A new all time high would invalidate this wave count.
This alternate wave count is provided only for those members who wish to follow a more bearish wave count due to their own personal analysis. It is my judgement that this wave count has a very low probability.
SECOND WAVE COUNT
WEEKLY CHART
Click chart to enlarge.
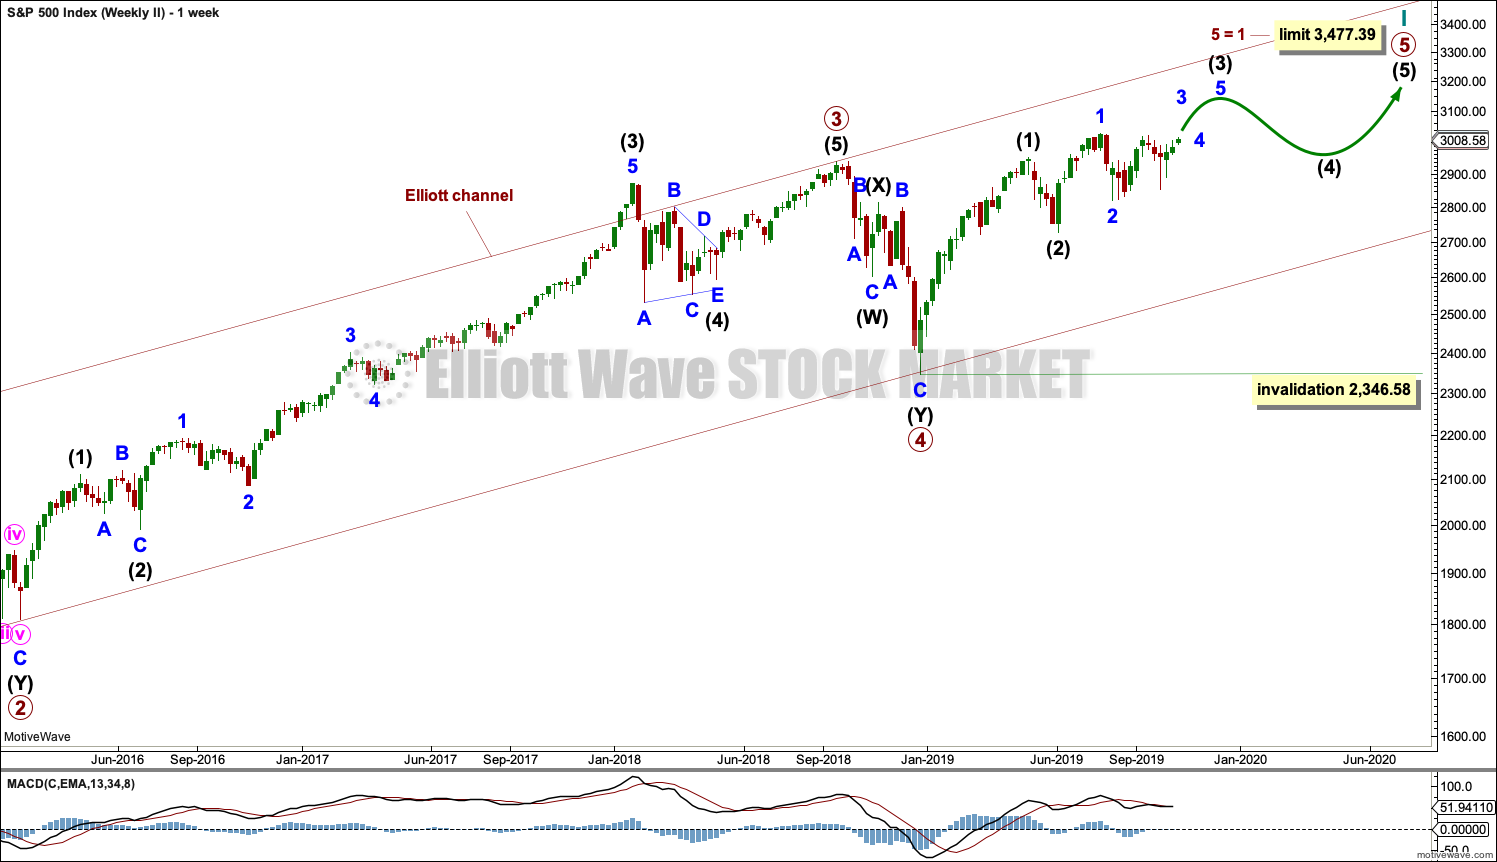
This weekly chart is almost identical to the first weekly chart, with the sole exception being the degree of labelling.
This weekly chart moves the degree of labelling for the impulse beginning in March 2009 all down one degree. This difference is best viewed on monthly charts.
The impulse is still viewed as nearing an end; a fifth wave is still seen as needing to complete higher. This wave count labels it primary wave 5.
Primary wave 5 may be subdividing as either an impulse or ending diagonal, in the same way that cycle wave V is seen for the first weekly chart.
TECHNICAL ANALYSIS
WEEKLY CHART
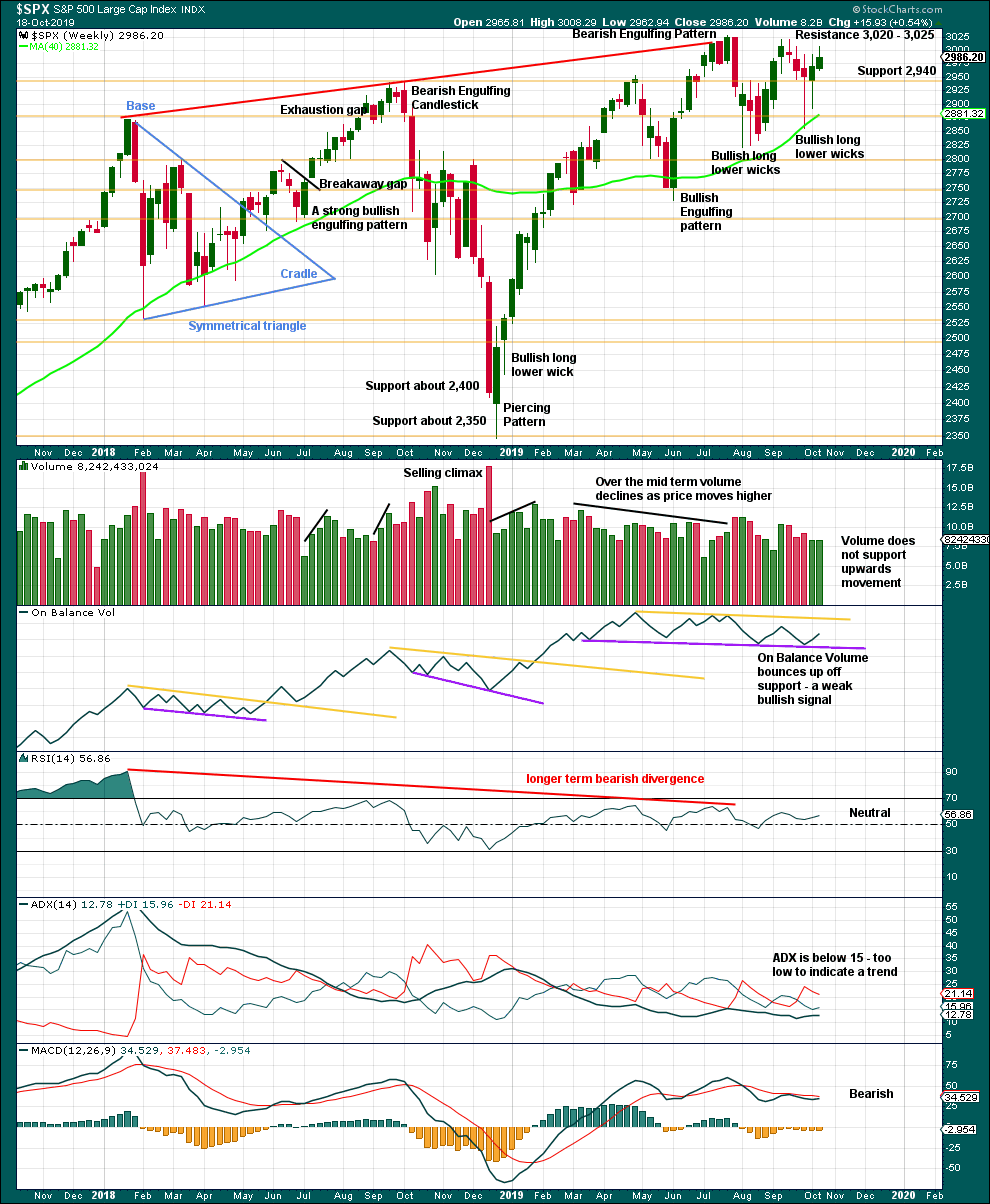
Click chart to enlarge. Chart courtesy of StockCharts.com.
A decline in volume with upwards movement is not of a concern in current market conditions.
A slightly longer upper wick last week suggests a pullback may continue this week. Look for support about 2,940.
There is still a series of higher highs (with the exception of the last high) and higher lows from the low in December 2018. This is the basic definition of an upwards trend. For that view to shift then a lower low below 2,822.12 would need to be seen.
DAILY CHART
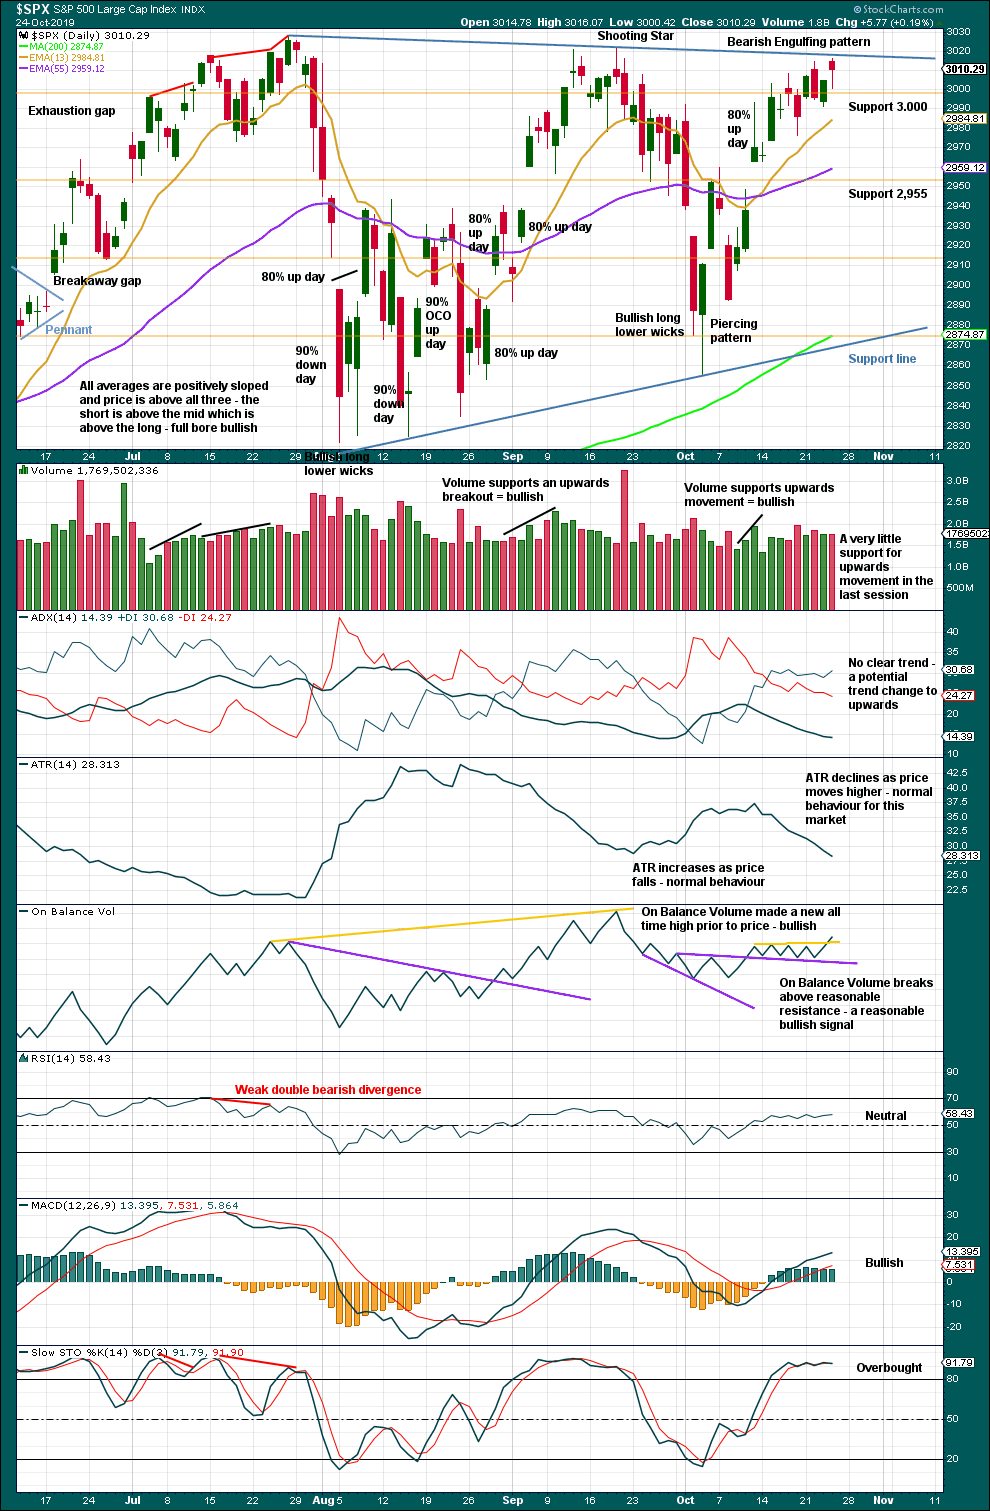
Click chart to enlarge. Chart courtesy of StockCharts.com.
There is now a series of higher highs and higher lows since the 5th of August. Strength in 90% up days and back to back 80% up days off lows indicate the lows may still be sustainable.
The bullish signal from On Balance Volume is reasonable because the resistance line is clearly breached, had four prior tests and was horizontal. This supports the main hourly Elliott wave count.
Today completes an upwards session with a higher high and a higher low although the candlestick has closed red. The long lower wick is bullish, but it may be considered a Hanging Man reversal pattern if tomorrow completes a downwards session. The bullish implications of the long lower wick on a Hanging Man requires bearish confirmation in the following candlestick (consequently, a Hanging Man becomes a two candlestick pattern).
There is fairly strong resistance here about the upper blue trend line. If this is overcome, then energy may be released and some increase in upwards momentum may result.
BREADTH – AD LINE
WEEKLY CHART
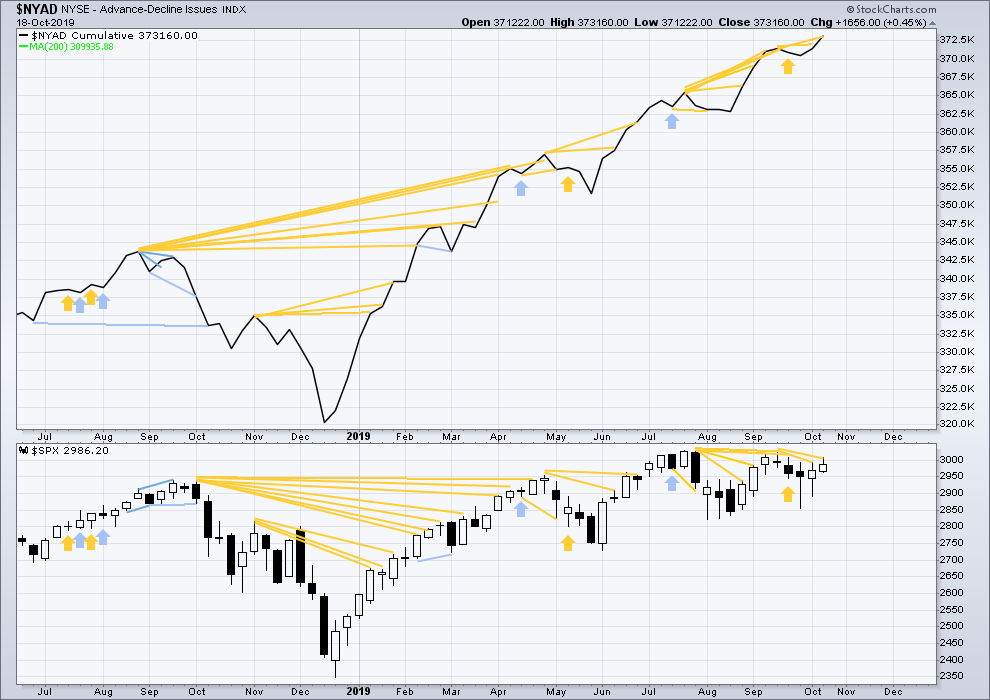
Click chart to enlarge. Chart courtesy of StockCharts.com. So that colour blind members are included, bearish signals
will be noted with blue and bullish signals with yellow.
Bear markets from the Great Depression and onwards have been preceded by an average minimum of 4 months divergence between price and the AD line with only two exceptions in 1946 and 1976. With the AD line making new all time highs again this week, the end of this bull market and the start of a new bear market is very likely a minimum of 4 months away, which is mid February 2020.
In all bear markets in the last 90 years there is some positive correlation (0.6022) between the length of bearish divergence and the depth of the following bear market. No to little divergence is correlated with more shallow bear markets. Longer divergence is correlated with deeper bear markets.
If a bear market does develop here, it comes after no bearish divergence. It would therefore more likely be shallow.
Small caps have made a new swing high above the prior high of the end of July, but mid and large caps have not yet done so. The last upwards movement appears to be led by small caps. Because small caps are usually the first to exhibit deterioration in the later stages of a bull market, some strength in small caps at this stage indicates a healthy bull market with further to run.
Last week the AD line makes another new all time high. This divergence is bullish and strongly supports the main Elliott wave count.
DAILY CHART
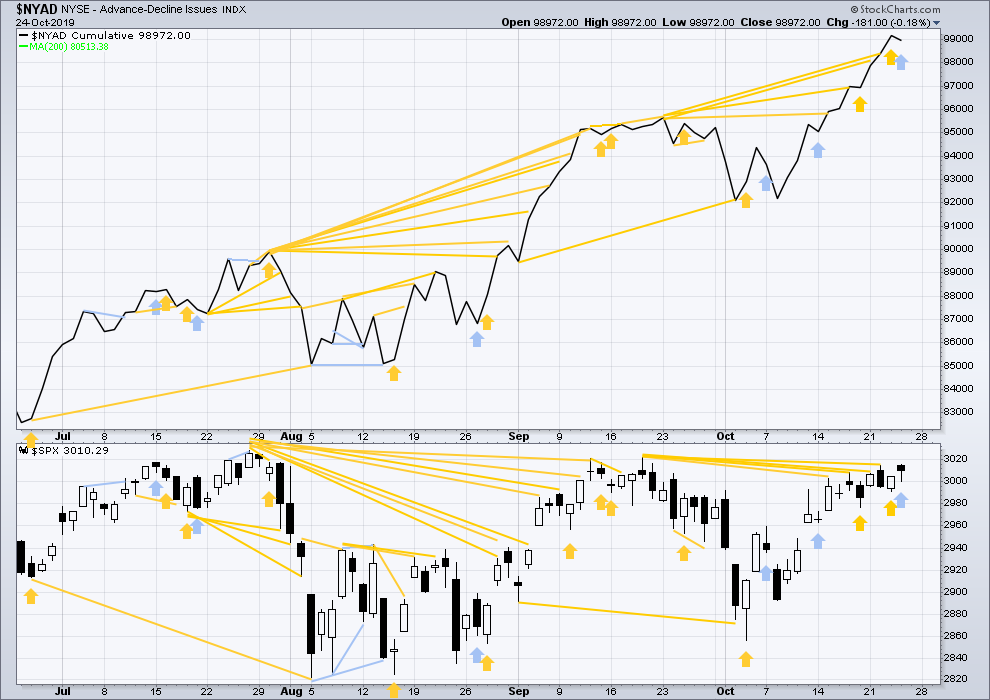
Click chart to enlarge. Chart courtesy of StockCharts.com. So that colour blind members are included, bearish signals
will be noted with blue and bullish signals with yellow.
Breadth should be read as a leading indicator.
The AD line makes yet another new all time high today. This divergence is bullish and strong. It is given reasonable weight in this analysis.
Bullish divergence noted in yesterday’s analysis has now been followed by an upwards day.
Today price has moved higher with a higher high and a higher low, but the AD line has moved lower. This divergence is bearish for the short term.
VOLATILITY – INVERTED VIX CHART
WEEKLY CHART
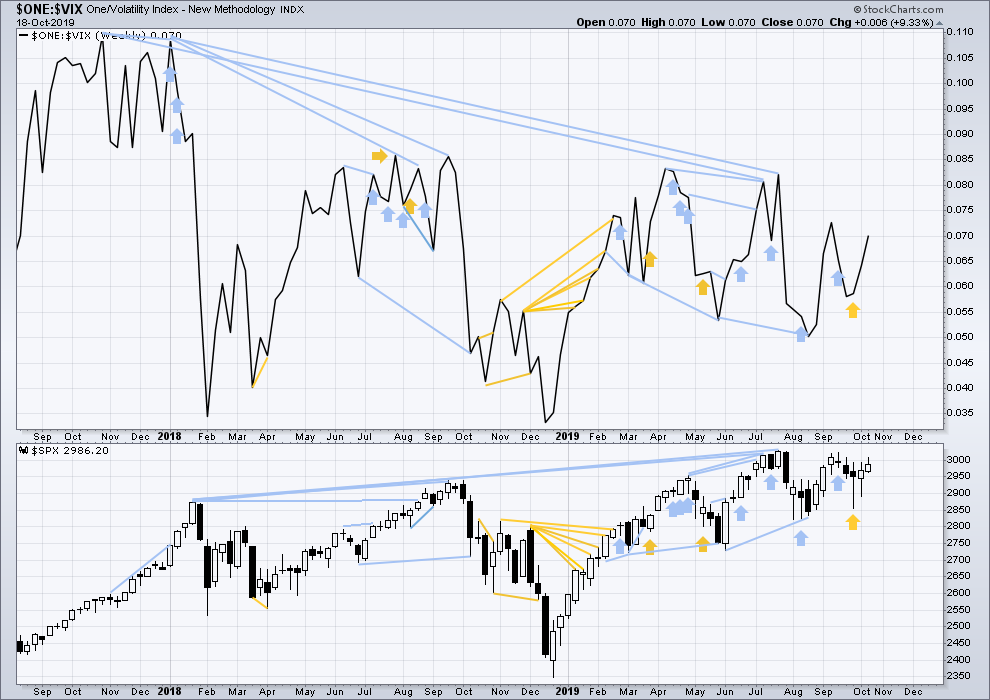
Click chart to enlarge. Chart courtesy of StockCharts.com. So that colour blind members are included, bearish signals
will be noted with blue and bullish signals with yellow.
The all time high for inverted VIX (which is the same as the low for VIX) was on 30th October 2017. There is now almost two years of bearish divergence between price and inverted VIX.
The rise in price is not coming with a normal corresponding decline in VIX; VIX remains elevated. This long-term divergence is bearish and may yet develop further as the bull market matures.
This divergence may be an early warning, a part of the process of a top developing that may take years. It may not be useful in timing a trend change.
Last week both price and inverted VIX have moved higher. Neither have made new short-term swing highs. There is no new divergence.
DAILY CHART
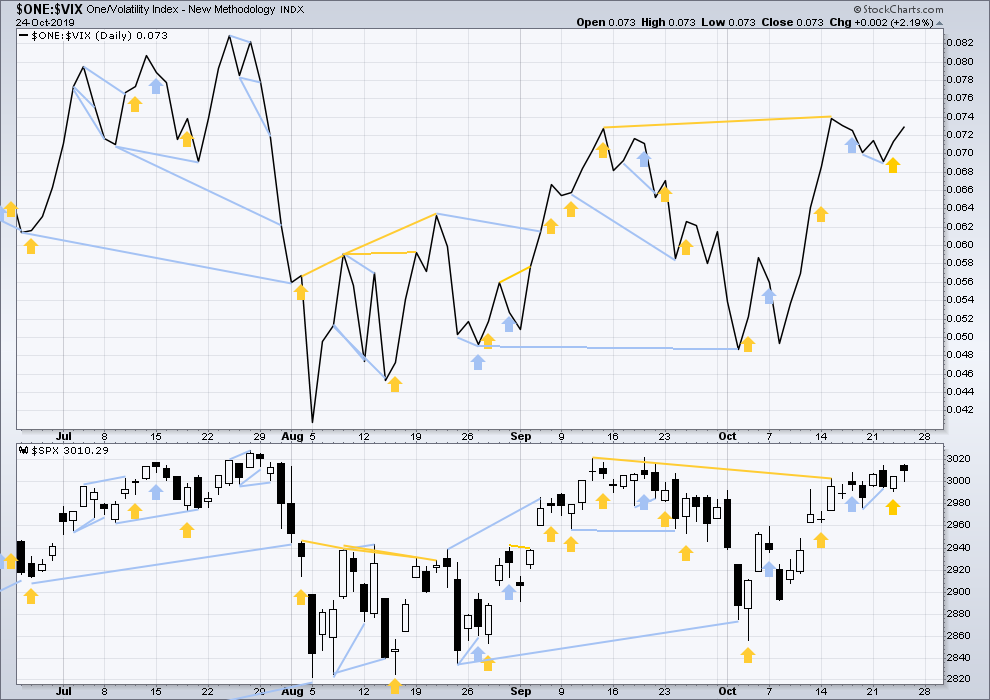
Click chart to enlarge. Chart courtesy of StockCharts.com. So that colour blind members are included, bearish signals
will be noted with blue and bullish signals with yellow.
Today price moved higher with a higher high and a higher low, and inverted VIX has moved higher. There is no divergence here to confirm divergence with the AD line today.
DOW THEORY
Dow Theory confirmed a bear market in December 2018. This does not necessarily mean a bear market at Grand Super Cycle degree though; Dow Theory makes no comment on Elliott wave counts. On the 25th of August 2015 Dow Theory also confirmed a bear market. The Elliott wave count sees that as part of cycle wave II. After Dow Theory confirmation of a bear market in August 2015, price went on to make new all time highs and the bull market continued.
DJIA: 23,344.52 – a close on the 19th of December at 23,284.97 confirms a bear market.
DJT: 9,806.79 – price has closed below this point on the 13th of December.
S&P500: 2,532.69 – a close on the 19th of December at 2,506.96 provides support to a bear market conclusion.
Nasdaq: 6,630.67 – a close on the 19th of December at 6,618.86 provides support to a bear market conclusion.
With all the indices having moved higher following a Dow Theory bear market confirmation, Dow Theory would confirm a bull market if the following highs are made:
DJIA: 26,951.81 – a close above this point has been made on the 3rd of July 2019.
DJT: 11,623.58 – to date DJT has failed to confirm an ongoing bull market.
S&P500: 2,940.91 – a close above this point was made on the 29th of April 2019.
Nasdaq: 8,133.30 – a close above this point was made on the 26th of April 2019.
Published @ 08:48 p.m. EST.
—
Careful risk management protects your trading account(s).
Follow my two Golden Rules:
1. Always trade with stops.
2. Risk only 1-5% of equity on any one trade.
—
New updates to this analysis are in bold.
Hourly chart updated:
No change. As expected price is going higher…. so far.
I have the ATH at 3,027.98 on 26th July, and the high today at 3,027.39.
So if this data from Barchart is accurate, no new ATH today.
What data can you see a new ATH on Rodney?
I would trust yours. Mine is delayed and on 5 minute charts it can change for a bit.
Stockcharts have the same, so yeah, I think we’ll go with that.
So so close to a new ATH on Friday, just 0.59 points short!
I think we shall see a new ATH on Monday.
Bitcoin exploding today to the upside. A pivot on top of the 61.8% retrace of the Feb – Jun 19 low to high swing. I doubled my very small position in GBTC earlier and am now in the black. Looking for current price of 10.34 to go to about 12.
That’s a huge bullish engulfing candlestick on Bitcoin. I think the low is in.
Ding Ding Ding Ding!
As expected per Lara’s analysis for some time, we have a new intraday ATH in SPX. I suspect we will also see a new closing ATH today. Who would have thunk? Lara did. Thanks Lara.
Remember I previously said, when it breaks out and up, it may not even look back. Next week will tell.
SPX daily trend back to strong up.
What will seal the deal for me here is a full candle all above the upper Darvas box line (the triple top level).
Yea mon, we might see a hella push over the next several months if we can get a sidelines money rush into this market, supported by loose money policies. Party time! (Some day the party will be over…but who’s worrying about that?).
I have a large truck of longs at this point, almost all in sold bull put spreads. Let ‘er rip!
At current SPX of 3019, we have broken out of triangle on hourly chart and above the blue trend line shown on the TA daily chart. Very bullish if it can close above this trend line.
agree, got out of shorts before market for a few pennies, and am long SPY and RTY
It also seems that we have a bullish crossover on the SPX weekly MACD and this is from above the zero line. If it holds, it is another very bullish piece of evidence supporting the Main Count.
This is interesting. He is speaking about last Friday.
—————————————————————————-
SentimenTrader@sentimentrader
Oct 18
Friday saw the highest equity put volume since August 2011.
As a % of NYSE volume, it was the highest since February 2009.
—————————————————————————-
This is a contrarian indicator as an extreme level of puts means an extreme level of bearishness. The herd is wrong. Right?
I’m loving my SPY butterfly I put on a day ago, for today’s expiry.
Here’s the awesome thing about putting on a very short term butterfly right on top of the current price action of a major average that is relatively stagnant re: price action with only a day or two or three to expiry. IMMEDIATELY you are building a little “bubble” of profit in your profit curve. At minutes and hours go by, the bubble (profit) rises. Now you are in the situation of easily managing to a virtually guaranteed (!!) no loss trade. If/when price slides out to the break even price of the ‘fly, you exit at break even. Yes, you may get head faked out. But think about it; how many trades can you structure where you have such crazy +EV? Of course, you can suffer a new day big gap right out of the profit price zone. But if we are talking major averages, BIG gaps are far less likely.
A tactic for some of you to consider. I will be looking to deploy it a lot! SPY gives an opportunity for it “always”, Mon/Wed/Fri options!
I had an AMZN bull put spread, well under market, very nicely in profit, expiring mid Nov. Well. nicely profitable until this morning’s open after earnings. Opened down a few hundred $’s. But still on the profitable side of price re: my profit curve at expiry. So I said “hold and see”. Price came up a little bit, and the position was showing $80 profit. I closed it. Why? Risk reduction. AMZN is now showing yet another down trend week with a strongly down weekly bar, the daily was at neutral and looking to go to “up” but now it’s gaped down and is back to a down trend. I don’t know where this thing is going…so “any landing you can walk away from is a good landing” and I took my $80 and called it a successful trade. I will get a new position in AMZN soon…after I see price stabilize and I have a real sense for where it’s headed again.
Blow wind, swell billow, and swim bark!
The sea is up, and all is on the hazard.
Oh look an empty left!!!
Hey, that is me on top of the wave just to the left of the surfer coming down the wave. You see, being an EW enthusiast, I like to stay on top of the waves!
I’m a goofy footer, so that looks really good to me. Probably a bit big for my abilities though…..
I’d be terrified to even have my toe in the water. This is of course Mavericks, about 20 miles south of SF proper. Today it’s not 20′ though, it’s 2′.
Yeah, I’d probably die in that.
I want to live.