
The Elliott wave count is unchanged.
Summary: For the very short term, a little downwards movement to about 2,955 or 2,931 may complete tomorrow. Thereafter, the upwards trend may resume. The next target is at 3,120.
Further confidence that a low is in place and price should make new all time highs very soon would come if either a 90% up day or two back to back 80% up days is seen.
A new low below 2,822.12 would add confidence to an alternate. Expect price at that stage to keep falling to 2,578 – 2,476 to find support at the lower edge of the large teal channel on weekly and daily charts.
The biggest picture, Grand Super Cycle analysis, is here.
Monthly charts were last published here, with video here. There are two further alternate monthly charts here, with video here.
ELLIOTT WAVE COUNTS
The two weekly Elliott wave counts below will be labelled First and Second. They may be about of even probability. When the fifth wave currently unfolding on weekly charts may be complete, then these two wave counts will diverge on the severity of the expected following bear market. To see an illustration of this future divergence monthly charts should be viewed.
FIRST WAVE COUNT
MAIN WEEKLY CHART
Click chart to enlarge.
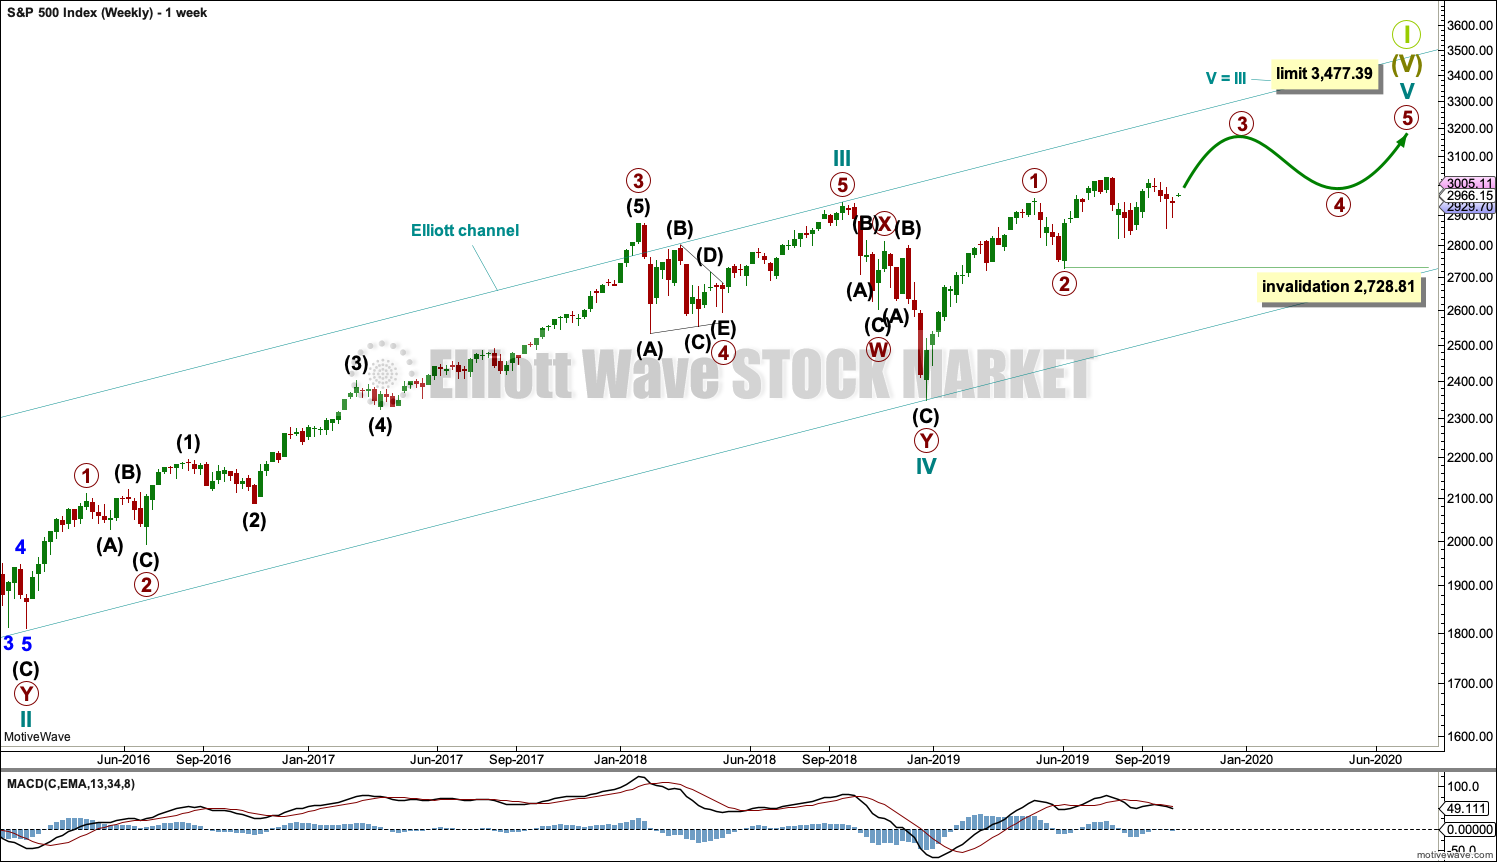
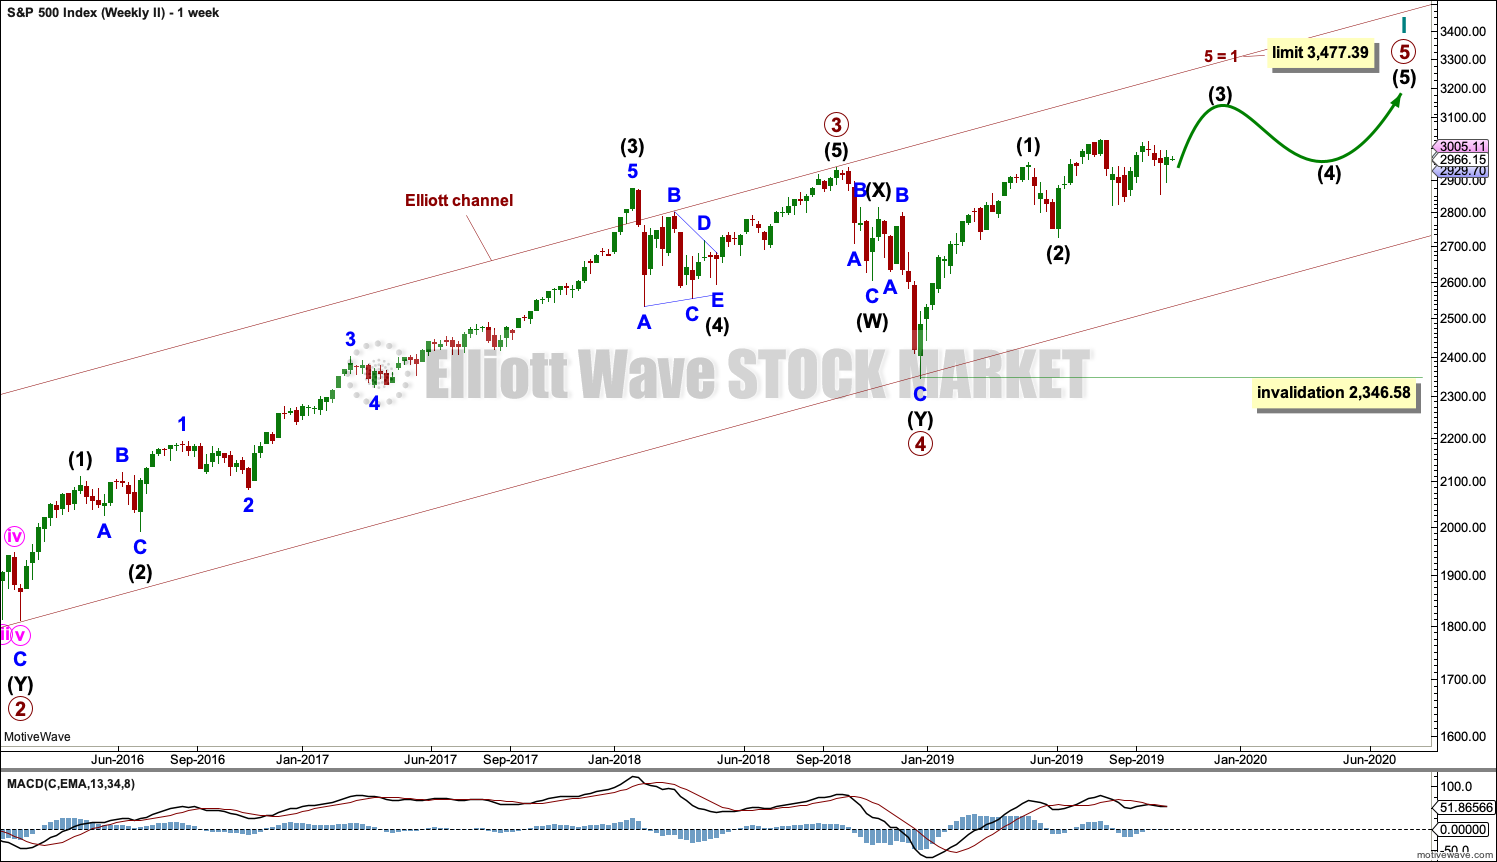
The basic Elliott wave structure consists of a five wave structure up followed by a three wave structure down (for a bull market). This wave count sees the bull market beginning in March 2009 as an incomplete five wave impulse and now within the last fifth wave, which is labelled cycle wave V. This impulse is best viewed on monthly charts. The weekly chart focusses on the end of it.
Elliott wave is fractal. This fifth wave labelled cycle wave V may end a larger fifth wave labelled Super Cycle wave (V), which may end a larger first wave labelled Grand Super Cycle wave I.
The teal Elliott channel is drawn using Elliott’s first technique about the impulse of Super Cycle wave (V). Draw the first trend line from the end of cycle wave I (off to the left of the chart, the weekly candlestick beginning 30th November 2014) to the end of cycle wave III, then place a parallel copy on the end of cycle wave II. This channel perfectly shows where cycle wave IV ended at support. The strongest portion of cycle wave III, the end of primary wave 3, overshoots the upper edge of the channel. This is a typical look for a third wave and suggests the channel is drawn correctly and the way the impulse is counted is correct.
Within Super Cycle wave (V), cycle wave III is shorter than cycle wave I. A core Elliott wave rule states that a third wave may never be the shortest. For this rule to be met in this instance, cycle wave V may not be longer in length than cycle wave III. This limit is at 3,477.39.
Cycle wave V may subdivide either as an impulse or an ending diagonal. Impulses are much more common. This main wave count expects that cycle wave V may be unfolding as an impulse.
The daily chart below will focus on movement from the end of primary wave 2.
In historic analysis, two further monthly charts have been published that do not have a limit to upwards movement and are more bullish than this wave count. Members are encouraged to consider those possibilities (links below summary) alongside the wave counts presented on a daily and weekly basis.
Within cycle wave V, primary waves 1 and 2 may be complete. Within primary wave 3, no second wave correction may move beyond its start below 2,728.81.
MAIN DAILY CHART
Click chart to enlarge.
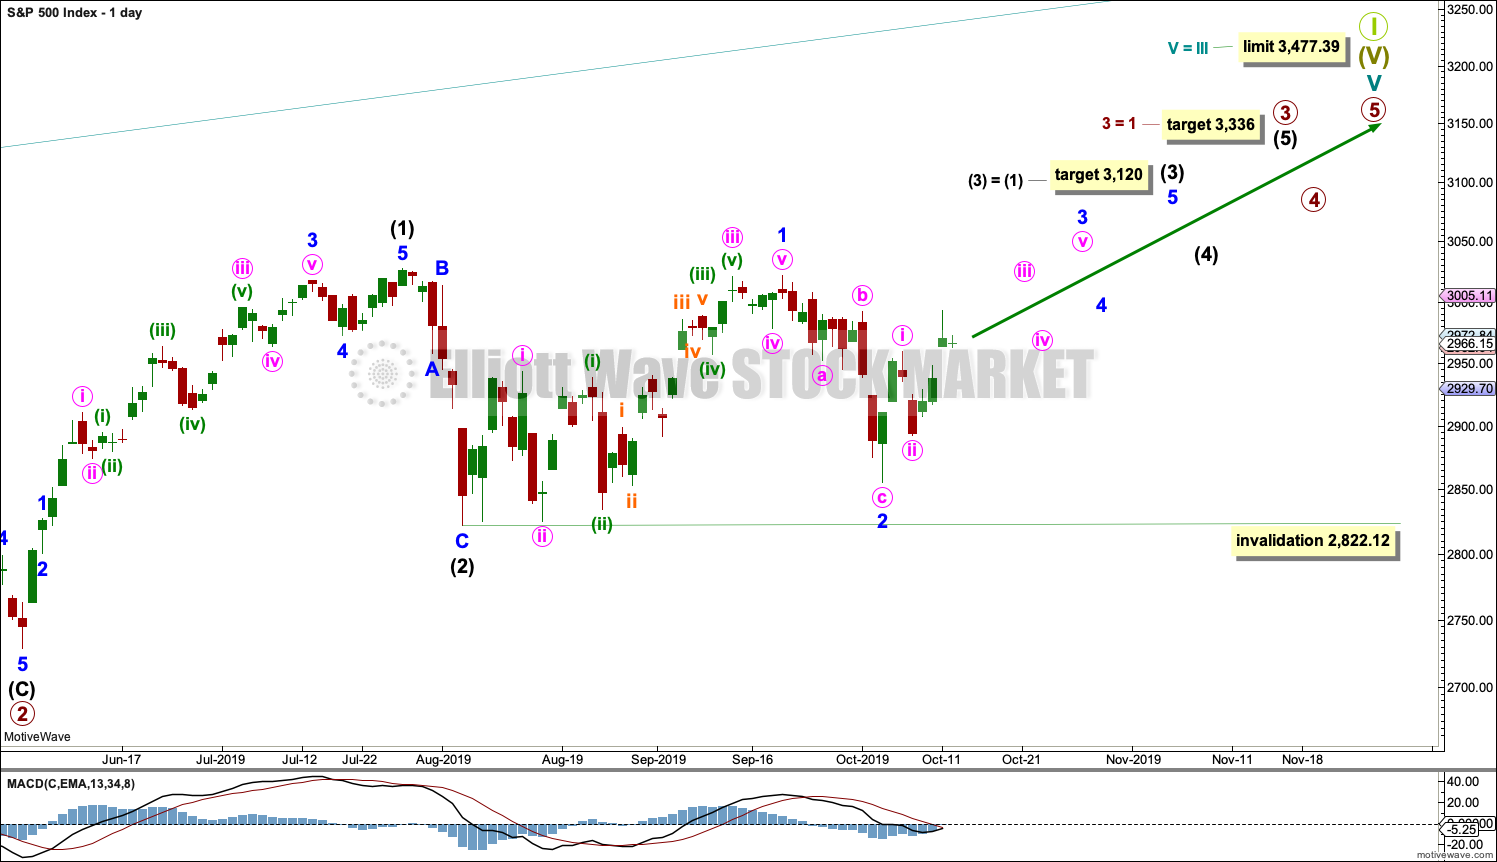
Primary wave 3 may have begun.
All of primary wave 3, intermediate wave (3) and minor wave 3 may only subdivide as impulses. Within each impulse, its second wave correction may not move beyond the start of its first wave.
Minor wave 2 may not move beyond the start of minor wave 1 below 2,822.12.
Intermediate wave (3) must move far enough above the end of intermediate wave (1) to then allow intermediate wave (4) to unfold and remain above intermediate wave (1) price territory.
HOURLY CHART
Click chart to enlarge.
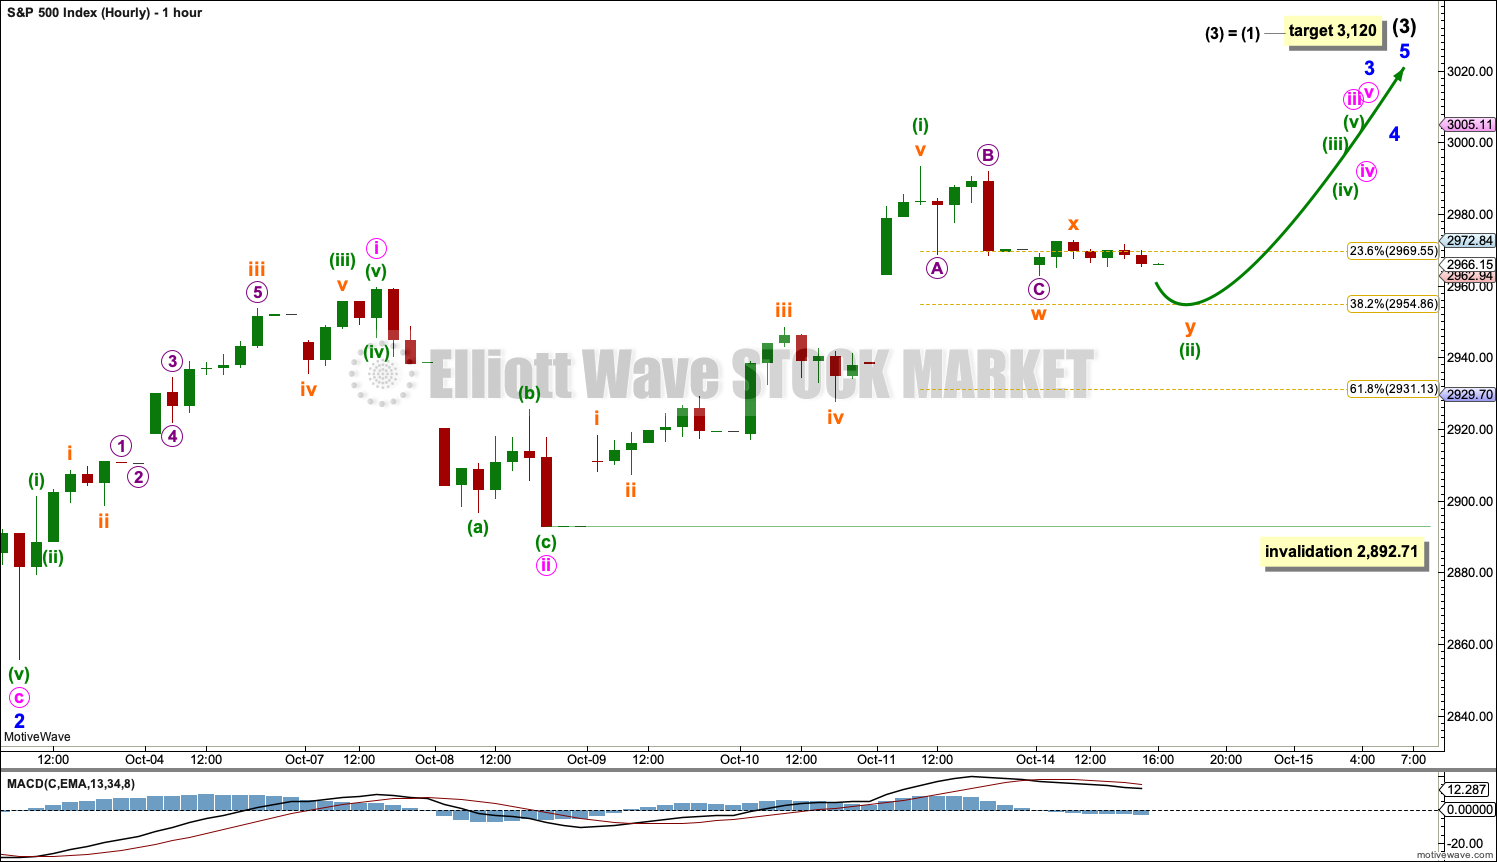
Minor wave 2 should be over.
Minor wave 3 may only subdivide as an impulse. Minute wave ii may have been over, and minute wave iii upward may have begun.
Within minute wave iii, minuette wave (ii) may not move beyond the start of minuette wave (i) below 2,892.71.
Minuette wave (ii) may end about either the 0.382 or 0.618 Fibonacci Ratios. The strong upwards pull now of a third wave at five degrees may force minuette wave (ii) to be more shallow than usual.
ALTERNATE WEEKLY CHART
Click chart to enlarge.
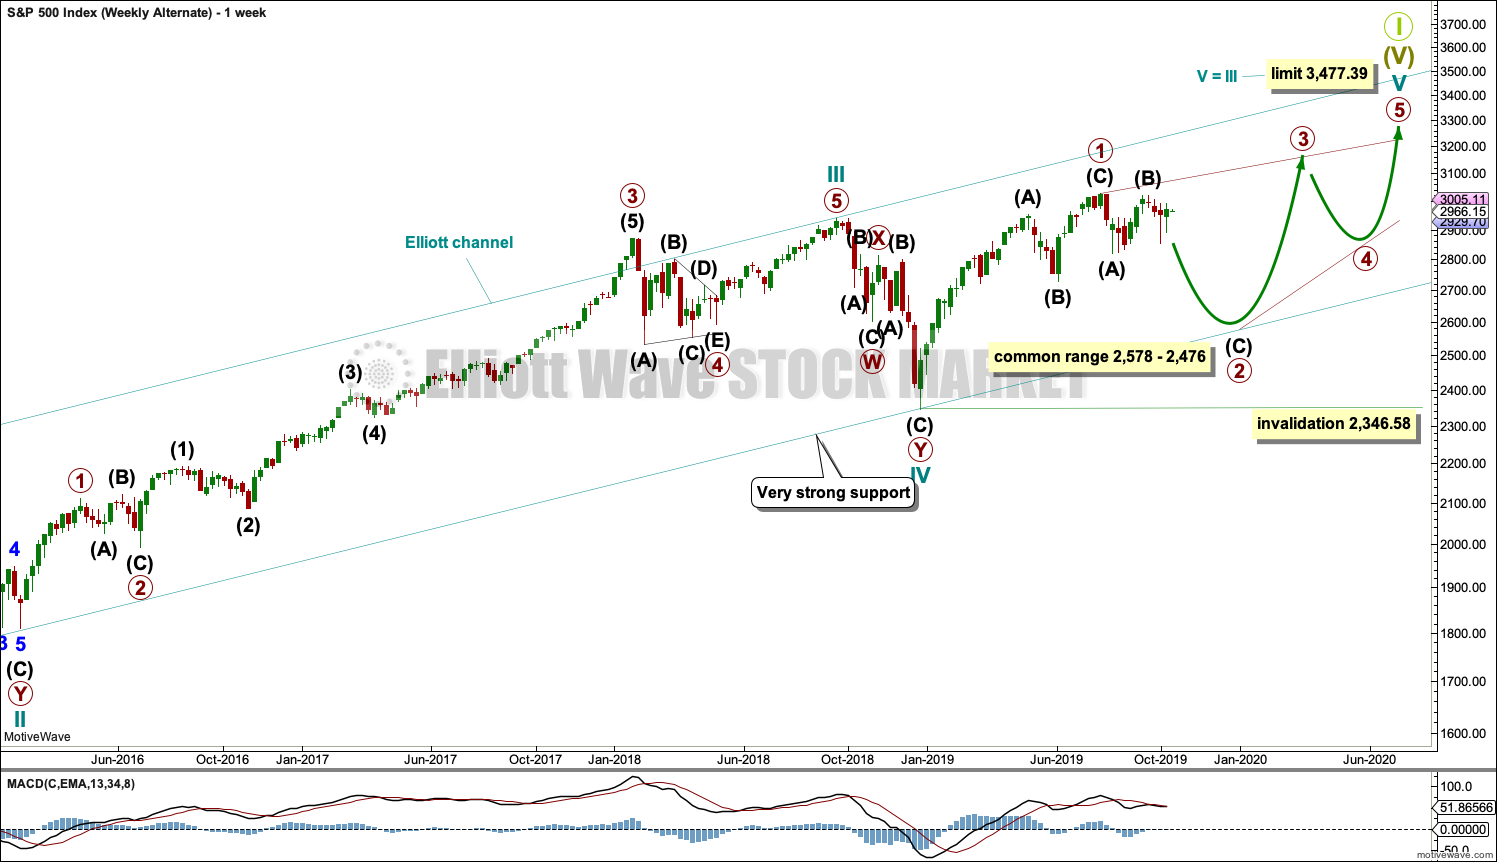
Cycle wave V may be subdividing as an ending diagonal. Within ending diagonals, all sub-waves must subdivide as zigzags. Primary wave 1 may be over at the last all time high as a zigzag.
Primary wave 2 must complete lower as a zigzag.
The second and fourth waves within diagonals are usually very deep, commonly between 0.81 to 0.66 the depth of the prior wave. This gives a target zone for primary wave 2.
Primary wave 2 may end if it comes down to find support at the lower edge of the teal channel, which is copied over from monthly and weekly charts. This trend line should provide final support for a deeper pullback.
Primary wave 2 may not move beyond the start of primary wave 1 below 2,346.58.
SECOND WAVE COUNT
WEEKLY CHART
Click chart to enlarge.
This weekly chart is almost identical to the first weekly chart, with the sole exception being the degree of labelling.
This weekly chart moves the degree of labelling for the impulse beginning in March 2009 all down one degree. This difference is best viewed on monthly charts.
The impulse is still viewed as nearing an end; a fifth wave is still seen as needing to complete higher. This wave count labels it primary wave 5.
Primary wave 5 may be subdividing as either an impulse or ending diagonal, in the same way that cycle wave V is seen for the first weekly chart.
TECHNICAL ANALYSIS
WEEKLY CHART
Click chart to enlarge. Chart courtesy of StockCharts.com.
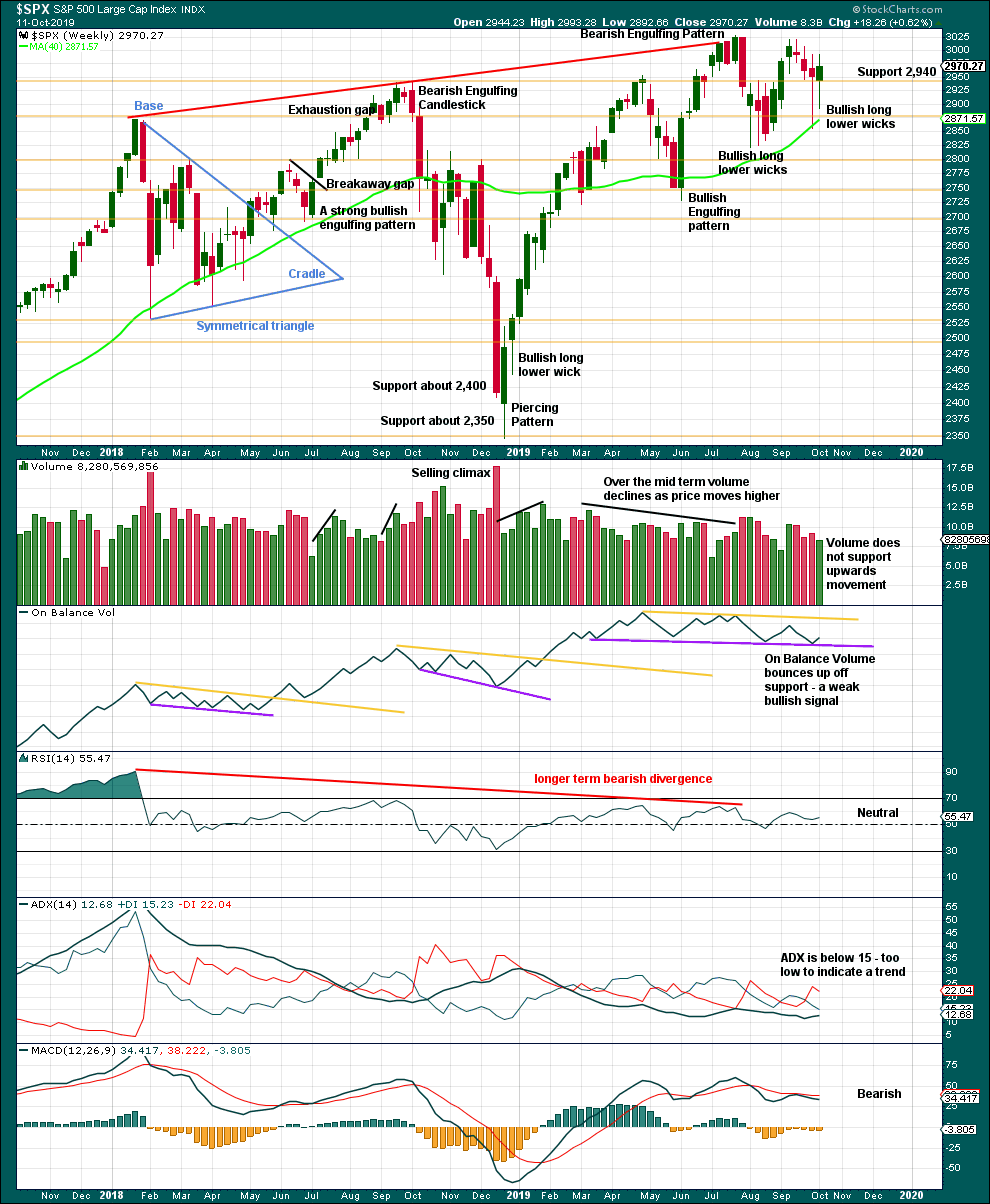
Two long lower wicks now suggest more upwards movement ahead. A decline in volume with upwards movement is not of a concern in current market conditions.
DAILY CHART
Click chart to enlarge. Chart courtesy of StockCharts.com.
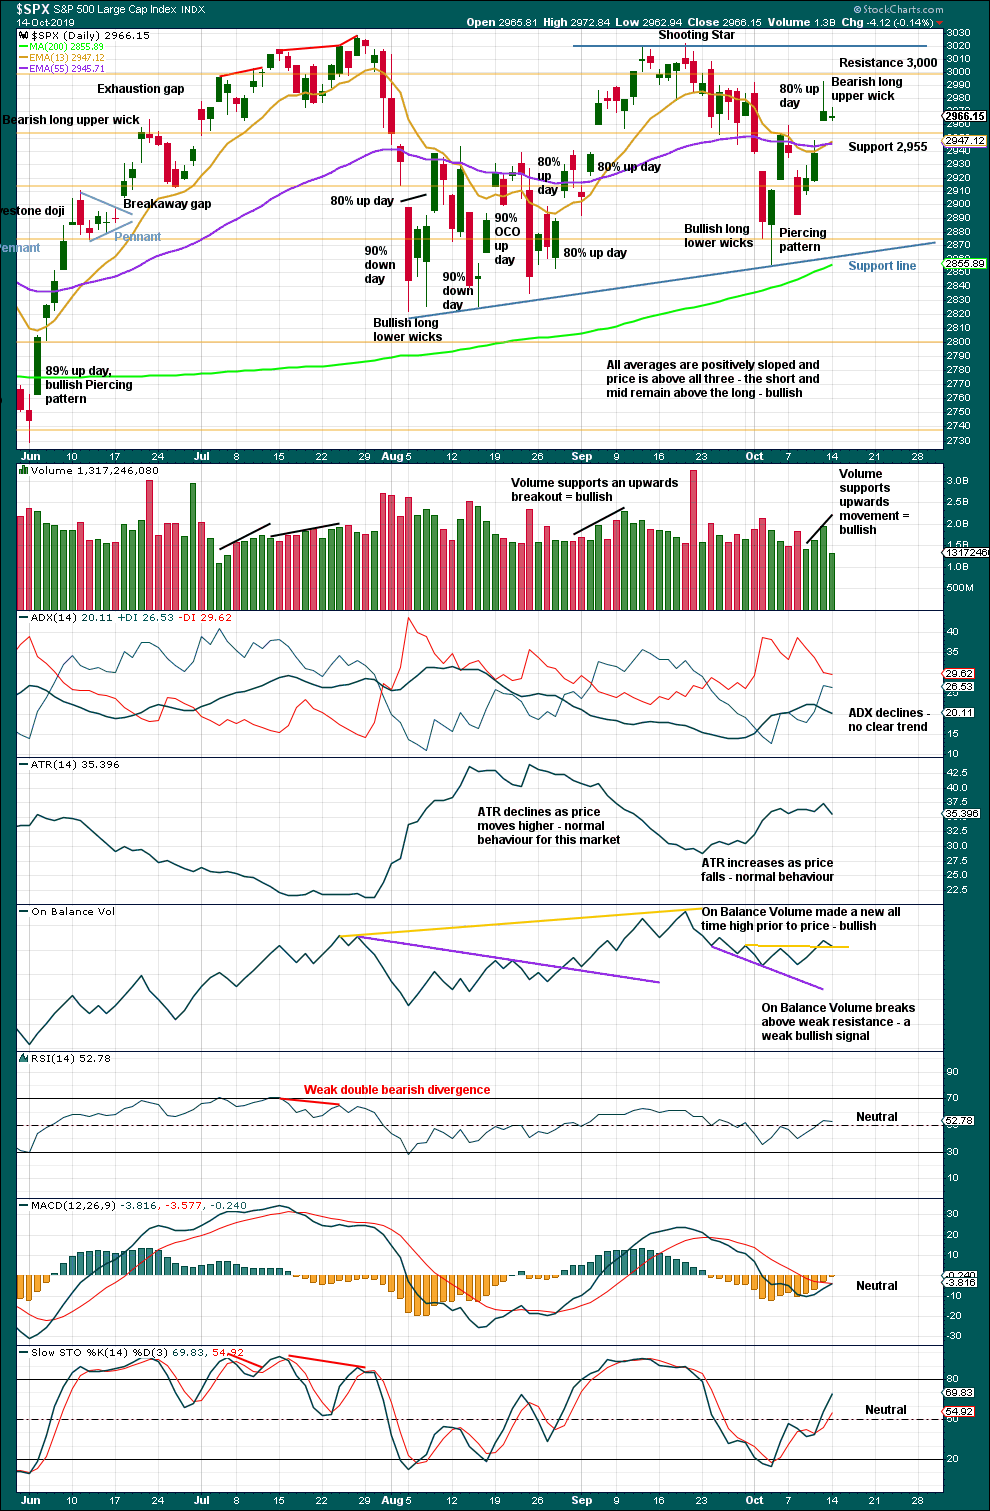
There is now a series of higher highs and higher lows since the 5th of August. Strength in 90% up days and back to back 80% up days off lows indicate the lows may still be sustainable.
Friday was an 80% upwards day. Within the session for Monday, downwards volume has dominated. There is now no two 80% up days back to back.
BREADTH – AD LINE
WEEKLY CHART
Click chart to enlarge. Chart courtesy of StockCharts.com. So that colour blind members are included, bearish signals
will be noted with blue and bullish signals with yellow.
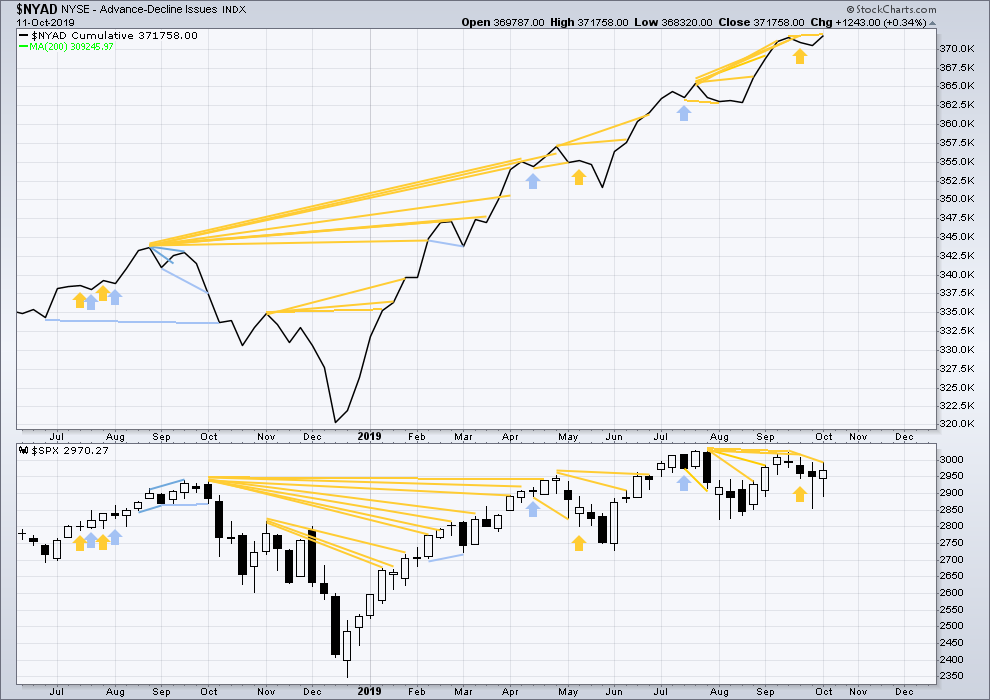
Bear markets from the Great Depression and onwards have been preceded by an average minimum of 4 months divergence between price and the AD line with only two exceptions in 1946 and 1976. With the AD line making new all time highs again this week, the end of this bull market and the start of a new bear market is very likely a minimum of 4 months away, which is mid February 2020.
In all bear markets in the last 90 years there is some positive correlation (0.6022) between the length of bearish divergence and the depth of the following bear market. No to little divergence is correlated with more shallow bear markets. Longer divergence is correlated with deeper bear markets.
If a bear market does develop here, it comes after no bearish divergence. It would therefore more likely be shallow.
Small caps have made a new swing high above the prior high of the end of July, but mid and large caps have not yet done so. The last upwards movement appears to be led by small caps. Because small caps are usually the first to exhibit deterioration in the later stages of a bull market, some strength in small caps at this stage indicates a healthy bull market with further to run.
Last week the AD line makes another new all time high. This divergence is bullish and strongly supports the main Elliott wave count.
DAILY CHART
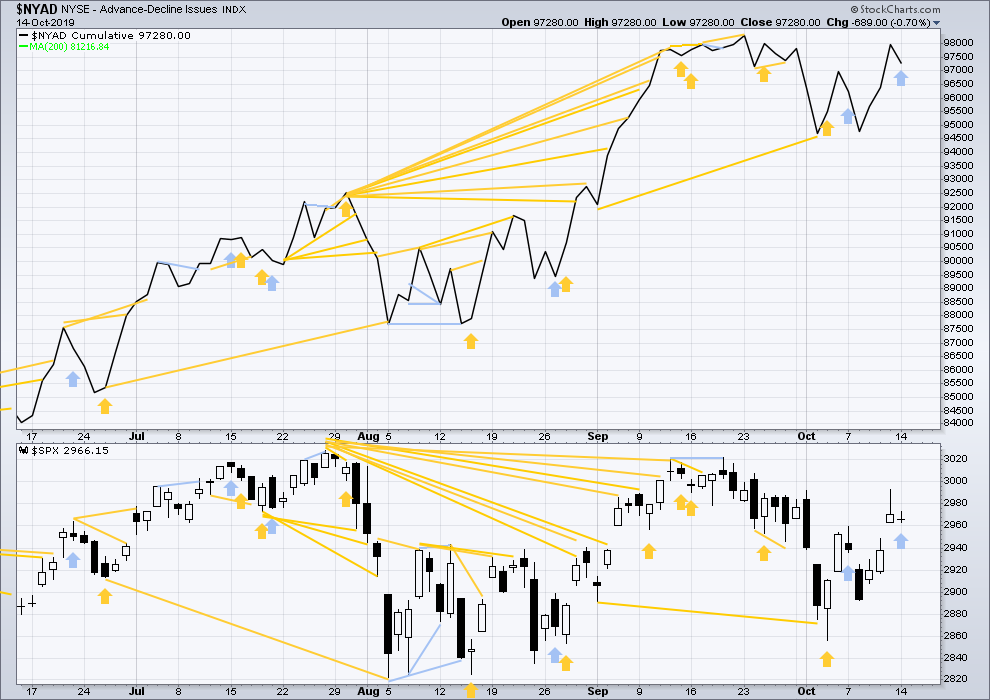
Click chart to enlarge. Chart courtesy of StockCharts.com. So that colour blind members are included, bearish signals
will be noted with blue and bullish signals with yellow.
Breadth should be read as a leading indicator.
Monday has closed green with a balance of volume downwards. A decline in breadth for a green daily candlestick is bearish divergence, but this is very slight as downwards movement was so small.
VOLATILITY – INVERTED VIX CHART
WEEKLY CHART
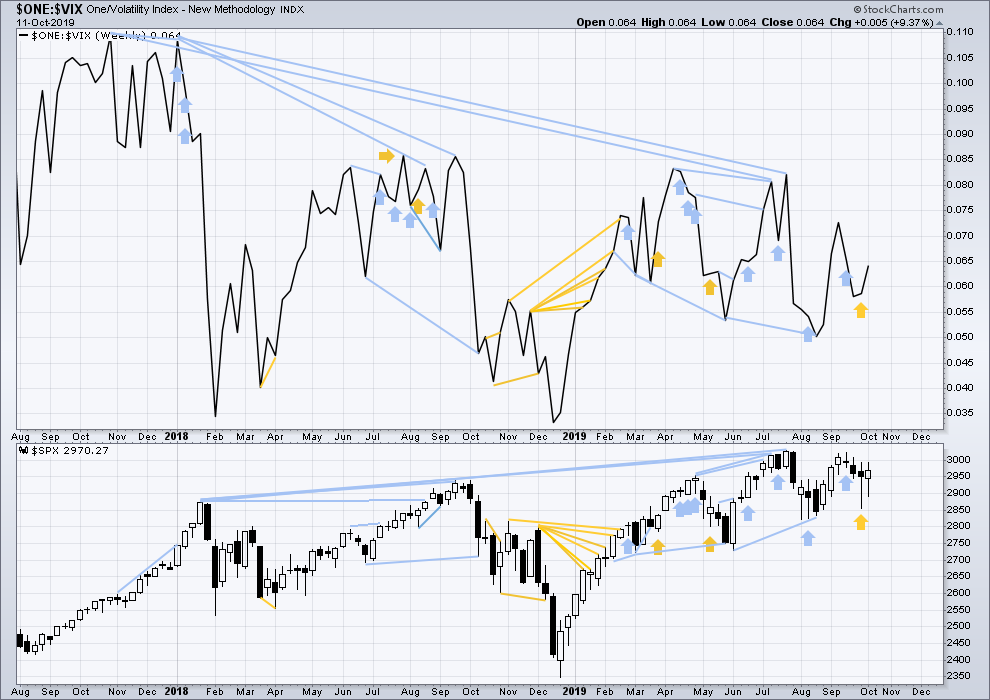
Click chart to enlarge. Chart courtesy of StockCharts.com. So that colour blind members are included, bearish signals
will be noted with blue and bullish signals with yellow.
The all time high for inverted VIX (which is the same as the low for VIX) was on 30th October 2017. There is now nearly two years of bearish divergence between price and inverted VIX.
The rise in price is not coming with a normal corresponding decline in VIX; VIX remains elevated. This long-term divergence is bearish and may yet develop further as the bull market matures.
This divergence may be an early warning, a part of the process of a top developing that may take years. It may not be useful in timing a trend change.
Last week both price and inverted VIX have moved higher. Neither have made new short-term swing highs. There is no new divergence.
DAILY CHART
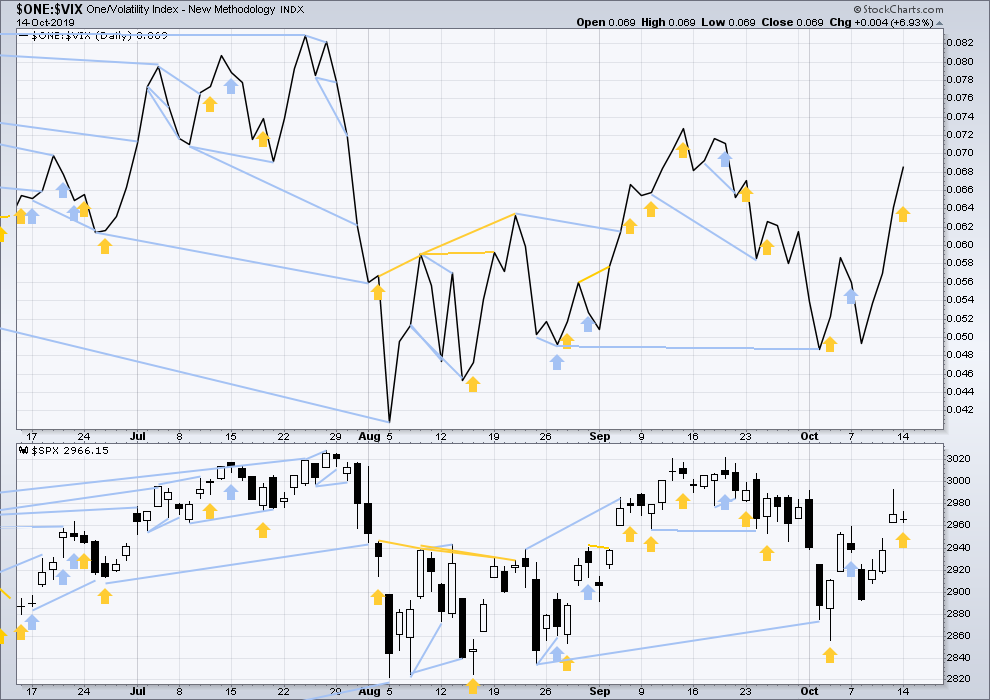
Click chart to enlarge. Chart courtesy of StockCharts.com. So that colour blind members are included, bearish signals
will be noted with blue and bullish signals with yellow.
Monday was an inside day that did not make a new high above the prior session, but inverted VIX has moved strongly higher. Downwards movement, which dominated within Monday’s session, has not come with a normal increase decline in VIX; VIX has declined strongly. This divergence is bullish for the short term.
DOW THEORY
Dow Theory confirmed a bear market in December 2018. This does not necessarily mean a bear market at Grand Super Cycle degree though; Dow Theory makes no comment on Elliott wave counts. On the 25th of August 2015 Dow Theory also confirmed a bear market. The Elliott wave count sees that as part of cycle wave II. After Dow Theory confirmation of a bear market in August 2015, price went on to make new all time highs and the bull market continued.
DJIA: 23,344.52 – a close on the 19th of December at 23,284.97 confirms a bear market.
DJT: 9,806.79 – price has closed below this point on the 13th of December.
S&P500: 2,532.69 – a close on the 19th of December at 2,506.96 provides support to a bear market conclusion.
Nasdaq: 6,630.67 – a close on the 19th of December at 6,618.86 provides support to a bear market conclusion.
With all the indices having moved higher following a Dow Theory bear market confirmation, Dow Theory would confirm a bull market if the following highs are made:
DJIA: 26,951.81 – a close above this point has been made on the 3rd of July 2019.
DJT: 11,623.58 – to date DJT has failed to confirm an ongoing bull market.
S&P500: 2,940.91 – a close above this point was made on the 29th of April 2019.
Nasdaq: 8,133.30 – a close above this point was made on the 26th of April 2019.
Published @ 07:11 p.m. EST.
—
Careful risk management protects your trading account(s).
Follow my two Golden Rules:
1. Always trade with stops.
2. Risk only 1-5% of equity on any one trade.
—
New updates to this analysis are in bold.
minuette (ii) must have been over as a brief shallow zigzag
if this count is right then now we should be expecting an increase in momentum just ahead
Thanks for the earlier than usual update. Much appreciated.
On the SPX, the price action since the low of October 8 seems to me constant with a single impulse wave. I see today as the 5 of that impulse, with one last up before finishing.
After it’s done, I’m waiting for a 3 wave correction to within the gap of October 10, maybe low 2950s, before a wave 3 up (which would clear ATH).
Looks like the 3rd wave breakout to new ATH’s is underway. We have a bullish MACD cross over on the SPX daily chart. In addition, the McClellan Oscillator is confirming this move up. $NYMO currently at +20. A close here is very bullish.
Lets see if it continues to climb slowly higher throughout the day. I will be taking at least a partial long position today, perhaps a full position. SPX 3000-3025 is still resistance. But that may not stand for long.
Amen
I believe the 3024 area is very likely to be a significant pivot for a longer consolidation. 1.618 extension of the prior upswing, and the price of the double top structure from a while back. And a high quality fit to the Fibonacci structure overlaid on this move so far (the others are shown as blue dashed lines here).
Today is the first day of initiation of QE4, not to be called QE!
“In no sense is this QE, this is nothing like it.”
“…not QE, did I mention that?”
— FED Chairman Powell 🙂
So please folks, don’t call this new round of asset purchases QE, even though by the end of it, it will likely surpass QE2 in numbers! Obviously good for stocks…
One thing I am worried about to the upside, is the huge gap up on SPX from October 11th. We gapped higher today also by about 7 SPX points, but the 25 point gap below worries me…
Massive asset bubble being inflated even more. Contentious social mood growing globally. I’d be mighty surprised if this isn’t the terminal 5th wave of Lara’s first wave count. Time will tell, of course..
Meanwhile, I’m trading the charts as I see them – nicely profitably.
my thoughts exactly Curtis. Eventually, the balloon they insist on only making larger is a-gonna-blow!!! “excessive credit driving speculation all backed by land values…and then land values start to drop and the whole thing collapses”. It’s cyclic, 18 year periodicity (average: ranges 12-24 years), and 2021 or so starts year 12 of cycle. Though I think a total meltdown starting in 2028 would be wonderful symmetry.
Ok. Made it