
Some downwards movement for the short term was expected for Tuesday, which is what has happened. The short-term target was at 2,920 or 2,896. The low for the session was at 2,892.71, which was just 3.29 points below the second target.
Summary: For the very short term, this pullback may end tomorrow at 2,862. This view has support today from volume pushing price lower, a close near the low for the session, and a bearish short-term signal from the AD line.
Thereafter, the upwards trend may resume. The next target is at 3,120.
Further confidence that a low is in place and price should make new all time highs very soon would come if either a 90% up day or two back to back 80% up days is seen.
A new low below 2,822.12 would add confidence to an alternate. Expect price at that stage to keep falling to 2,578 – 2,476 to find support at the lower edge of the large teal channel on weekly and daily charts.
The biggest picture, Grand Super Cycle analysis, is here.
Monthly charts were last published here, with video here. There are two further alternate monthly charts here, with video here.
ELLIOTT WAVE COUNTS
The two weekly Elliott wave counts below will be labelled First and Second. They may be about of even probability. When the fifth wave currently unfolding on weekly charts may be complete, then these two wave counts will diverge on the severity of the expected following bear market. To see an illustration of this future divergence monthly charts should be viewed.
FIRST WAVE COUNT
MAIN WEEKLY CHART
Click chart to enlarge.
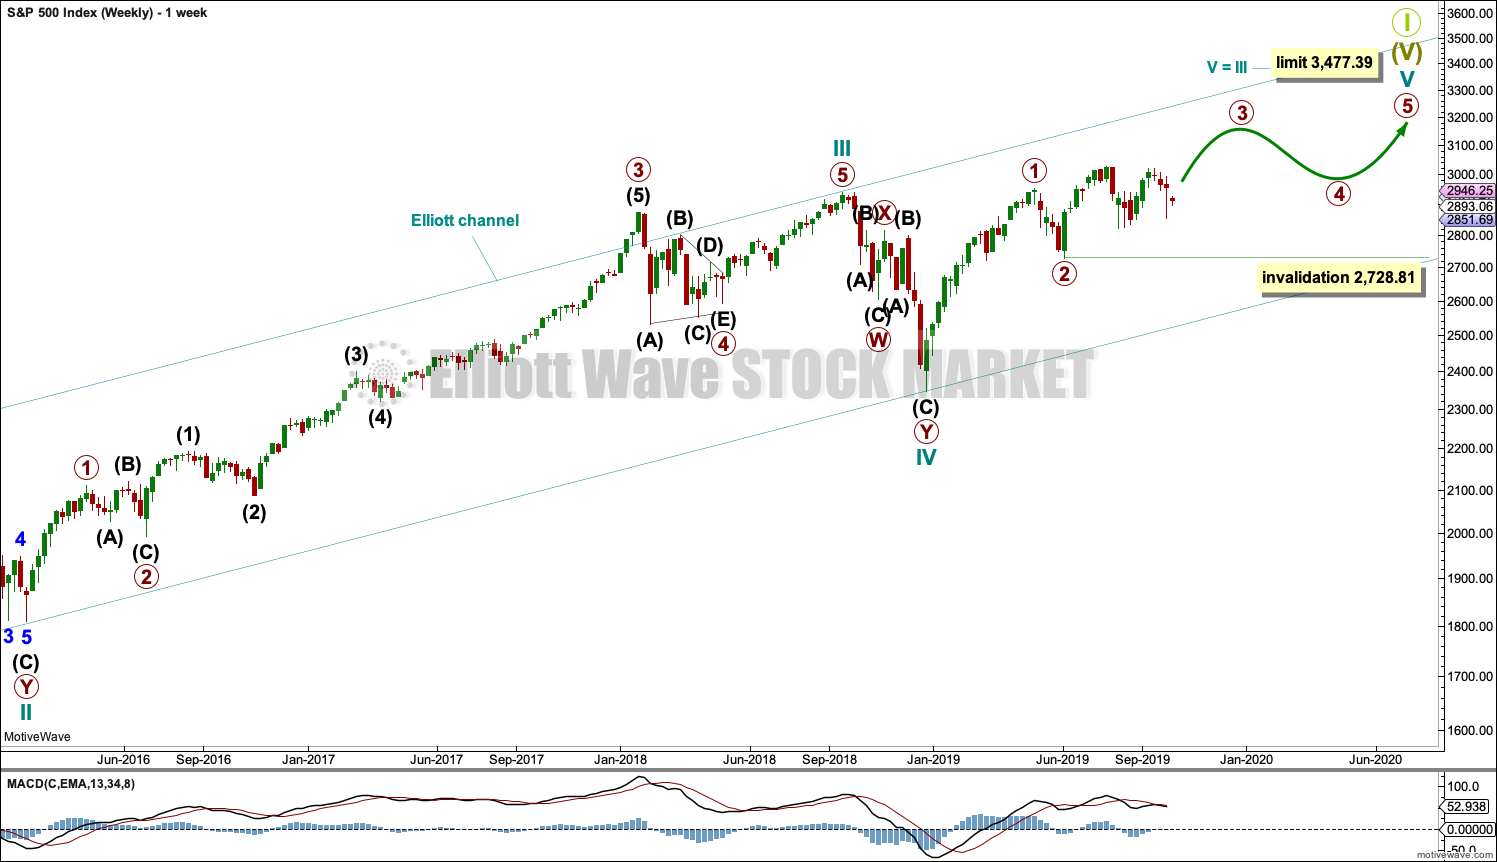
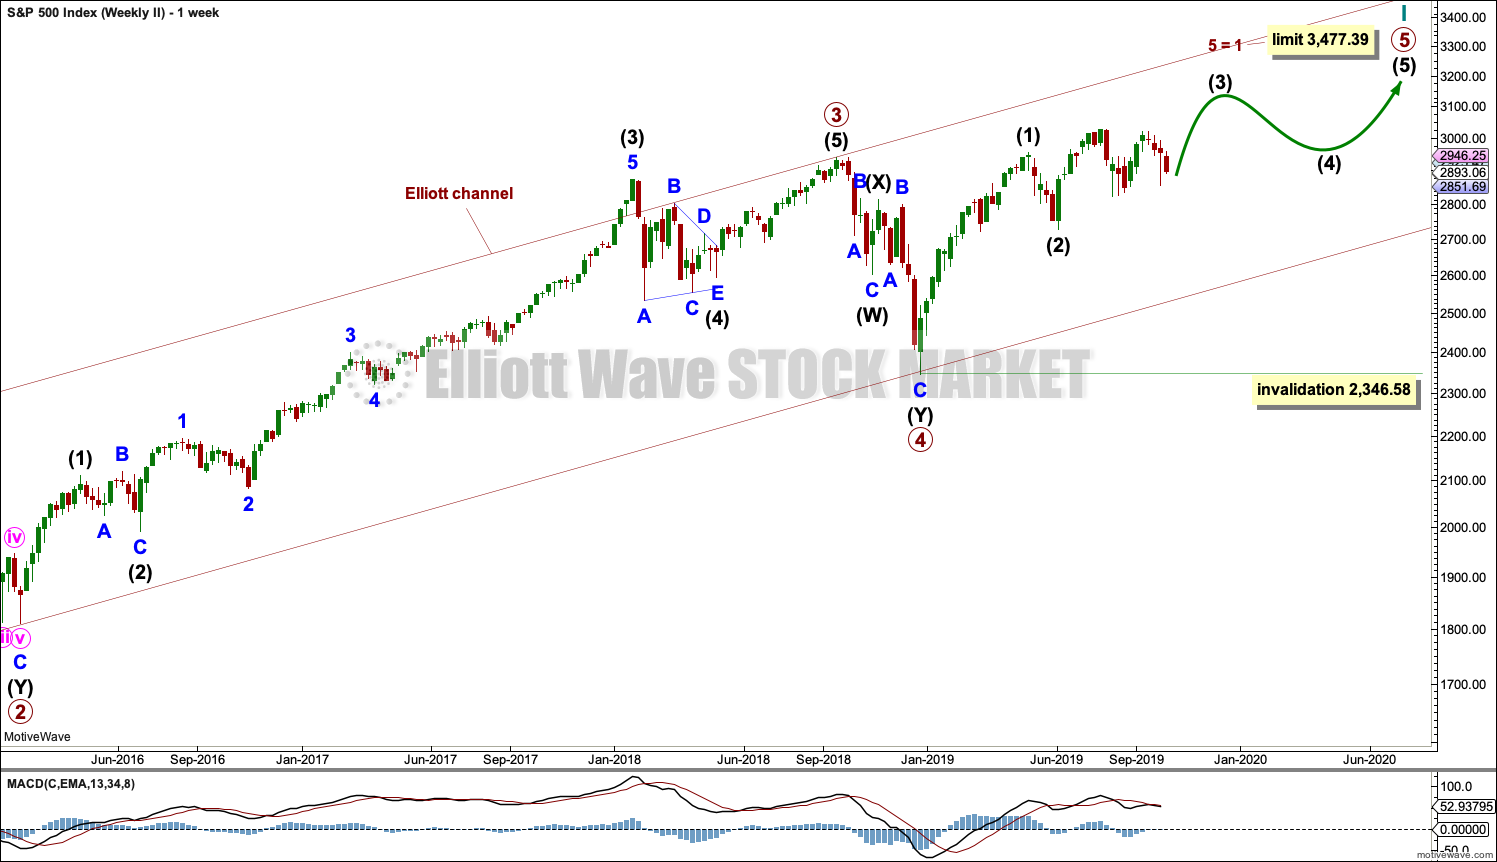
The basic Elliott wave structure consists of a five wave structure up followed by a three wave structure down (for a bull market). This wave count sees the bull market beginning in March 2009 as an incomplete five wave impulse and now within the last fifth wave, which is labelled cycle wave V. This impulse is best viewed on monthly charts. The weekly chart focusses on the end of it.
Elliott wave is fractal. This fifth wave labelled cycle wave V may end a larger fifth wave labelled Super Cycle wave (V), which may end a larger first wave labelled Grand Super Cycle wave I.
The teal Elliott channel is drawn using Elliott’s first technique about the impulse of Super Cycle wave (V). Draw the first trend line from the end of cycle wave I (off to the left of the chart, the weekly candlestick beginning 30th November 2014) to the end of cycle wave III, then place a parallel copy on the end of cycle wave II. This channel perfectly shows where cycle wave IV ended at support. The strongest portion of cycle wave III, the end of primary wave 3, overshoots the upper edge of the channel. This is a typical look for a third wave and suggests the channel is drawn correctly and the way the impulse is counted is correct.
Within Super Cycle wave (V), cycle wave III is shorter than cycle wave I. A core Elliott wave rule states that a third wave may never be the shortest. For this rule to be met in this instance, cycle wave V may not be longer in length than cycle wave III. This limit is at 3,477.39.
Cycle wave V may subdivide either as an impulse or an ending diagonal. Impulses are much more common. This main wave count expects that cycle wave V may be unfolding as an impulse.
The daily chart below will focus on movement from the end of primary wave 2.
In historic analysis, two further monthly charts have been published that do not have a limit to upwards movement and are more bullish than this wave count. Members are encouraged to consider those possibilities (links below summary) alongside the wave counts presented on a daily and weekly basis.
Within cycle wave V, primary waves 1 and 2 may be complete. Within primary wave 3, no second wave correction may move beyond its start below 2,728.81.
MAIN DAILY CHART
Click chart to enlarge.
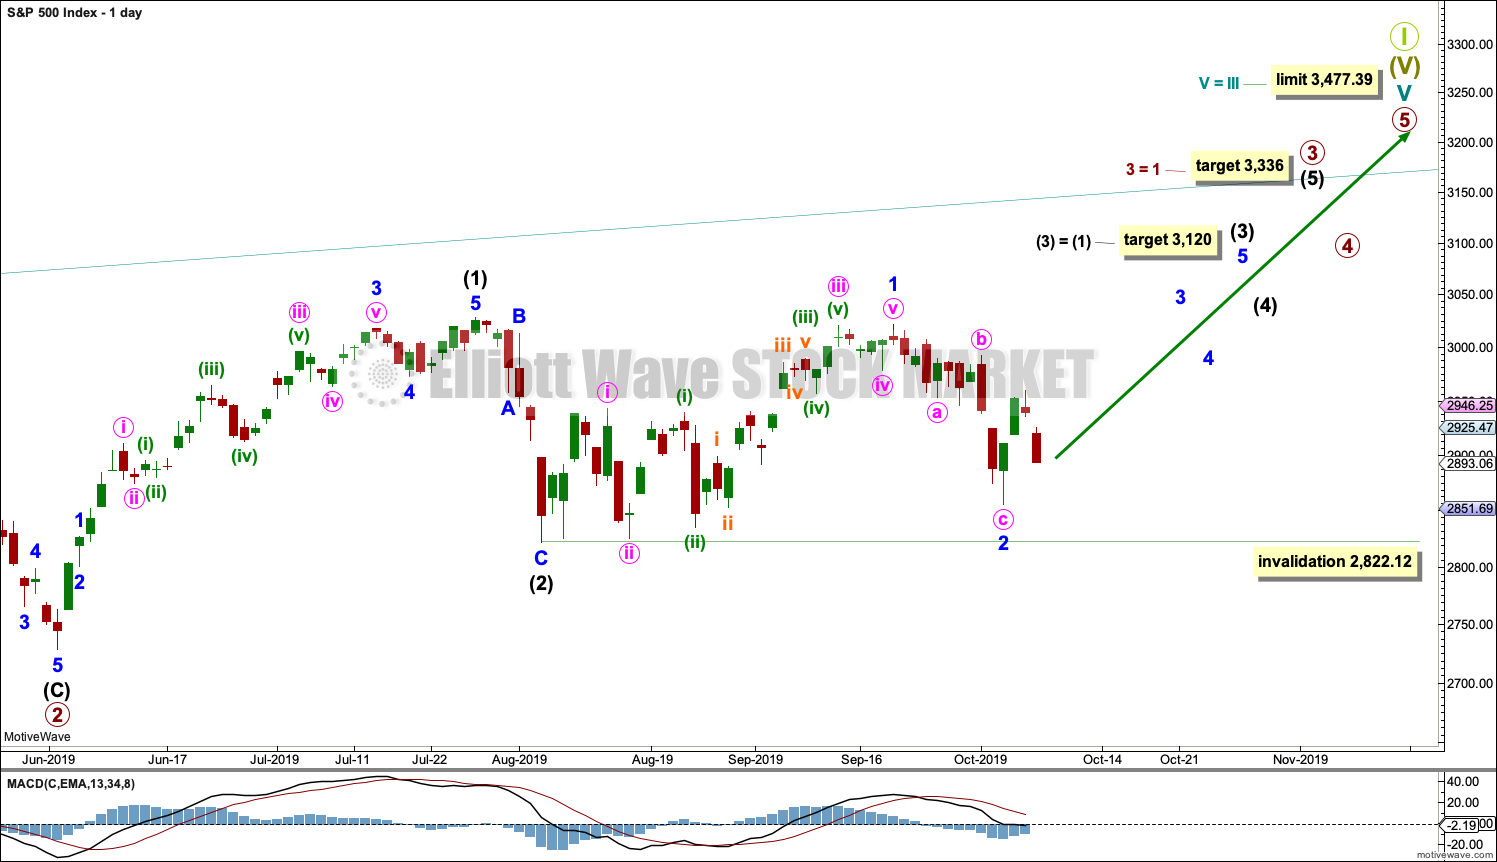
Primary wave 3 may have begun.
All of primary wave 3, intermediate wave (3) and minor wave 3 may only subdivide as impulses. Within each impulse, its second wave correction may not move beyond the start of its first wave.
Minor wave 2 may not move beyond the start of minor wave 1 below 2,822.12.
Intermediate wave (3) must move far enough above the end of intermediate wave (1) to then allow intermediate wave (4) to unfold and remain above intermediate wave (1) price territory.
HOURLY CHART
Click chart to enlarge.
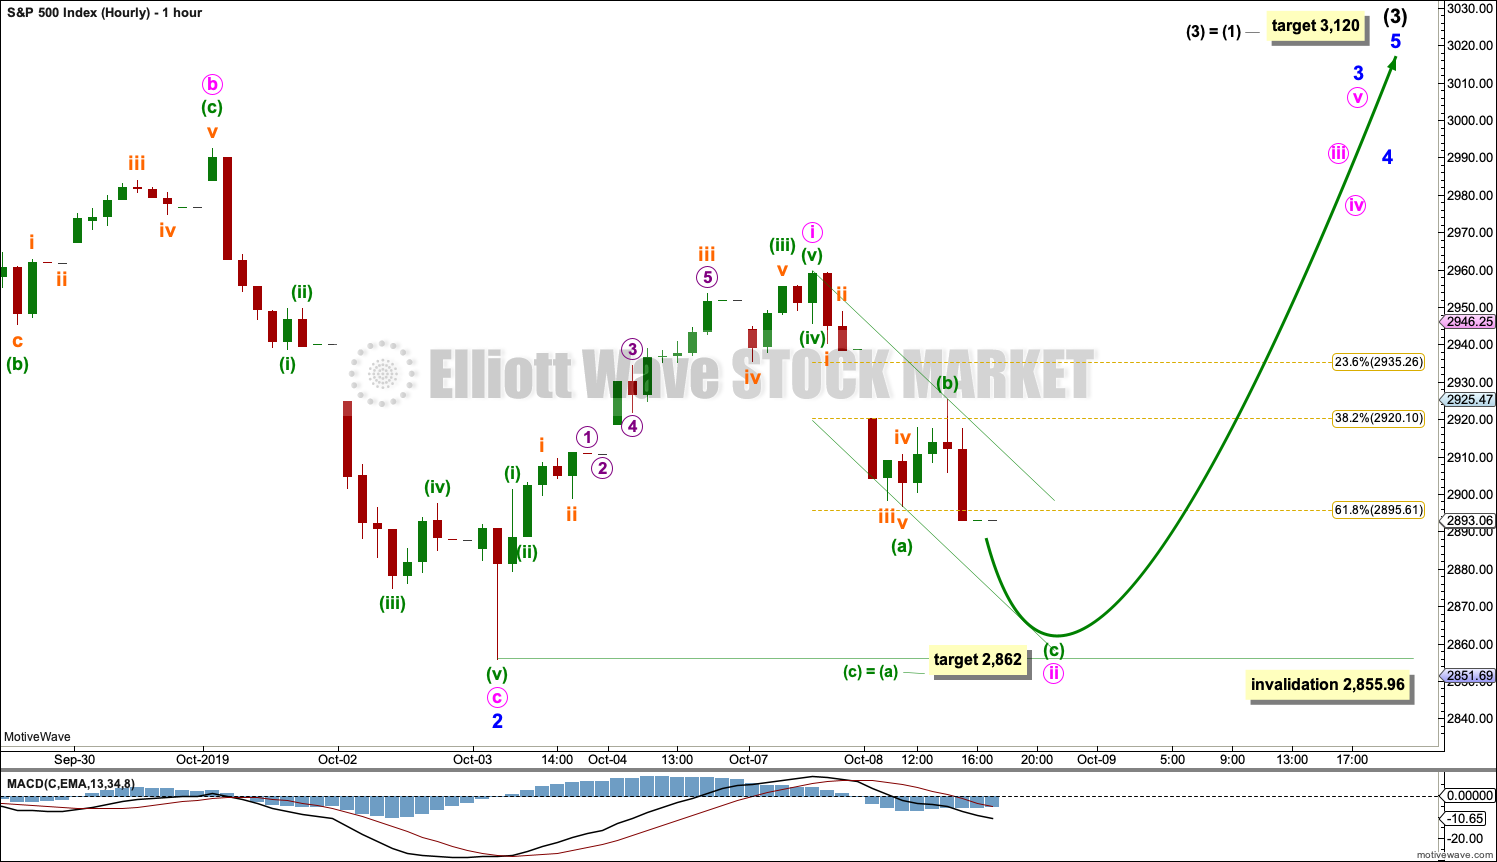
If a second wave correction is unfolding lower, then it would most likely subdivide as a zigzag.
It is possible that minor wave 2 could be over.
Minor wave 3 may only subdivide as an impulse. Minute wave ii may continue lower tomorrow to the target. Minute wave ii may be subdividing as a zigzag. A small channel is drawn about minute wave ii. A breach of this channel by upwards movement with at least one full hourly candlestick above and not touching the upper edge would provide some confidence that minute wave ii should be over.
Minute wave ii may not move beyond the start of minute wave i below 2,855.96.
ALTERNATE WEEKLY CHART
Click chart to enlarge.
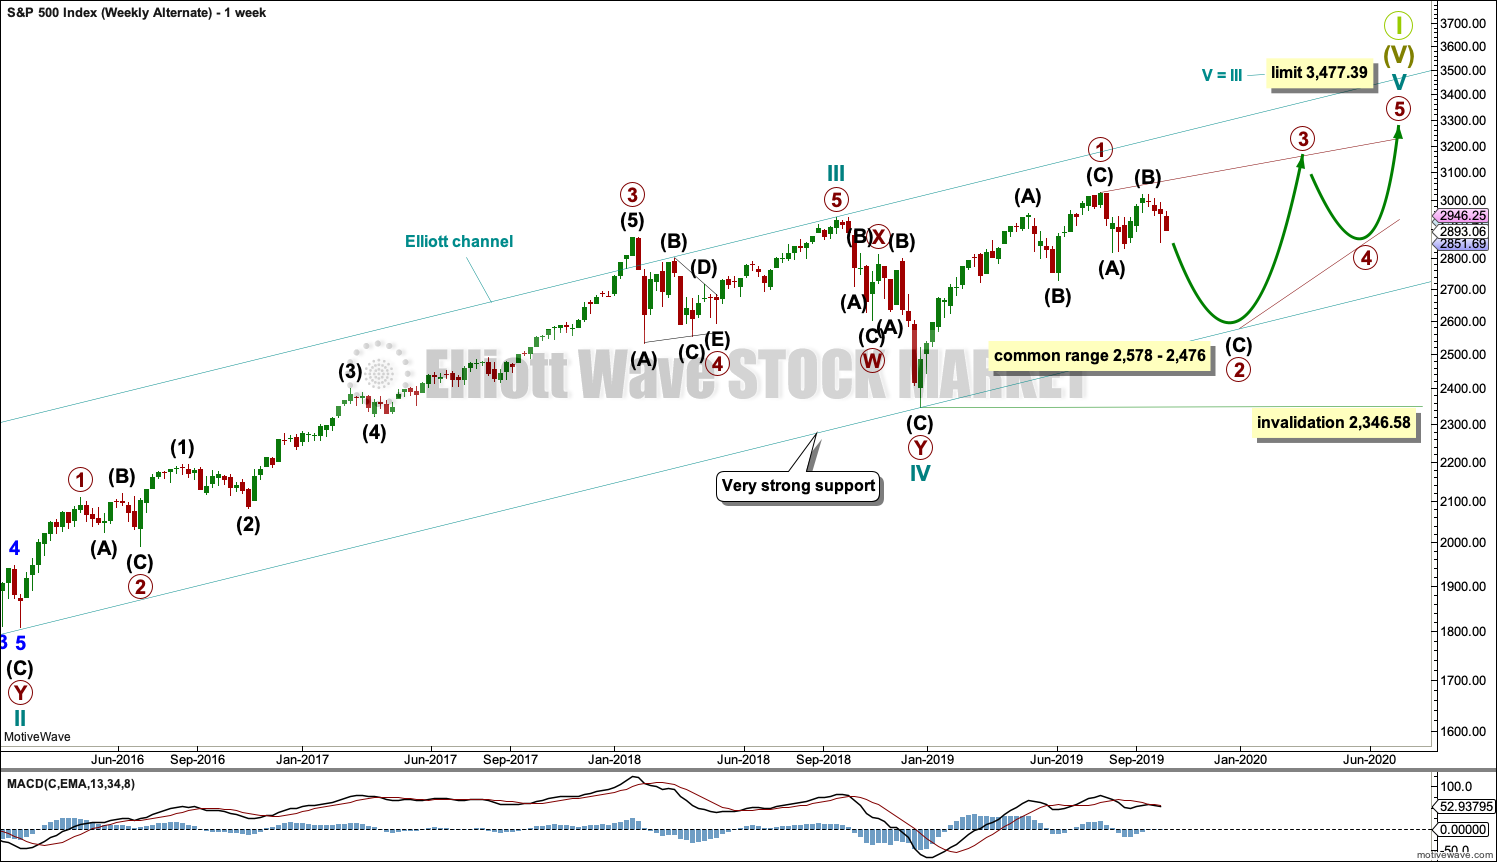
Cycle wave V may be subdividing as an ending diagonal. Within ending diagonals, all sub-waves must subdivide as zigzags. Primary wave 1 may be over at the last all time high as a zigzag.
Primary wave 2 must complete lower as a zigzag.
The second and fourth waves within diagonals are usually very deep, commonly between 0.81 to 0.66 the depth of the prior wave. This gives a target zone for primary wave 2.
Primary wave 2 may end if it comes down to find support at the lower edge of the teal channel, which is copied over from monthly and weekly charts. This trend line should provide final support for a deeper pullback.
Primary wave 2 may not move beyond the start of primary wave 1 below 2,346.58.
SECOND WAVE COUNT
WEEKLY CHART
Click chart to enlarge.
This weekly chart is almost identical to the first weekly chart, with the sole exception being the degree of labelling.
This weekly chart moves the degree of labelling for the impulse beginning in March 2009 all down one degree. This difference is best viewed on monthly charts.
The impulse is still viewed as nearing an end; a fifth wave is still seen as needing to complete higher. This wave count labels it primary wave 5.
Primary wave 5 may be subdividing as either an impulse or ending diagonal, in the same way that cycle wave V is seen for the first weekly chart.
TECHNICAL ANALYSIS
WEEKLY CHART
Click chart to enlarge. Chart courtesy of StockCharts.com.
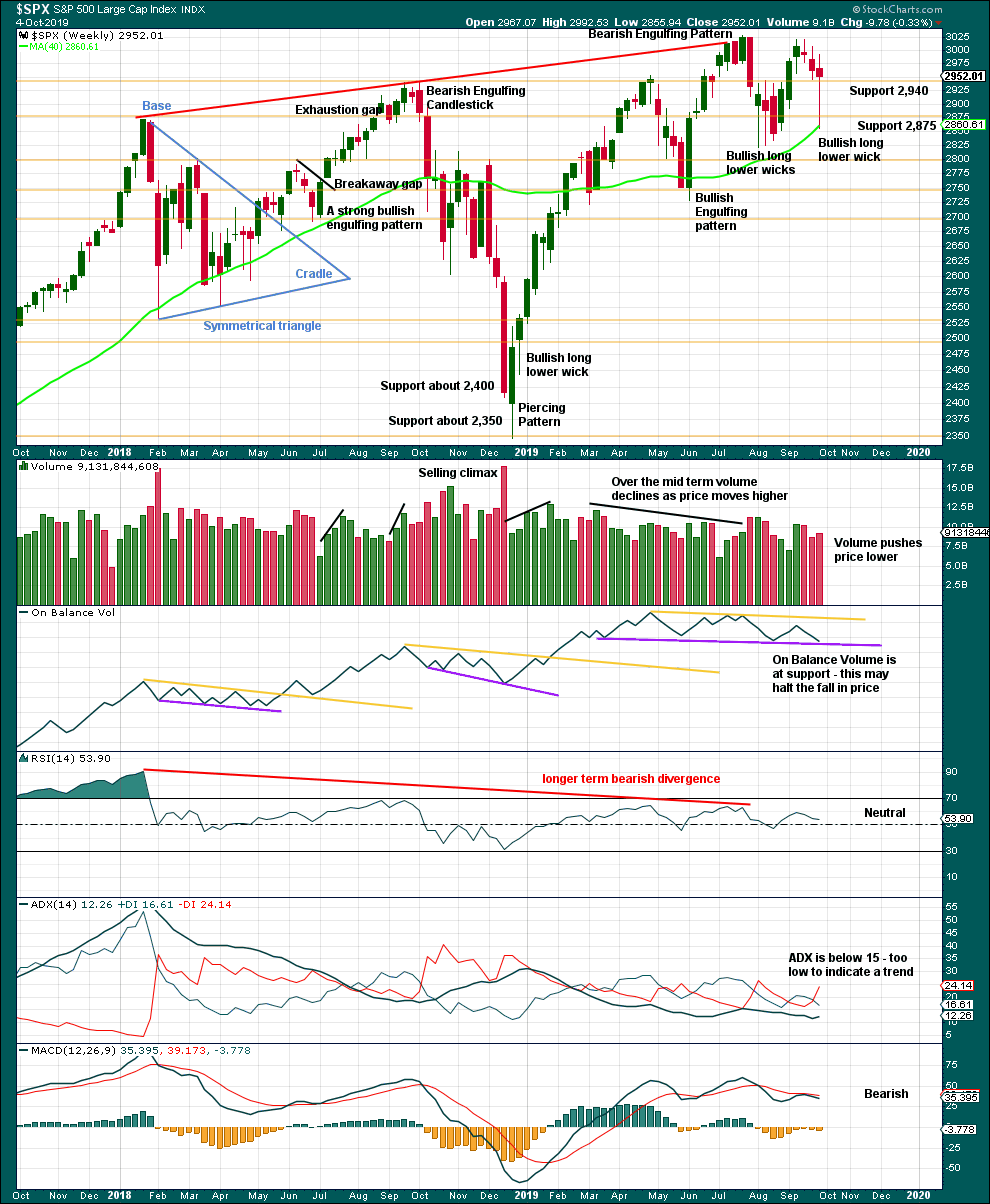
This last weekly candlestick with a very long lower wick and On Balance Volume at support suggest the pullback is over.
DAILY CHART
Click chart to enlarge. Chart courtesy of StockCharts.com.
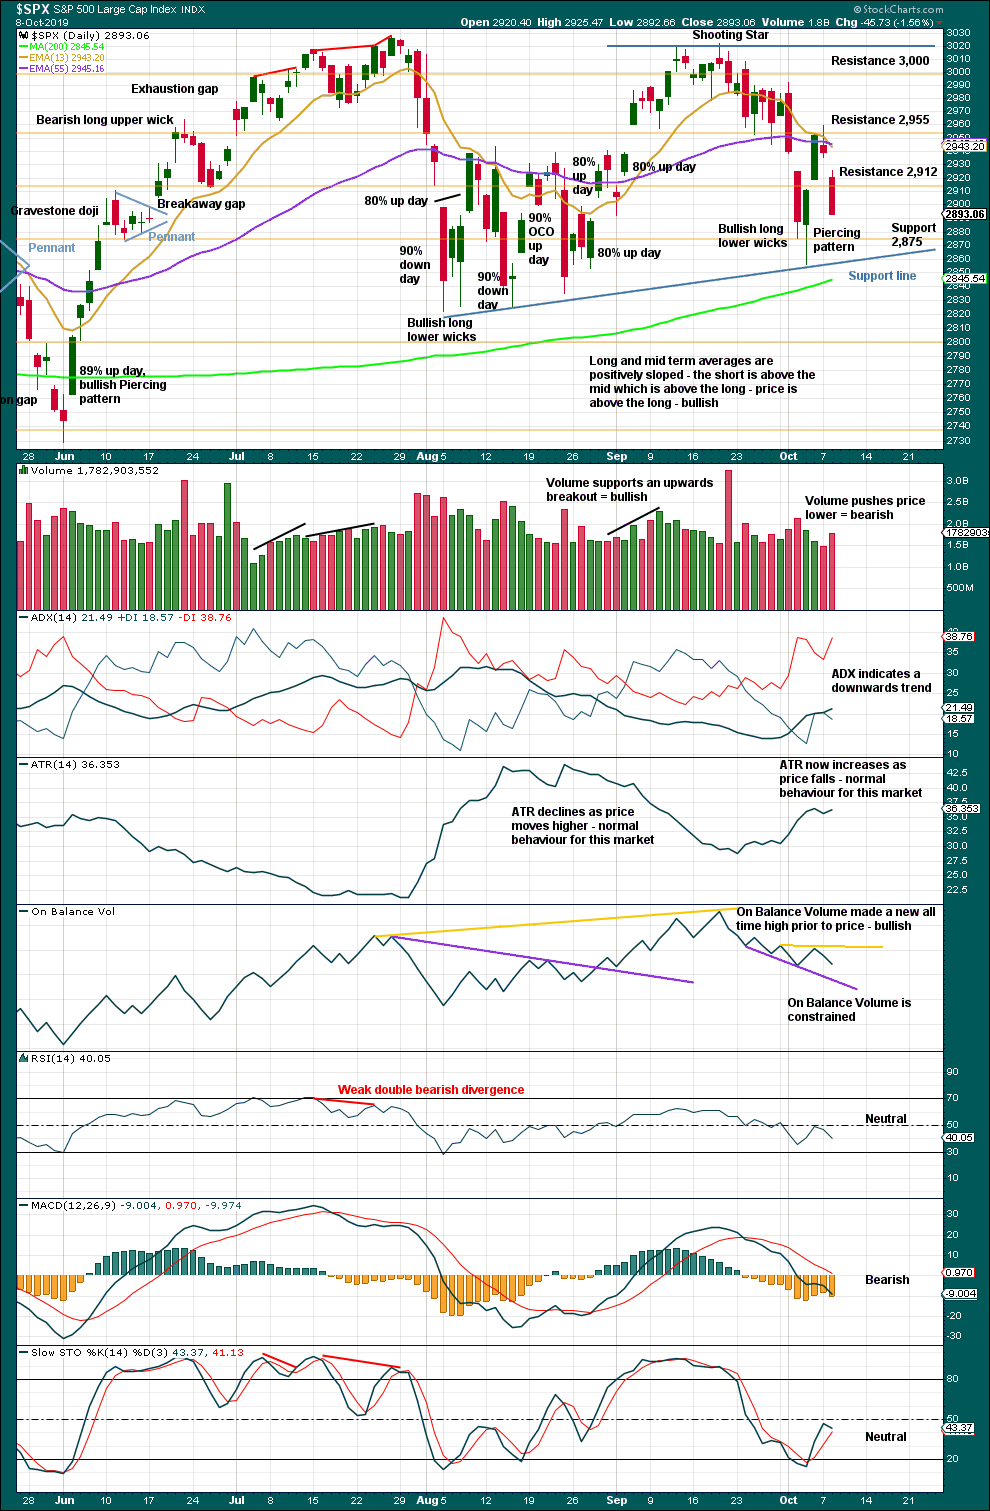
There is now a series of higher highs and higher lows since the 5th of August. Strength in 90% up days and back to back 80% up days off lows indicate the lows may still be sustainable.
Today a push from volume and a close near the low for the session indicate more downwards movement tomorrow. A new support line is drawn, and a new resistance line is added close to all time highs. A large ascending triangle may be unfolding.
BREADTH – AD LINE
WEEKLY CHART
Click chart to enlarge. Chart courtesy of StockCharts.com. So that colour blind members are included, bearish signals
will be noted with blue and bullish signals with yellow.
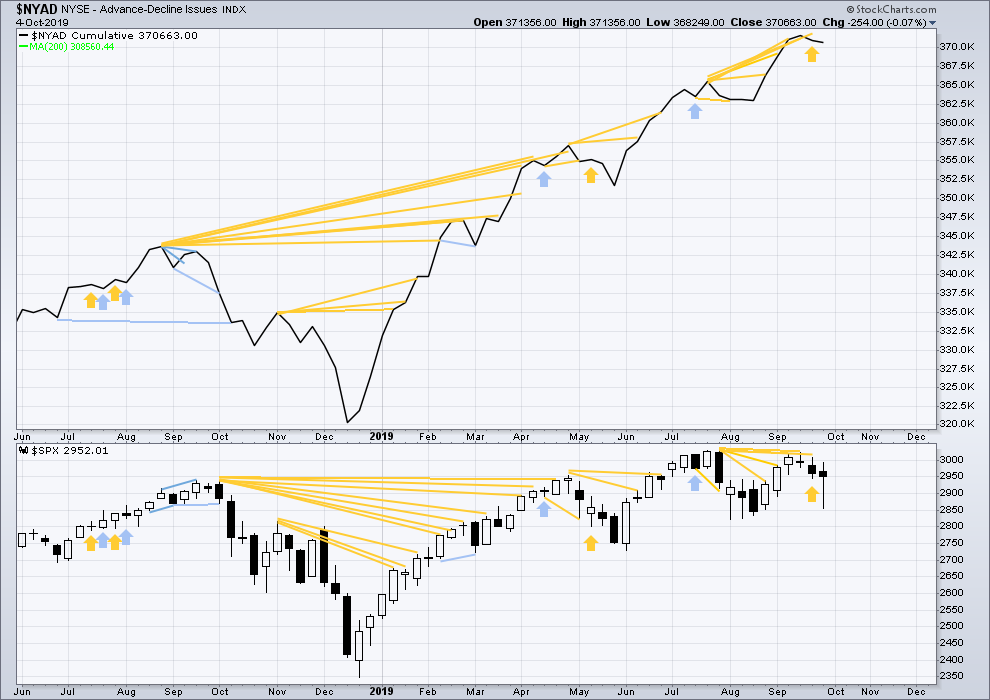
Bear markets from the Great Depression and onwards have been preceded by an average minimum of 4 months divergence between price and the AD line with only two exceptions in 1946 and 1976. With the AD line making new all time highs again this week, the end of this bull market and the start of a new bear market is very likely a minimum of 4 months away, which is end January 2020.
In all bear markets in the last 90 years there is some positive correlation (0.6022) between the length of bearish divergence and the depth of the following bear market. No to little divergence is correlated with more shallow bear markets. Longer divergence is correlated with deeper bear markets.
If a bear market does develop here, it comes after no bearish divergence. It would therefore more likely be shallow.
Last week both price and the AD line have moved lower. There is no new divergence.
Small caps have made a new swing high above the prior high of the end of July, but mid and large caps have not yet done so. The last upwards movement appears to be led by small caps. Because small caps are usually the first to exhibit deterioration in the later stages of a bull market, some strength in small caps at this stage indicates a healthy bull market with further to run.
DAILY CHART
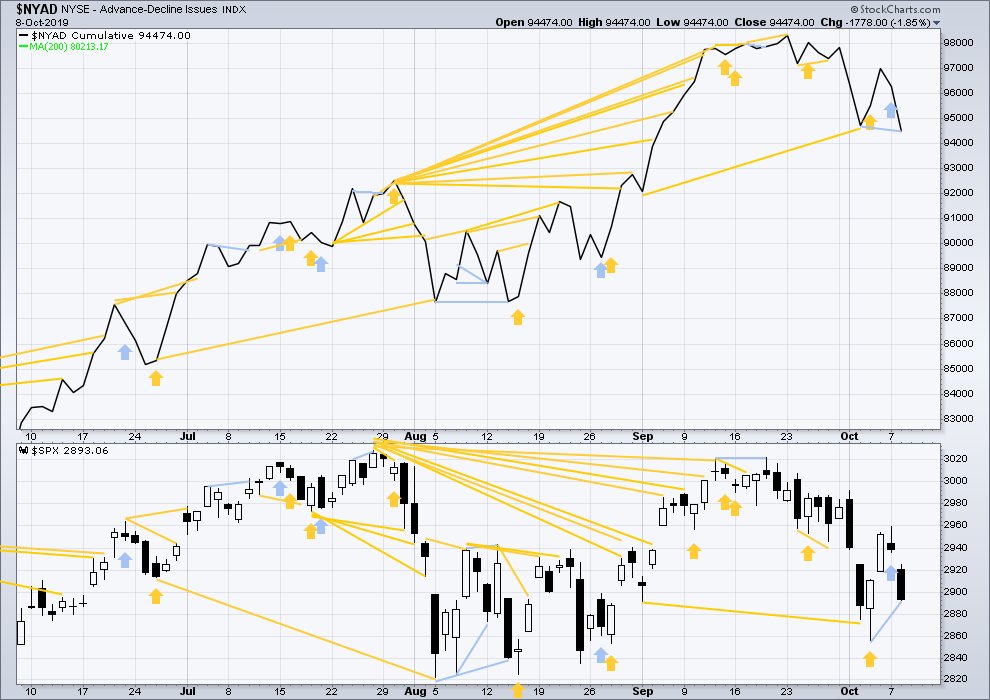
Click chart to enlarge. Chart courtesy of StockCharts.com. So that colour blind members are included, bearish signals
will be noted with blue and bullish signals with yellow.
Breadth should be read as a leading indicator.
Today the AD line has made a slight new low below the prior swing low of the 2nd / 3rd of October, but price has not. Breadth is falling faster than price. This divergence is bearish for the short term.
VOLATILITY – INVERTED VIX CHART
WEEKLY CHART
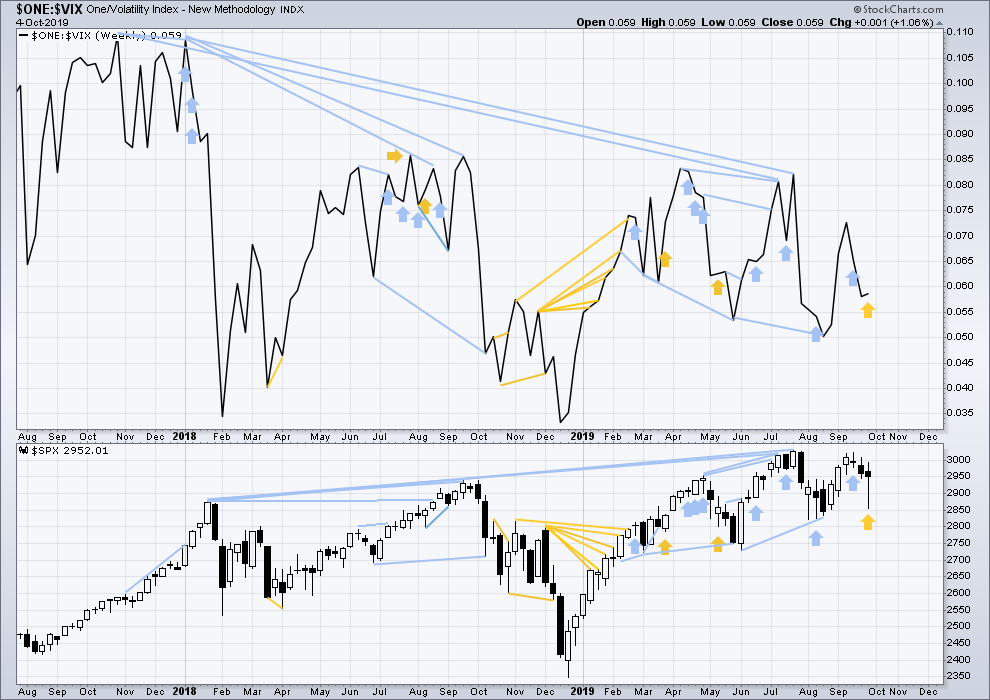
Click chart to enlarge. Chart courtesy of StockCharts.com. So that colour blind members are included, bearish signals
will be noted with blue and bullish signals with yellow.
The all time high for inverted VIX (which is the same as the low for VIX) was on 30th October 2017. There is now nearly one year and eleven months of bearish divergence between price and inverted VIX.
The rise in price is not coming with a normal corresponding decline in VIX; VIX remains elevated. This long-term divergence is bearish and may yet develop further as the bull market matures.
This divergence may be an early warning, a part of the process of a top developing that may take years. It may not be useful in timing a trend change.
Last week price has moved lower, but inverted VIX has moved higher. This divergence is bullish for the short term.
DAILY CHART
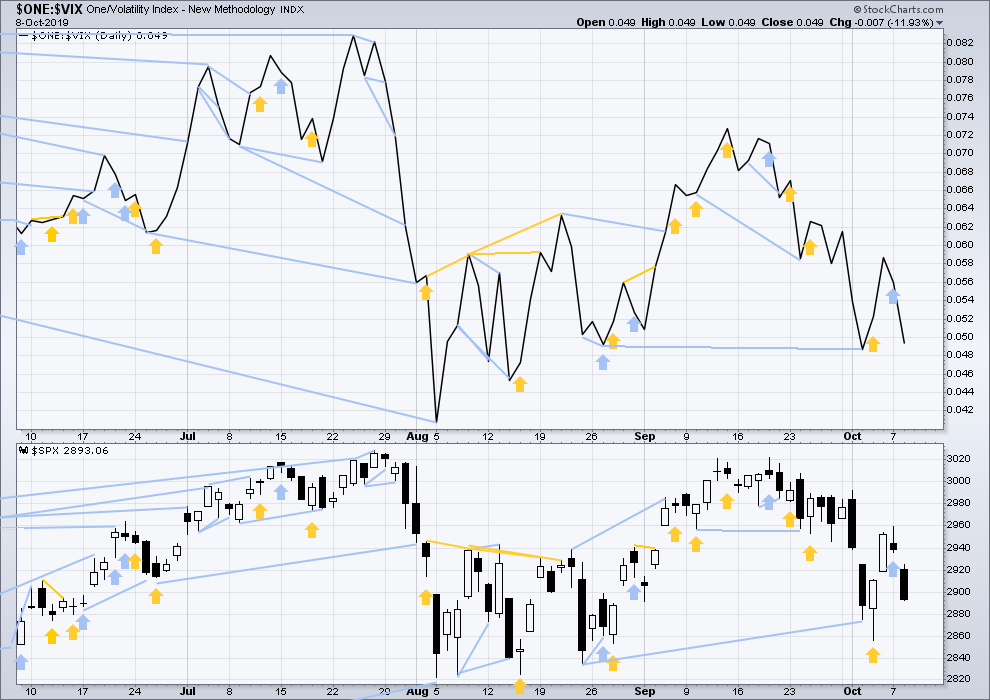
Click chart to enlarge. Chart courtesy of StockCharts.com. So that colour blind members are included, bearish signals
will be noted with blue and bullish signals with yellow.
Today both price and inverted VIX have moved lower. Neither have made new short-term swing lows below the prior low of the 2nd / 3rd October. There is no new short-term divergence to confirm divergence in the AD line.
DOW THEORY
Dow Theory confirmed a bear market in December 2018. This does not necessarily mean a bear market at Grand Super Cycle degree though; Dow Theory makes no comment on Elliott wave counts. On the 25th of August 2015 Dow Theory also confirmed a bear market. The Elliott wave count sees that as part of cycle wave II. After Dow Theory confirmation of a bear market in August 2015, price went on to make new all time highs and the bull market continued.
DJIA: 23,344.52 – a close on the 19th of December at 23,284.97 confirms a bear market.
DJT: 9,806.79 – price has closed below this point on the 13th of December.
S&P500: 2,532.69 – a close on the 19th of December at 2,506.96 provides support to a bear market conclusion.
Nasdaq: 6,630.67 – a close on the 19th of December at 6,618.86 provides support to a bear market conclusion.
With all the indices having moved higher following a Dow Theory bear market confirmation, Dow Theory would confirm a bull market if the following highs are made:
DJIA: 26,951.81 – a close above this point has been made on the 3rd of July 2019.
DJT: 11,623.58 – to date DJT has failed to confirm an ongoing bull market.
S&P500: 2,940.91 – a close above this point was made on the 29th of April 2019.
Nasdaq: 8,133.30 – a close above this point was made on the 26th of April 2019.
Published @ 07:51 p.m. EST.
—
Careful risk management protects your trading account(s).
Follow my two Golden Rules:
1. Always trade with stops.
2. Risk only 1-5% of equity on any one trade.
—
New updates to this analysis are in bold.
At the close of the session, weakness in upwards movement today fits best with my second chart below. That will be the hourly chart published today.
Hi Lara, quick question. In Prechter’s book he has a section describing the character of the waves. How much weight should one give to this as a wave unfolds in real time? Today’s move has certainly been up, but it has just been a grind..certainly, not as robust as one might think for a third. Thanks for any guidance.
I’d give it some weight. But I’m looking at the data within the waves; volume, buying power, selling pressure (those are from Lowry’s data), momentum…
Currently this bounce may have been the end of wave B within a second wave correction as per my second hourly chart below. That would explain weakness today.
Within third waves, there are corrections. The second and fourth wave corrections within third waves should exhibit weakness.
First waves (which we’ve had so far) within primary wave 3 may not be the strongest portion of the third wave. That’s usually the third wave within the third wave, the middle portion.
hourly chart updated
well, I thought because of the AD line, volume and the close yesterday that today would see more downwards movement
obviously I was wrong
two scenarios today, this the second
confidence that the pullback is over would come with a new high above 2,959.75
FWIW, this chart looks better to me. Is Minuette (c) required to make a new low below Minuette (a)? That might be a good entry place for a intermediate term long position with below 2856 as a stop.
I’m cautiously taking a calculated risk on Lara’s first chart, as it aligns with my template. Stop is already above my entry, but that doesn’t protect against a gap down overnight. We will see…
Oops… that didn’t last long! Yikes!
Yes, we are getting some big money program sells. Some folks are a bit spooked by what might transpire in another day or two, should the Chinese raise their middle finger and fly home. It’s a good time to be very cautious in my personal opinion folks. Protect yourselves at all times!
This is why we always trade with stops. For me, today, using a 30-minute chart template, I had a scratch trade in NQ and a tiny loss in UPRO. No regrets. None at all.
I happily await more clarity.
My indicators align with this chart. Maybe a slight push up tmrw morning, followed by more down-side before we finish minute (ii).
To the GAP and ….. back down?
Wake up and be lively, me hardies!
There are 5-wave down on the ES, this may only be wave A of 2, so 2 could be a longer correction…
If said C wave is driven by failure in the China trade talks, it could be quite a C wave down indeed. I personally don’t see price action telling me there’s impulsive action up yet. Just more milling around waiting to see what comes Friday/Monday.