
Upwards movement was expected to begin the new week. The Elliott wave target remains the same. The breakaway gap continues to provide support.
Summary: The upwards trend to new all time highs may resume. The next target is 3,120.
A new low below 2,931 would indicate a deeper pullback. The target would then be at 2,916 or 2,905.
The biggest picture, Grand Super Cycle analysis, is here.
Monthly charts were last published here, with video here. There are two further alternate monthly charts here, with video here.
ELLIOTT WAVE COUNTS
The two weekly Elliott wave counts below will be labelled First and Second. They may be about of even probability. When the fifth wave currently unfolding on weekly charts may be complete, then these two wave counts will diverge on the severity of the expected following bear market. To see an illustration of this future divergence monthly charts should be viewed.
FIRST WAVE COUNT
WEEKLY CHART
Click chart to enlarge.
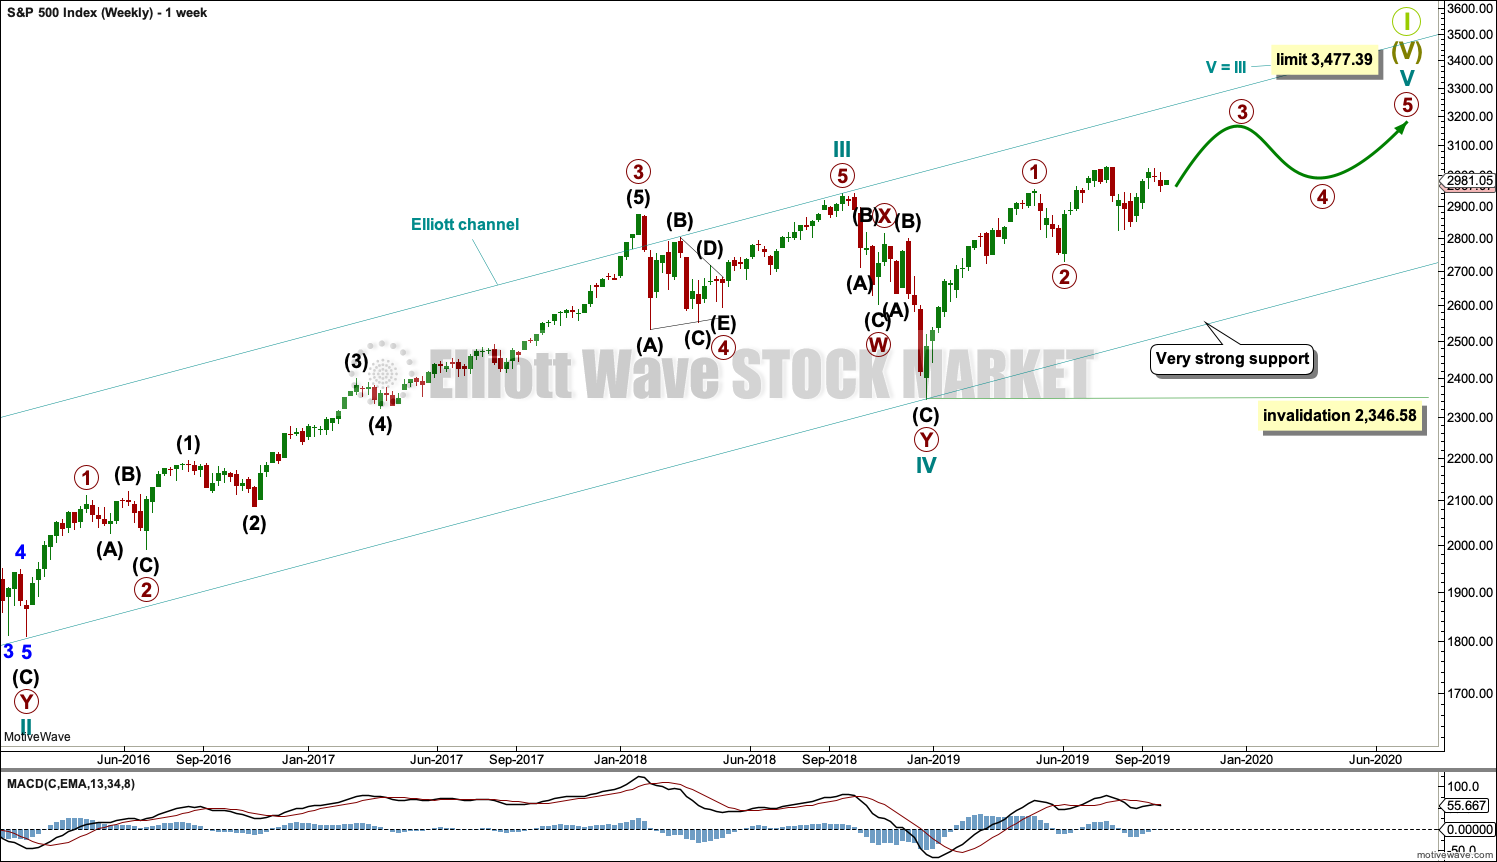
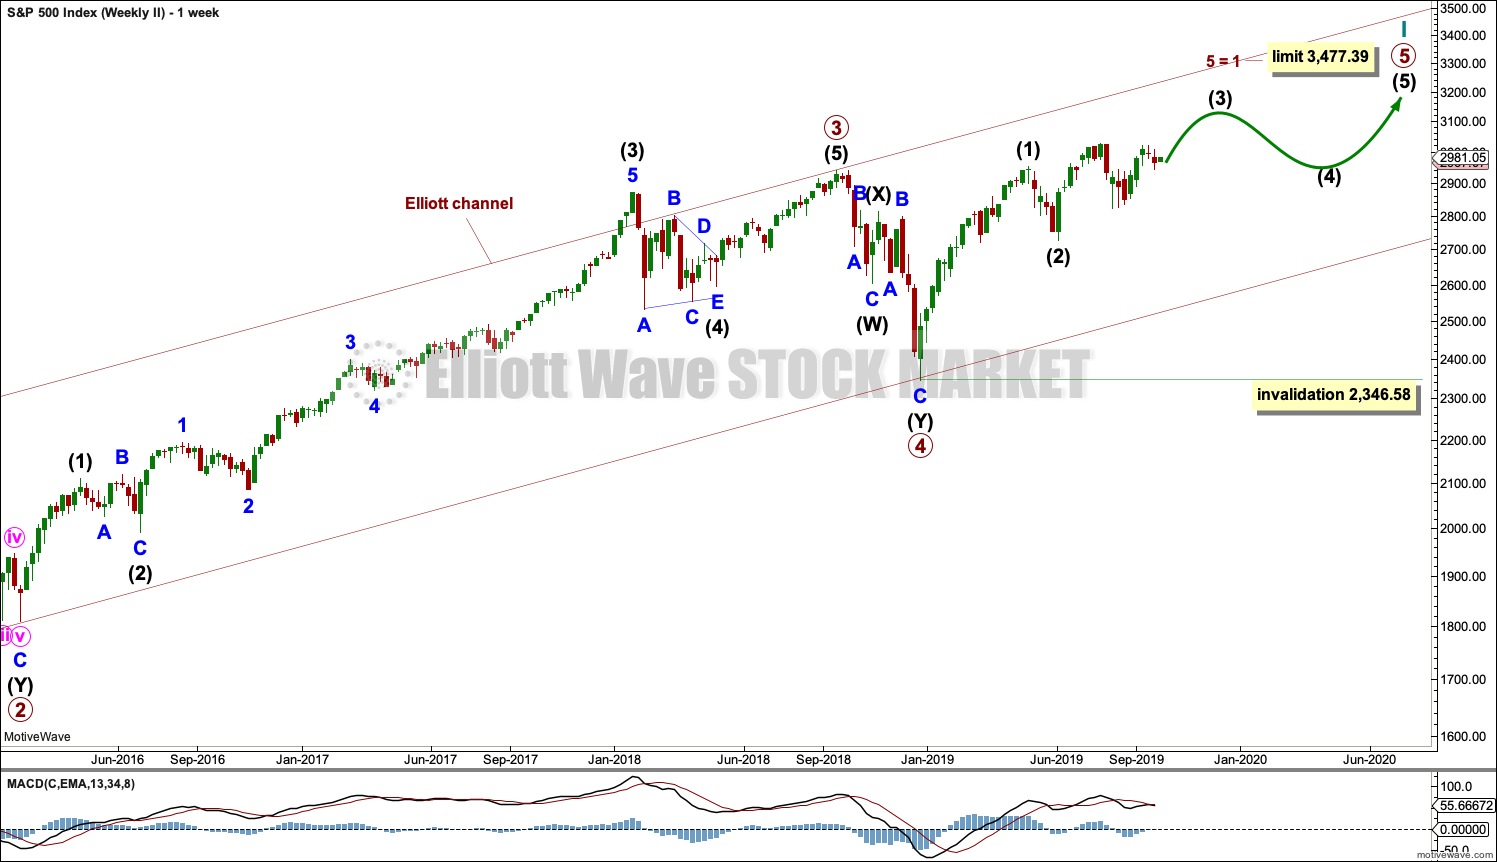
The basic Elliott wave structure consists of a five wave structure up followed by a three wave structure down (for a bull market). This wave count sees the bull market beginning in March 2009 as an incomplete five wave impulse and now within the last fifth wave, which is labelled cycle wave V. This impulse is best viewed on monthly charts. The weekly chart focusses on the end of it.
Elliott wave is fractal. This fifth wave labelled cycle wave V may end a larger fifth wave labelled Super Cycle wave (V), which may end a larger first wave labelled Grand Super Cycle wave I.
The teal Elliott channel is drawn using Elliott’s first technique about the impulse of Super Cycle wave (V). Draw the first trend line from the end of cycle wave I (off to the left of the chart, the weekly candlestick beginning 30th November 2014) to the end of cycle wave III, then place a parallel copy on the end of cycle wave II. This channel perfectly shows where cycle wave IV ended at support. The strongest portion of cycle wave III, the end of primary wave 3, overshoots the upper edge of the channel. This is a typical look for a third wave and suggests the channel is drawn correctly and the way the impulse is counted is correct.
Within Super Cycle wave (V), cycle wave III is shorter than cycle wave I. A core Elliott wave rule states that a third wave may never be the shortest. For this rule to be met in this instance, cycle wave V may not be longer in length than cycle wave III. This limit is at 3,477.39.
Cycle wave V may subdivide either as an impulse or an ending diagonal. Impulses are much more common. This main wave count expects that cycle wave V may be unfolding as an impulse.
The daily charts below will focus on price movement from the end of primary wave 2.
In historic analysis, two further monthly charts have been published that do not have a limit to upwards movement and are more bullish than this wave count. Members are encouraged to consider those possibilities (links below summary) alongside the wave counts presented on a daily and weekly basis.
MAIN DAILY CHART
Click chart to enlarge.
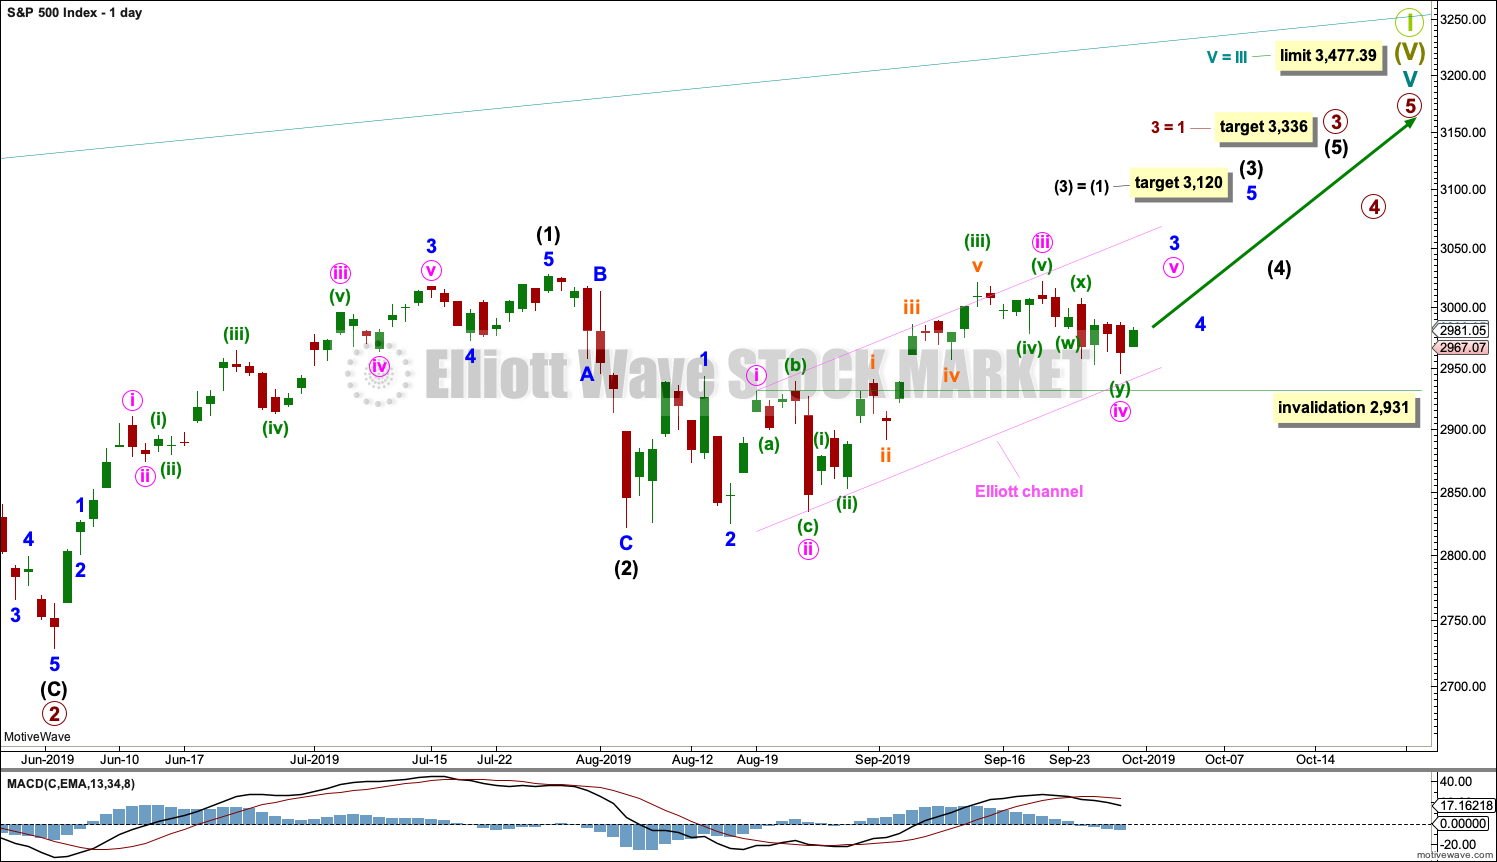
Primary wave 3 may have begun.
Primary wave 3 may only subdivide as an impulse. Within primary wave 3, intermediate waves (1) and (2) may be complete.
Intermediate wave (3) may have begun. Intermediate wave (3) may only subdivide as an impulse.
Within intermediate wave (3), minor waves 1 and 2 may be complete. Within minor wave 3, minute waves i through to iii may now be complete. Minute wave iv may not move into minute wave i price territory below 2,931.
All of primary wave 3, intermediate wave (3), minor wave 3 and minute wave iii may only subdivide as impulses. This labelling of minute wave iii as complete sees the middle of a third wave at multiple degrees now complete.
Intermediate wave (3) must move far enough above the end of intermediate wave (1) to then allow intermediate wave (4) to unfold and remain above intermediate wave (1) price territory.
HOURLY CHART
Click chart to enlarge.
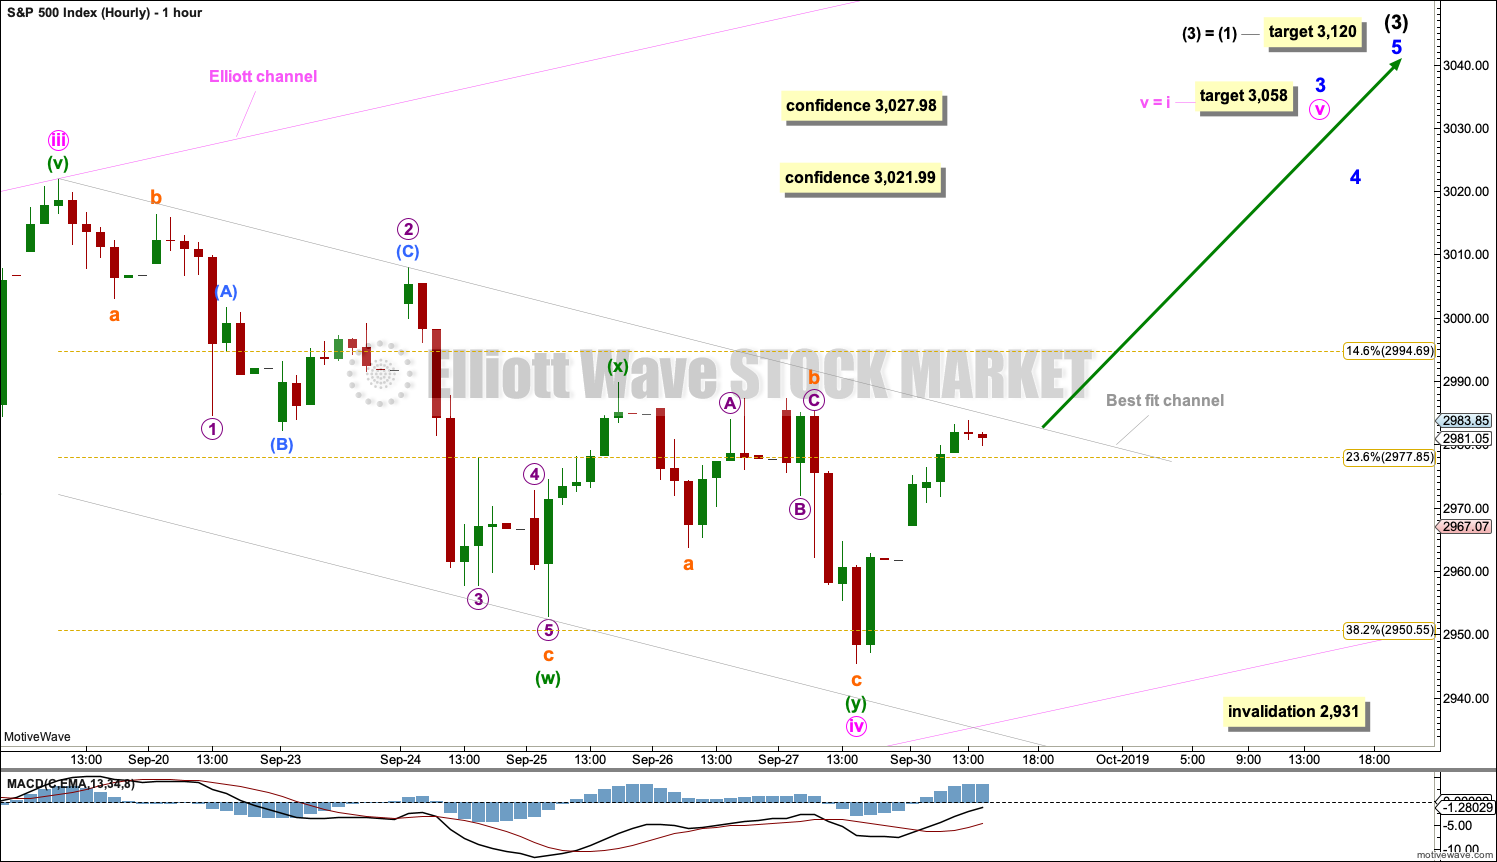
Minute wave iv may be a complete double zigzag ending close to the 0.382 Fibonacci ratio of minute wave iii. Minute wave ii was a deep flat. Minute wave iv may be a more shallow double zigzag. There is perfect alternation and good proportion.
Minute wave v must subdivide as a five wave motive structure, either an impulse or an ending diagonal. Impulses are much more common, and that is what shall be expected unless overlapping suggests a diagonal needs to be considered.
Minuette waves (i) and (ii) may be complete within minute wave v.
The invalidation point is left at the end of minute wave i to allow for the possibility that minute wave iv may not be over and may possibly continue lower as a triple zigzag. If it does continue lower, then look for support at the lower edge of the pink Elliott channel copied over from the daily chart. If price does come down to touch that trend line, it may bounce up from there.
A best fit channel is added about the double zigzag of minute wave iv. This channel is drawn conservatively to contain all of minute wave iv. If price breaks above the upper edge of this channel, then that may be used as indication that minute wave iv should be over and minute wave v should be underway. At that stage, the invalidation point may be moved up to the start of minute wave v.
ALTERNATE DAILY CHART
Click chart to enlarge.
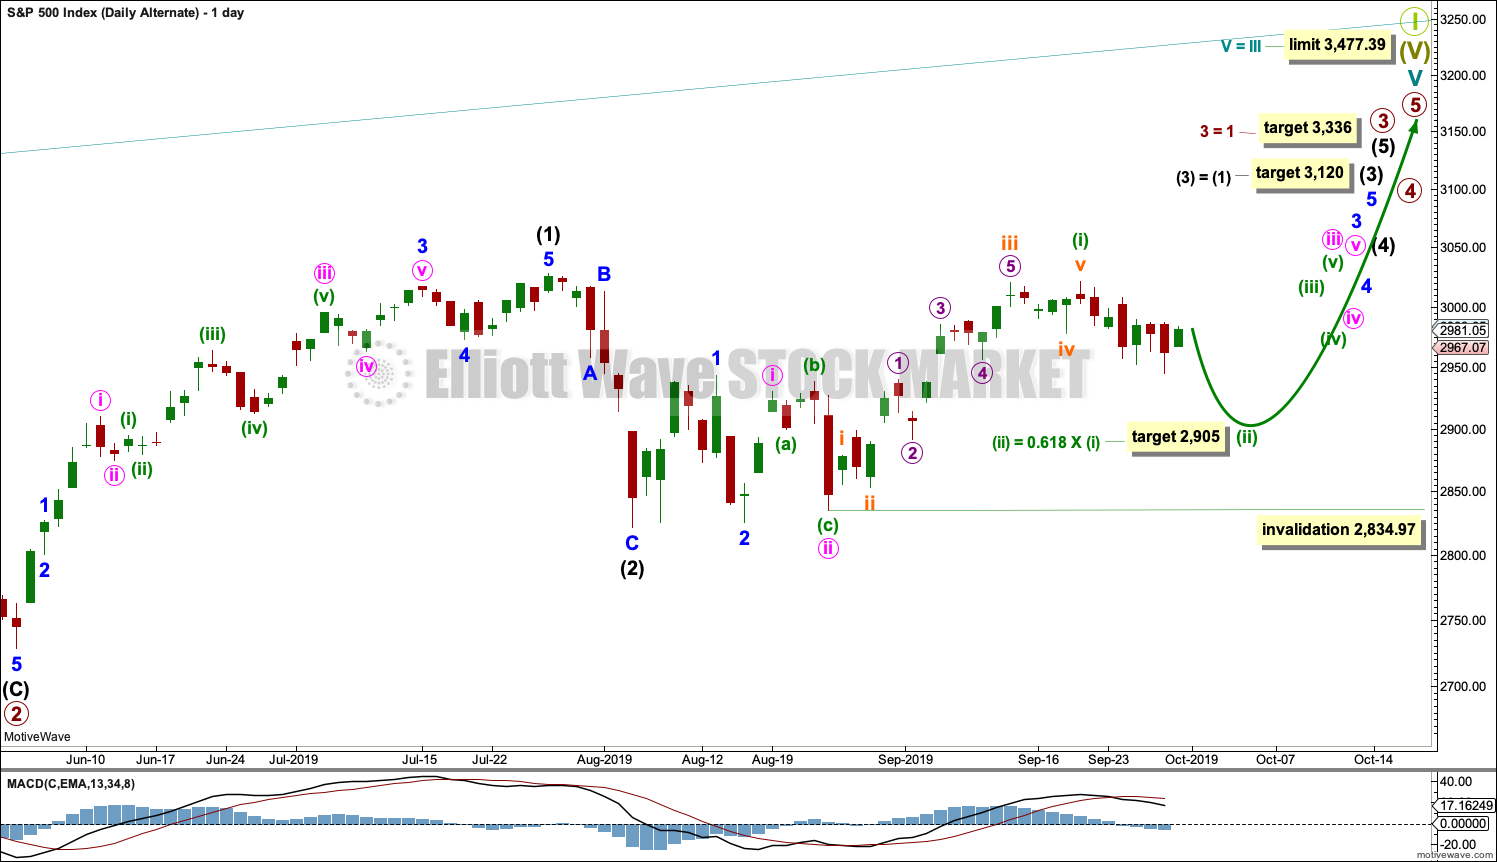
If the main daily wave count is invalidated with a new low by any amount at any time frame below 2,931, then this is the alternate that should be used.
If the degree of labelling within minute wave iii is moved down one degree, then it is possible to see that the pullback may not be over.
Within minute wave iii, it may be that only minuette wave (i) was over at the last high. A target for minuette wave (ii) would be the 0.618 Fibonacci Ratio of minuette wave (i).
This wave count expects that the middle of a third wave at multiple degrees has not yet passed and is ahead.
Minuette wave (ii) may not move beyond the start of minuette wave (i) below 2,834.97.
ALTERNATE HOURLY CHART
Click chart to enlarge.
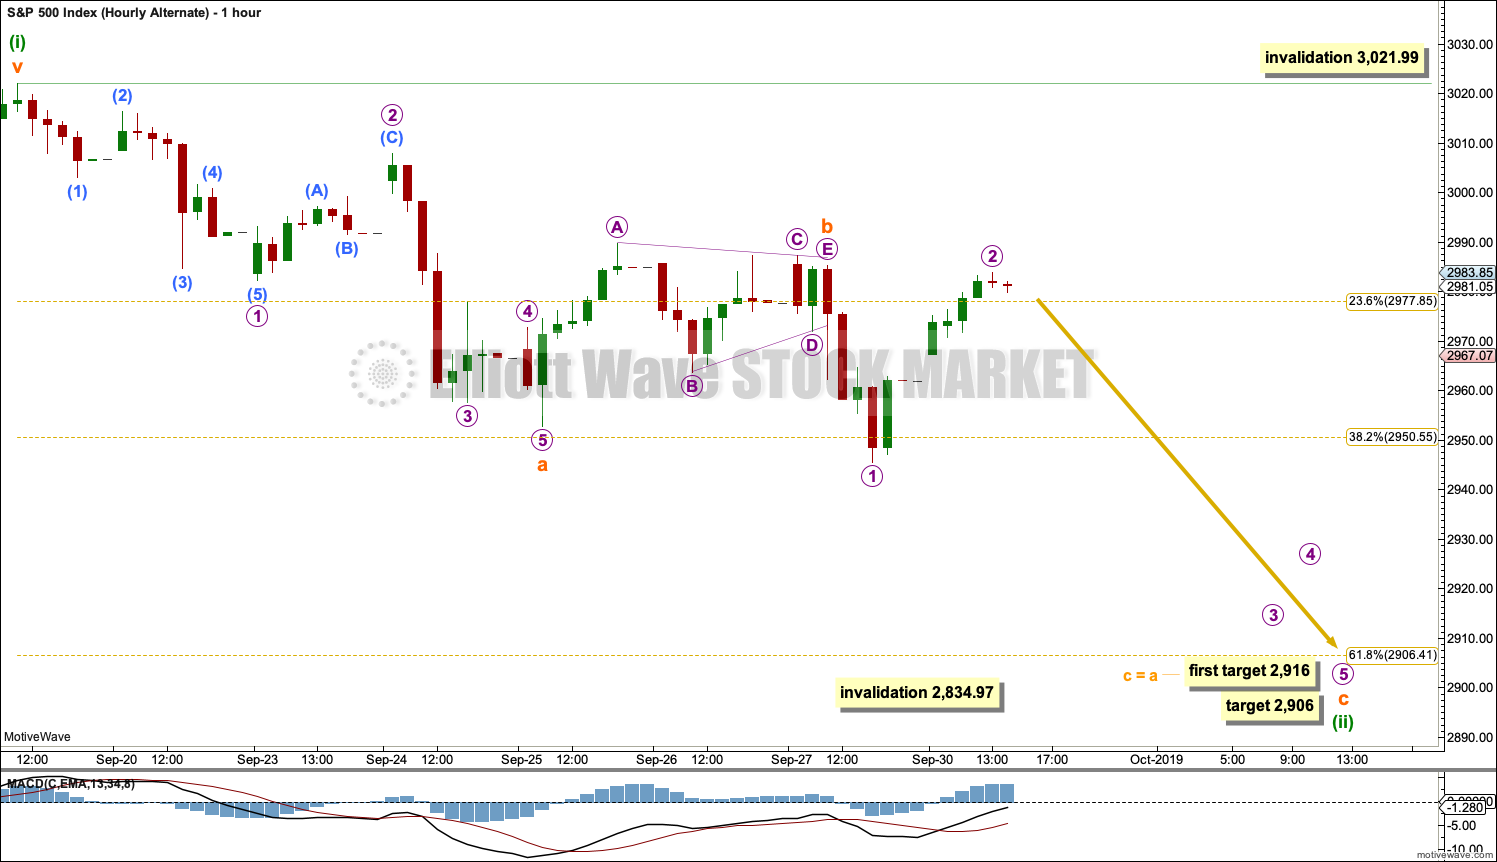
If a second wave correction is unfolding lower, then it would most likely subdivide as a zigzag.
Within minuette wave (ii), subminuette waves a and b may be complete. Subminuette wave c may have begun. At 2,916 subminuette wave c would reach equality in length with subminuette wave a. If price keeps falling through this first target, then the next target is at 2,906 where minuette wave (ii) would reach the 0.618 Fibonacci ratio of minuette wave (i).
If it continues further, then subminuette wave b may not move beyond the start of subminuette wave a above 3,021.99.
SECOND WAVE COUNT
WEEKLY CHART
Click chart to enlarge.
This weekly chart is almost identical to the first weekly chart, with the sole exception being the degree of labelling.
This weekly chart moves the degree of labelling for the impulse beginning in March 2009 all down one degree. This difference is best viewed on monthly charts.
The impulse is still viewed as nearing an end; a fifth wave is still seen as needing to complete higher. This wave count labels it primary wave 5.
TECHNICAL ANALYSIS
WEEKLY CHART
Click chart to enlarge. Chart courtesy of StockCharts.com.
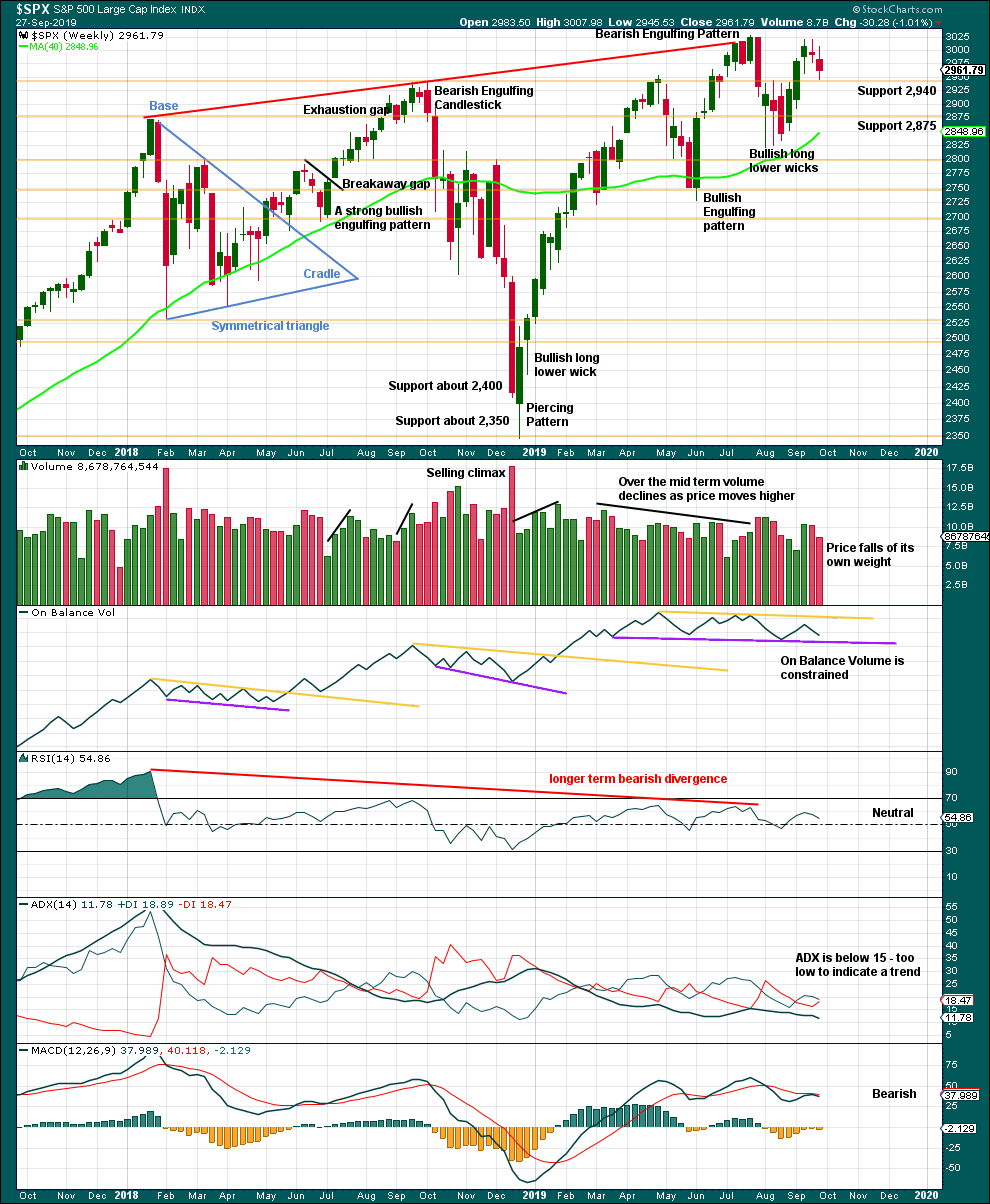
There is no bearish candlestick reversal pattern in the last three weekly candlesticks. A decline in volume last week with a small range real body is slightly bullish. This looks like a small pullback within an ongoing upwards trend.
DAILY CHART
Click chart to enlarge. Chart courtesy of StockCharts.com.
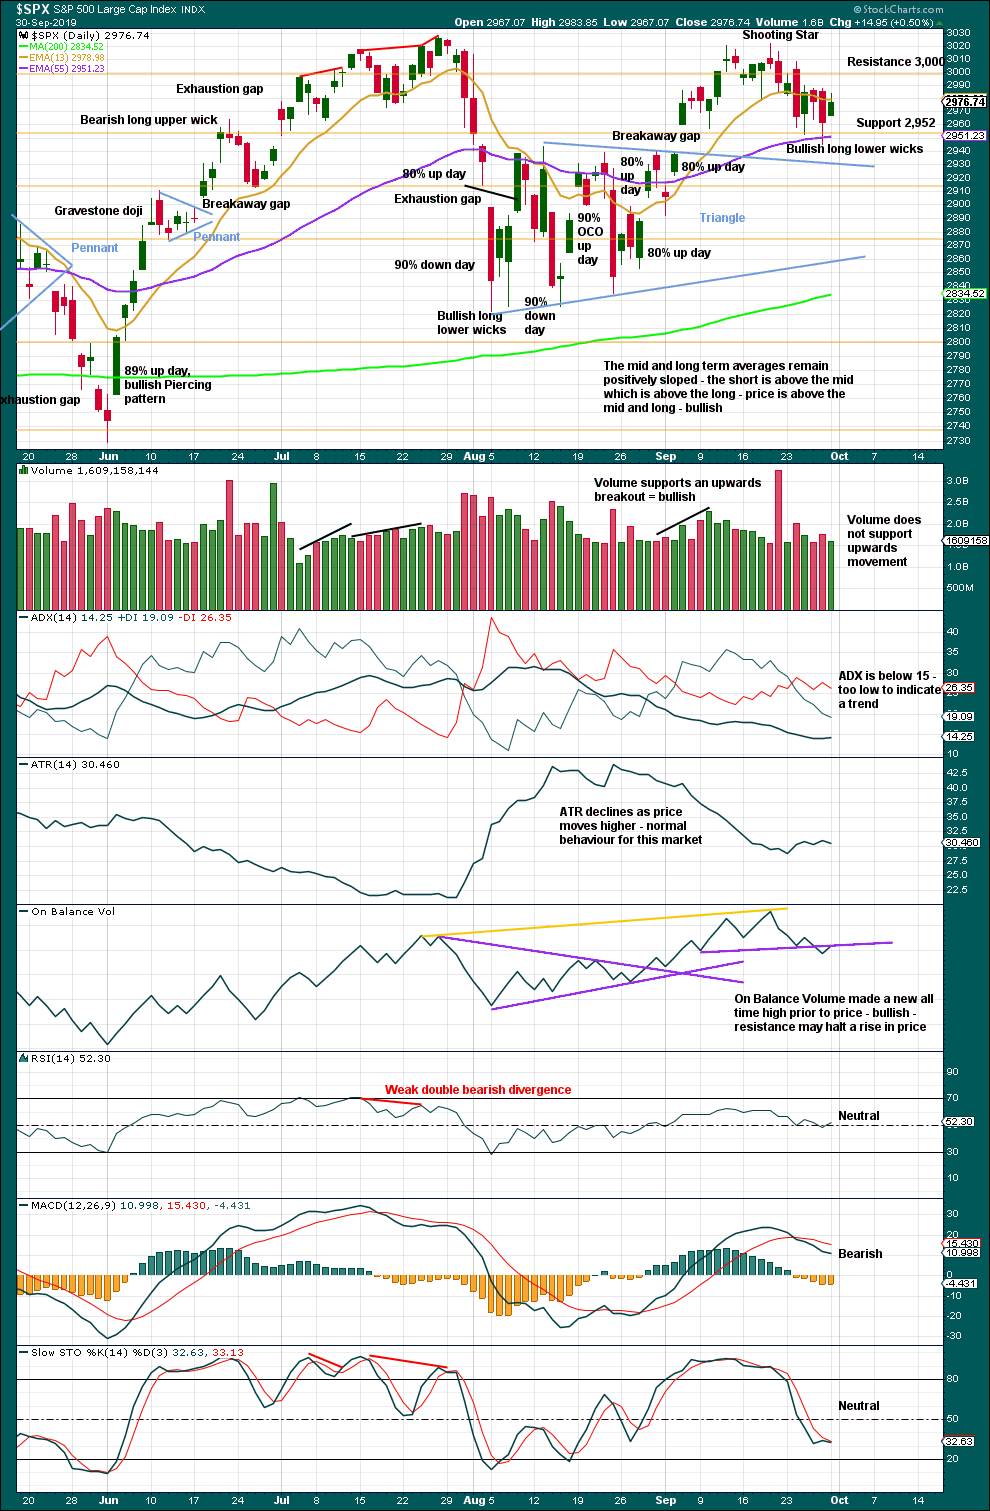
There is now a series of higher highs and higher lows since the 5th of August. Strength in 90% up days and back to back 80% up days off lows indicate the lows may be sustainable.
The target from the triangle is at 3,060, which has still not been met and remains valid.
It looks like price has curved down to complete a typical test of support about the breakaway gap from the triangle. Support is holding.
Declining and light volume on upwards movement has been a feature of this market for years. Some decline in volume today for upwards movement is not of a concern in current market conditions.
If On Balance Volume breaks back above resistance here, then the resistance / support line would need to be redrawn for better technical significance.
BREADTH – AD LINE
WEEKLY CHART
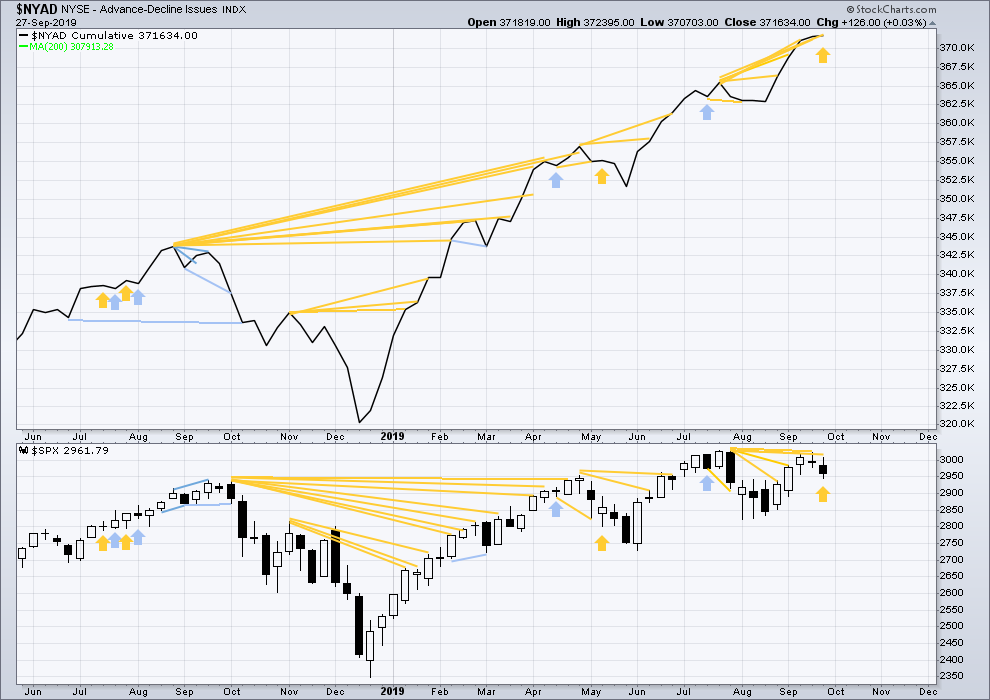
Click chart to enlarge. Chart courtesy of StockCharts.com. So that colour blind members are included, bearish signals
will be noted with blue and bullish signals with yellow.
Bear markets from the Great Depression and onwards have been preceded by an average minimum of 4 months divergence between price and the AD line with only two exceptions in 1946 and 1976. With the AD line making new all time highs again this week, the end of this bull market and the start of a new bear market is very likely a minimum of 4 months away, which is end January 2020.
In all bear markets in the last 90 years there is some positive correlation (0.6022) between the length of bearish divergence and the depth of the following bear market. No to little divergence is correlated with more shallow bear markets. Longer divergence is correlated with deeper bear markets.
If a bear market does develop here, it comes after no bearish divergence. It would therefore more likely be shallow.
Last week price has moved lower, but the AD line has moved slightly higher to make a slight new all time high. This divergence is strongly bullish and supports the main Elliott wave count.
Small caps have made a new swing high above the prior high of the end of July, but mid and large caps have not yet done so. This upwards movement of the last four weeks appears to be led by small caps. Because small caps are usually the first to exhibit deterioration in the later stages of a bull market, some strength in small caps at this stage indicates a healthy bull market with further to run.
DAILY CHART
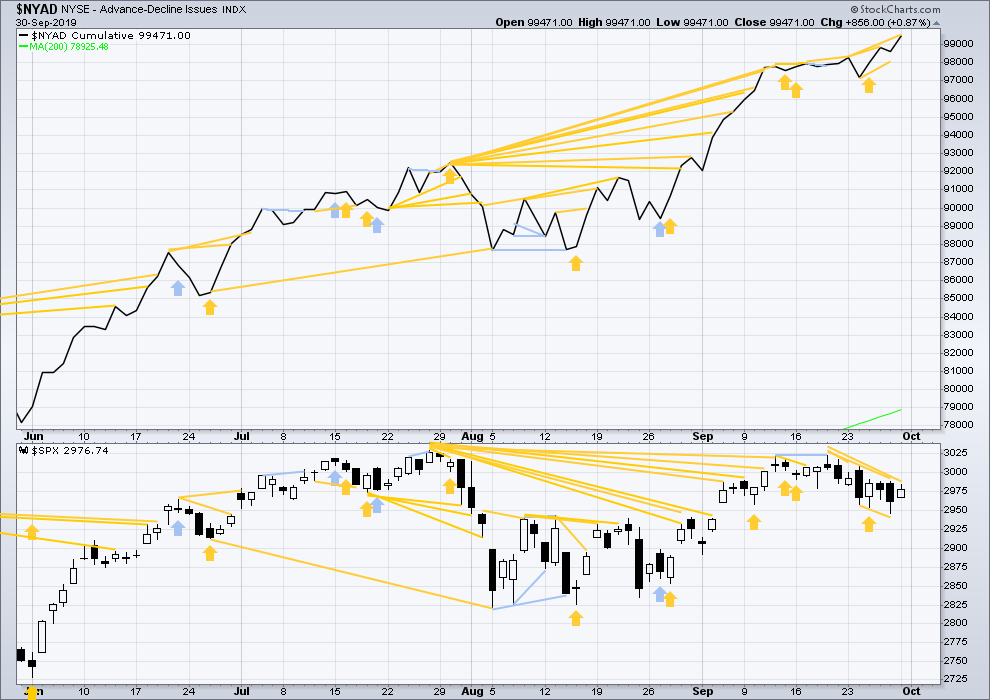
Click chart to enlarge. Chart courtesy of StockCharts.com. So that colour blind members are included, bearish signals
will be noted with blue and bullish signals with yellow.
Breadth should be read as a leading indicator.
Another new all time high today from the AD line is again bullish divergence and supports the main Elliott wave count.
VOLATILITY – INVERTED VIX CHART
WEEKLY CHART
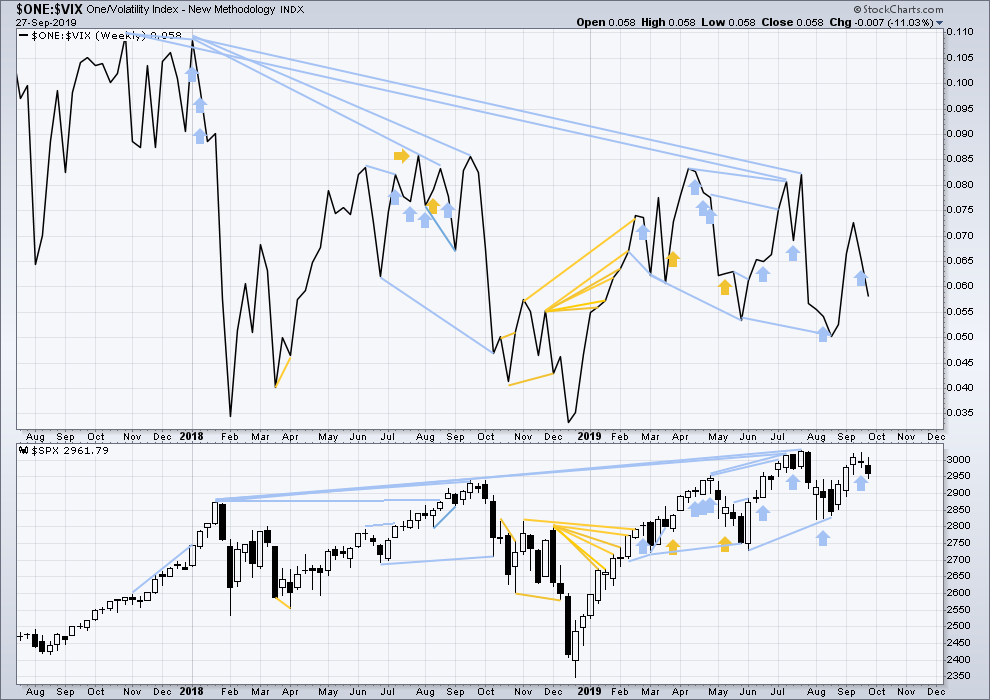
Click chart to enlarge. Chart courtesy of StockCharts.com. So that colour blind members are included, bearish signals
will be noted with blue and bullish signals with yellow.
The all time high for inverted VIX (which is the same as the low for VIX) was on 30th October 2017. There is now nearly one year and eleven months of bearish divergence between price and inverted VIX.
The rise in price is not coming with a normal corresponding decline in VIX; VIX remains elevated. This long-term divergence is bearish and may yet develop further as the bull market matures.
This divergence may be an early warning, a part of the process of a top developing that may take years. It may not be useful in timing a trend change.
Last week both price and inverted VIX moved lower. There is no new short-term divergence.
DAILY CHART
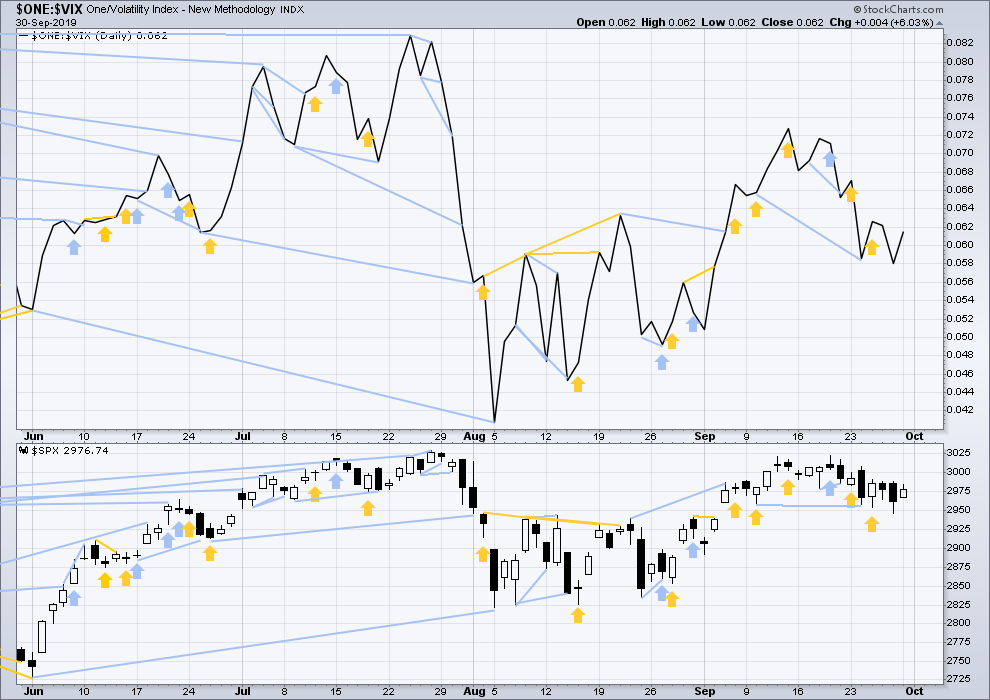
Click chart to enlarge. Chart courtesy of StockCharts.com. So that colour blind members are included, bearish signals
will be noted with blue and bullish signals with yellow.
Both price and inverted VIX have moved higher today. Neither have made new short-term swing highs. There is no new divergence.
DOW THEORY
Dow Theory confirmed a bear market in December 2018. This does not necessarily mean a bear market at Grand Super Cycle degree though; Dow Theory makes no comment on Elliott wave counts. On the 25th of August 2015 Dow Theory also confirmed a bear market. The Elliott wave count sees that as part of cycle wave II. After Dow Theory confirmation of a bear market in August 2015, price went on to make new all time highs and the bull market continued.
DJIA: 23,344.52 – a close on the 19th of December at 23,284.97 confirms a bear market.
DJT: 9,806.79 – price has closed below this point on the 13th of December.
S&P500: 2,532.69 – a close on the 19th of December at 2,506.96 provides support to a bear market conclusion.
Nasdaq: 6,630.67 – a close on the 19th of December at 6,618.86 provides support to a bear market conclusion.
With all the indices having moved higher following a Dow Theory bear market confirmation, Dow Theory would confirm a bull market if the following highs are made:
DJIA: 26,951.81 – a close above this point has been made on the 3rd of July 2019.
DJT: 11,623.58 – to date DJT has failed to confirm an ongoing bull market.
S&P500: 2,940.91 – a close above this point was made on the 29th of April 2019.
Nasdaq: 8,133.30 – a close above this point was made on the 26th of April 2019.
Published @ 07:14 p.m. EST.
—
Careful risk management protects your trading account(s).
Follow my two Golden Rules:
1. Always trade with stops.
2. Risk only 1-5% of equity on any one trade.
—
New updates to this analysis are in bold.
main hourly chart updated:
price is now right at the lower edge of the Elliott channel. for this count, it has to now move up from here.
the invalidation point has not been breached and so this remains the main count
alternate hourly chart updated
the first target is slightly recalculated
for confidence this count needs the main count to be invalidated with a new low by any amount at any time frame below 2,931
Lara, I see your new Invysis watermark on your charts. Do you plan to continue daily SPX analysis? I sure hope so!
So are we now in a downtrend or does the S&P need to break 2931? Are we not going to get new highs this week afterall?
Only my thoughts, but this move down suggests that the alternate count is in play with a target at 2906 or 2916.
or 2880…
my $0.02: definitely no new ATH’s this week!!! Heck I just put on a butterfly in SPY for lower prices middle of next week.
as for trend, i’ve got the SPX monthly up, the weekly neutral, the daily down, the hourly strong down, if that helps! I think the daily chart is most significant right here and now…it’s is definitely “down”. Where it turns is the question. It’s blasted under the 21 ema, and has a look of going to the 61.8% at (surprise) 2900 in short order. That would also wack my lower volatility band. So maybe.
I also think we are looking at the Alternate Daily & Hourly counts. This will be confirmed when we break below 2931 which it looks to me has a very high probability of happening. But we have to wait and we shall see.
it does look like that’s going to happen… but until it happens I have to stay with the main count
right now, price is bouncing up off the lower edge of the channel on the main hourly chart
Yes, that is what I meant by “wait and see”.
I continue to rely upon this reality,
“Bear markets from the Great Depression and onwards have been preceded by an average minimum of 4 months divergence between price and the AD line with only two exceptions in 1946 and 1976. With the AD line making new all time highs again this week, the end of this bull market and the start of a new bear market is very likely a minimum of 4 months away, which is end January 2020.”
RUT here is “nowhere” per my analysis. I.e., “it should go down further”, to the 61.8% (1504) below, or to my next low Fibonacci fitted target (1493). We’ll see.
RUT now close to my next lower fibo fitted tgt, and at a 76-78% zone as well. Will watch carefully for bottom structure here on the hourly/5-min.
…and indications of a turn at the 5 minute.
Finally some bullish price action! Hoo-ray!
Not so fast . .
Well I jinxed that…glad I had B.E. stops on my UWM and UPRO!! Bam!!! What’s the news???? Bad manufacturing #’s only? Wow, powerful reversal.
Yep. That’s why we always trade with stops.
the little $’s floating in my eyes got ripped out…lol!!!! Darn!! “Try try again…” SPX has hit and is stalling a bit on top of the 61.8%. I would not be too suprised if this thing “double reversed” today, and closes back up at the high where it turned down!
I figured it would come down to close Monday’s gap but that was ridiculous. No fair warning at all.
Seriously. I literally walked away to get coffee, came back and saw my stops firing. I “would have” bailed earlier with a little profit if I had been sitting watching…Lesson to self: KNOW WHAT ECONOMIC REPORTS ARE COMING and EXACTLY when they will be released, and be on top of the market to the second at those points in time. (For us intra-day geeks, anyway.) Coffee can wait for a few minutes.
Eureka!