
A pullback or consolidation was expected to continue to a short-term target at 2,975 – 2,977. The low for the session was at 2,957.73.
Summary: This bull market has underlying strength to support it.
The pullback may be over here. There is strong support at 2,938.84. Up volume dominated today, and advances dominated advances / declines. This downwards movement is weak despite a red daily candlestick.
The upwards trend to new all time highs should resume.
Downside risk is at 2,825.51 for the short term.
The next target is 3,120. Classic analysis very strongly supports this main wave count.
A new low below 2,825.51 would indicate a deeper pullback should be underway. Look for strong and final support at the lower edge of the wide channel on weekly and daily charts.
The biggest picture, Grand Super Cycle analysis, is here.
Monthly charts were last published here, with video here. There are two further alternate monthly charts here, with video here.
ELLIOTT WAVE COUNTS
The two weekly Elliott wave counts below will be labelled First and Second. They may be about of even probability. When the fifth wave currently unfolding on weekly charts may be complete, then these two wave counts will diverge on the severity of the expected following bear market. To see an illustration of this future divergence monthly charts should be viewed.
FIRST WAVE COUNT
WEEKLY CHART
Click chart to enlarge.
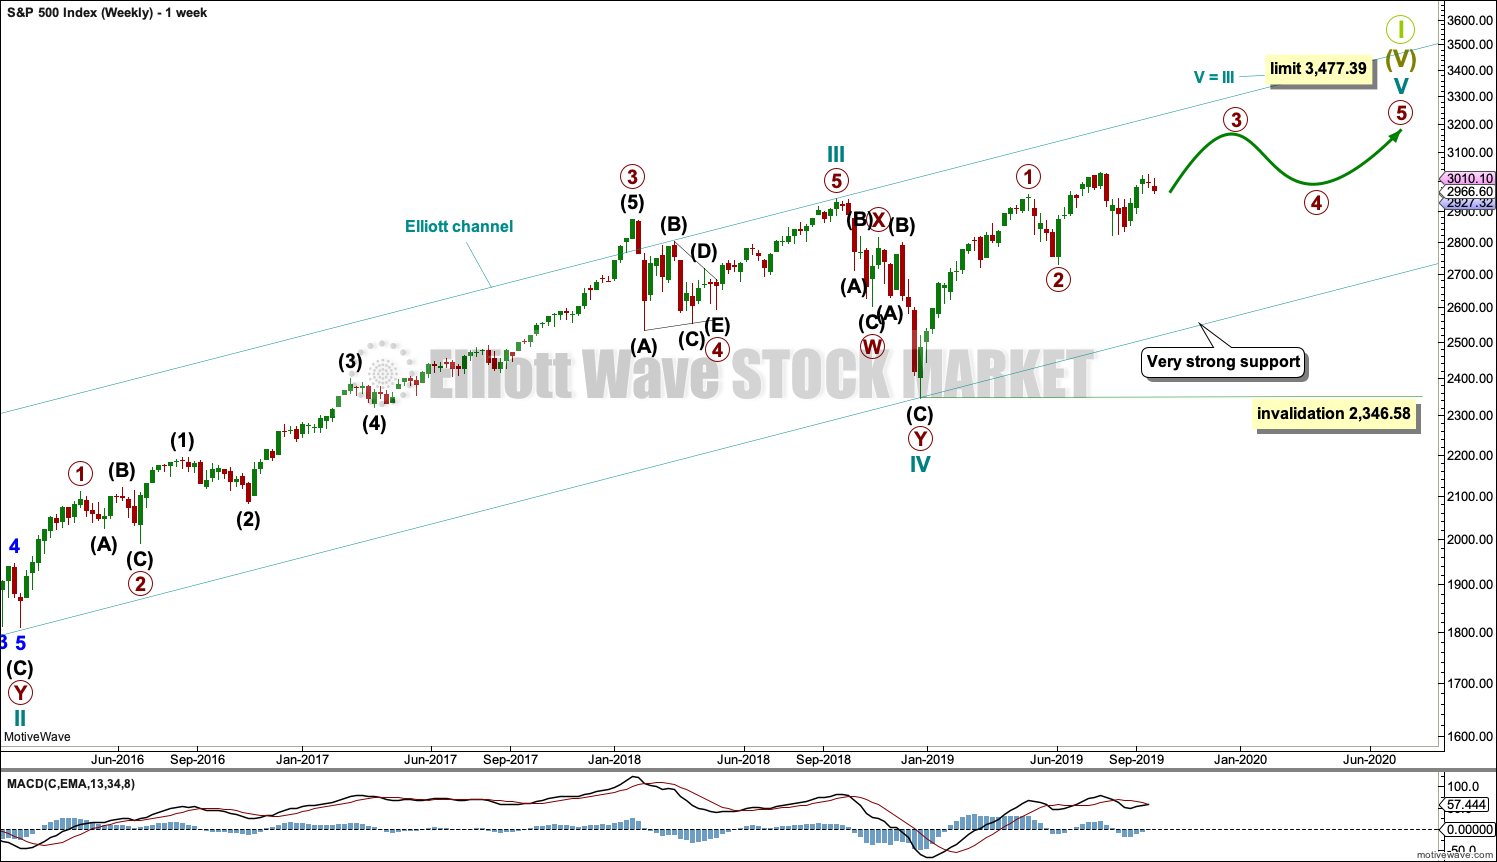
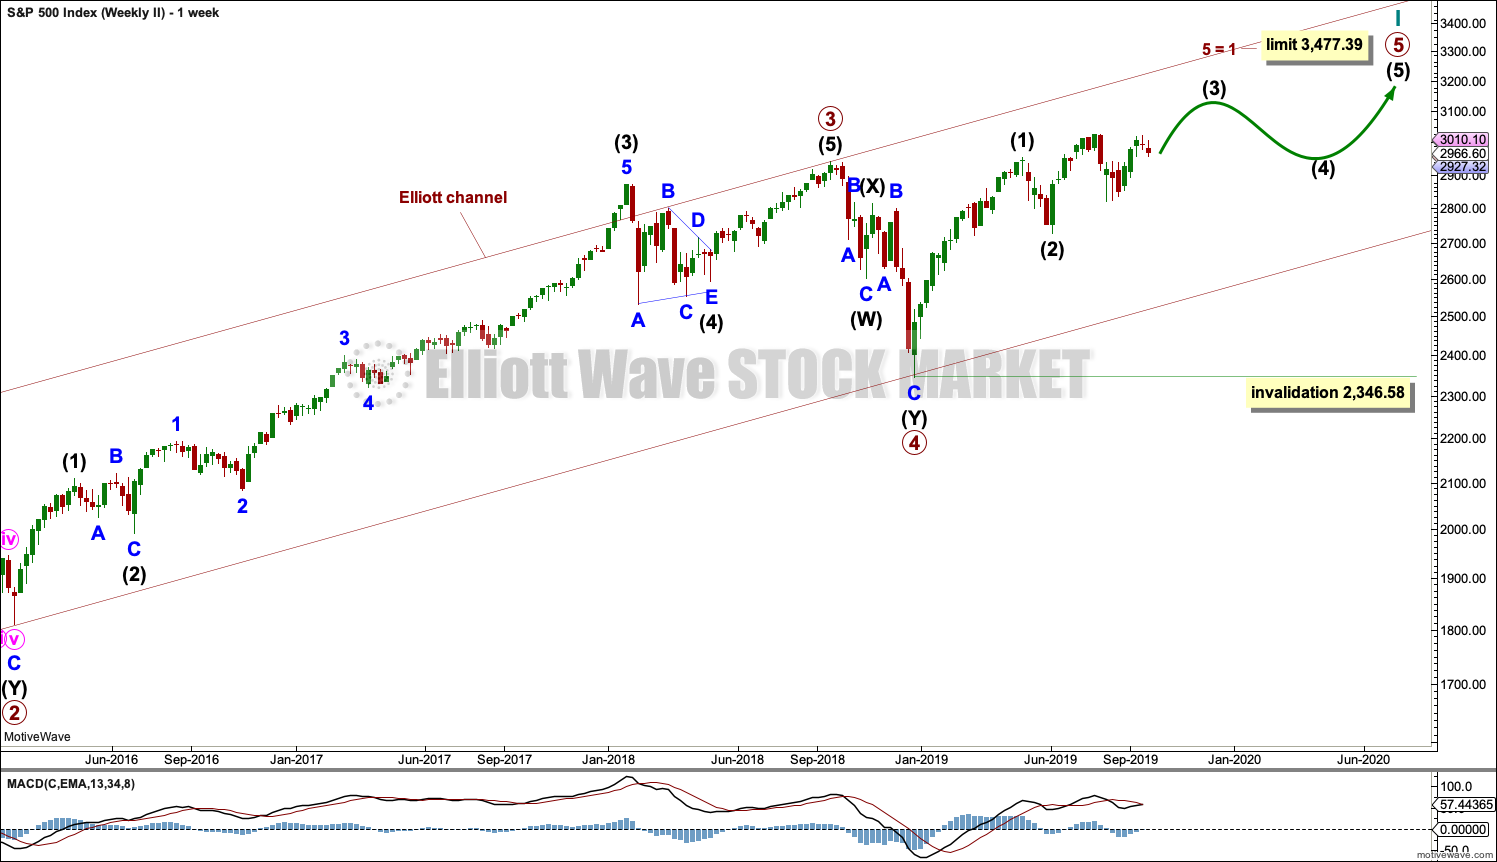
The basic Elliott wave structure consists of a five wave structure up followed by a three wave structure down (for a bull market). This wave count sees the bull market beginning in March 2009 as an incomplete five wave impulse and now within the last fifth wave, which is labelled cycle wave V. This impulse is best viewed on monthly charts. The weekly chart focusses on the end of it.
Elliott wave is fractal. This fifth wave labelled cycle wave V may end a larger fifth wave labelled Super Cycle wave (V), which may end a larger first wave labelled Grand Super Cycle wave I.
The teal Elliott channel is drawn using Elliott’s first technique about the impulse of Super Cycle wave (V). Draw the first trend line from the end of cycle wave I (off to the left of the chart, the weekly candlestick beginning 30th November 2014) to the end of cycle wave III, then place a parallel copy on the end of cycle wave II. This channel perfectly shows where cycle wave IV ended at support. The strongest portion of cycle wave III, the end of primary wave 3, overshoots the upper edge of the channel. This is a typical look for a third wave and suggests the channel is drawn correctly and the way the impulse is counted is correct.
Within Super Cycle wave (V), cycle wave III is shorter than cycle wave I. A core Elliott wave rule states that a third wave may never be the shortest. For this rule to be met in this instance, cycle wave V may not be longer in length than cycle wave III. This limit is at 3,477.39.
Cycle wave V may subdivide either as an impulse or an ending diagonal. Impulses are much more common. This main wave count expects that cycle wave V may be unfolding as an impulse.
The daily charts below will focus on all of cycle wave V.
In historic analysis, two further monthly charts have been published that do not have a limit to upwards movement and are more bullish than this wave count. Members are encouraged to consider those possibilities (links below summary) alongside the wave counts presented on a daily and weekly basis.
MAIN DAILY CHART
Click chart to enlarge.
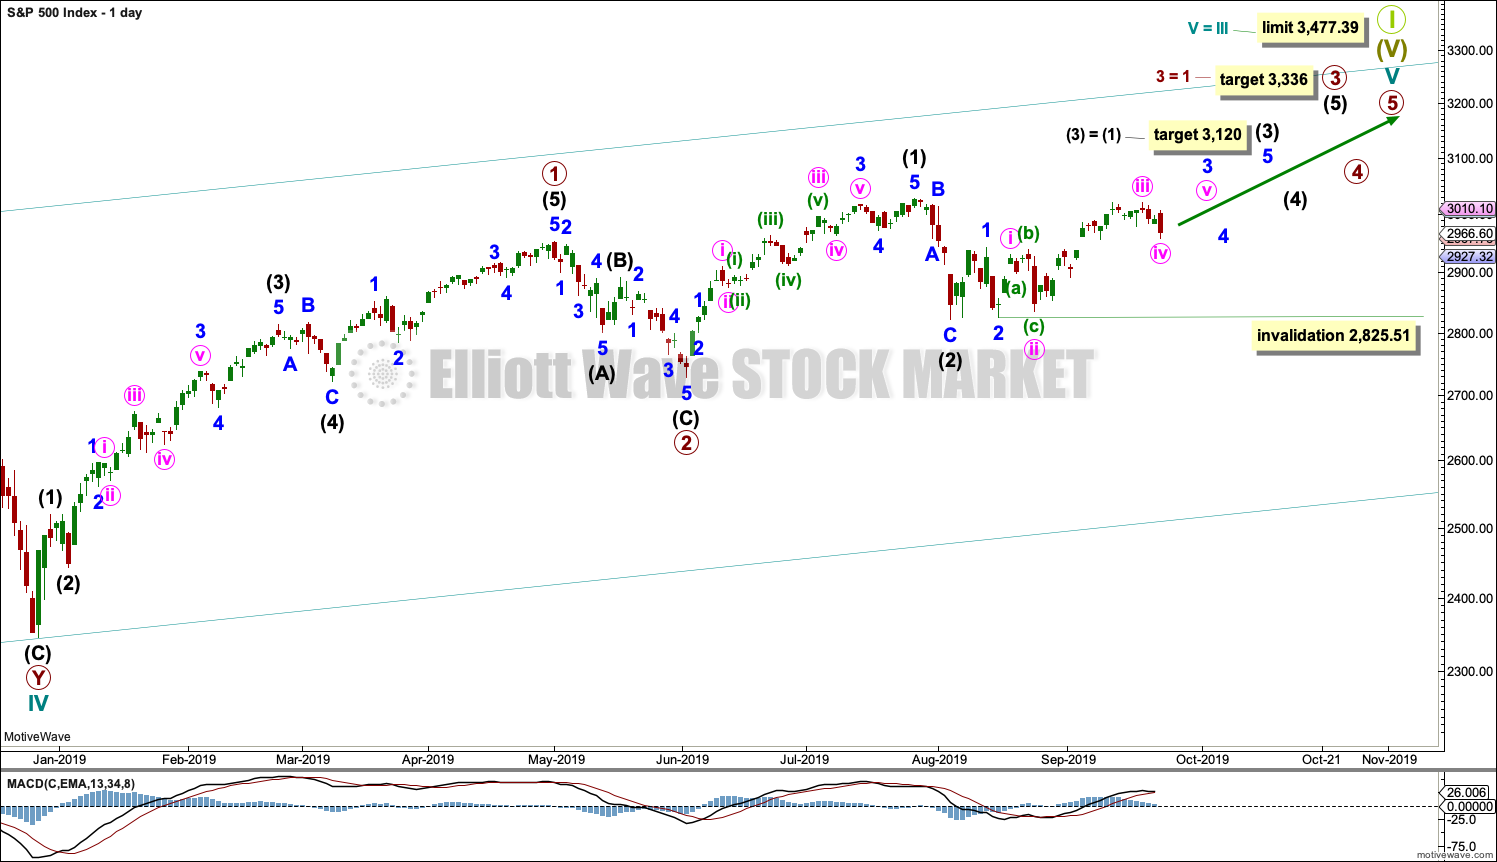
Cycle wave V is seen as an impulse for this wave count.
Within cycle wave V, primary waves 1 and 2 may be complete. Primary wave 3 may have begun.
Primary wave 3 may only subdivide as an impulse. Within primary wave 3, intermediate waves (1) and (2) may be complete.
Intermediate wave (3) may have begun. Intermediate wave (3) may only subdivide as an impulse.
Within intermediate wave (3), minor waves 1 and 2 may be complete. Within minor wave 3, minute waves i through to iii may now be complete.
If the degree of labelling within minor wave 3 is moved down one degree, then it may be only minute wave i within minor wave 3 which is nearing an end. Minute wave ii may not move beyond the start of minute wave i below 2,825.51.
All of primary wave 3, intermediate wave (3), minor wave 3 and minute wave iii may only subdivide as impulses.
Intermediate wave (3) must move far enough above the end of intermediate wave (1) to then allow intermediate wave (4) to unfold and remain above intermediate wave (1) price territory.
HOURLY CHART
Click chart to enlarge.
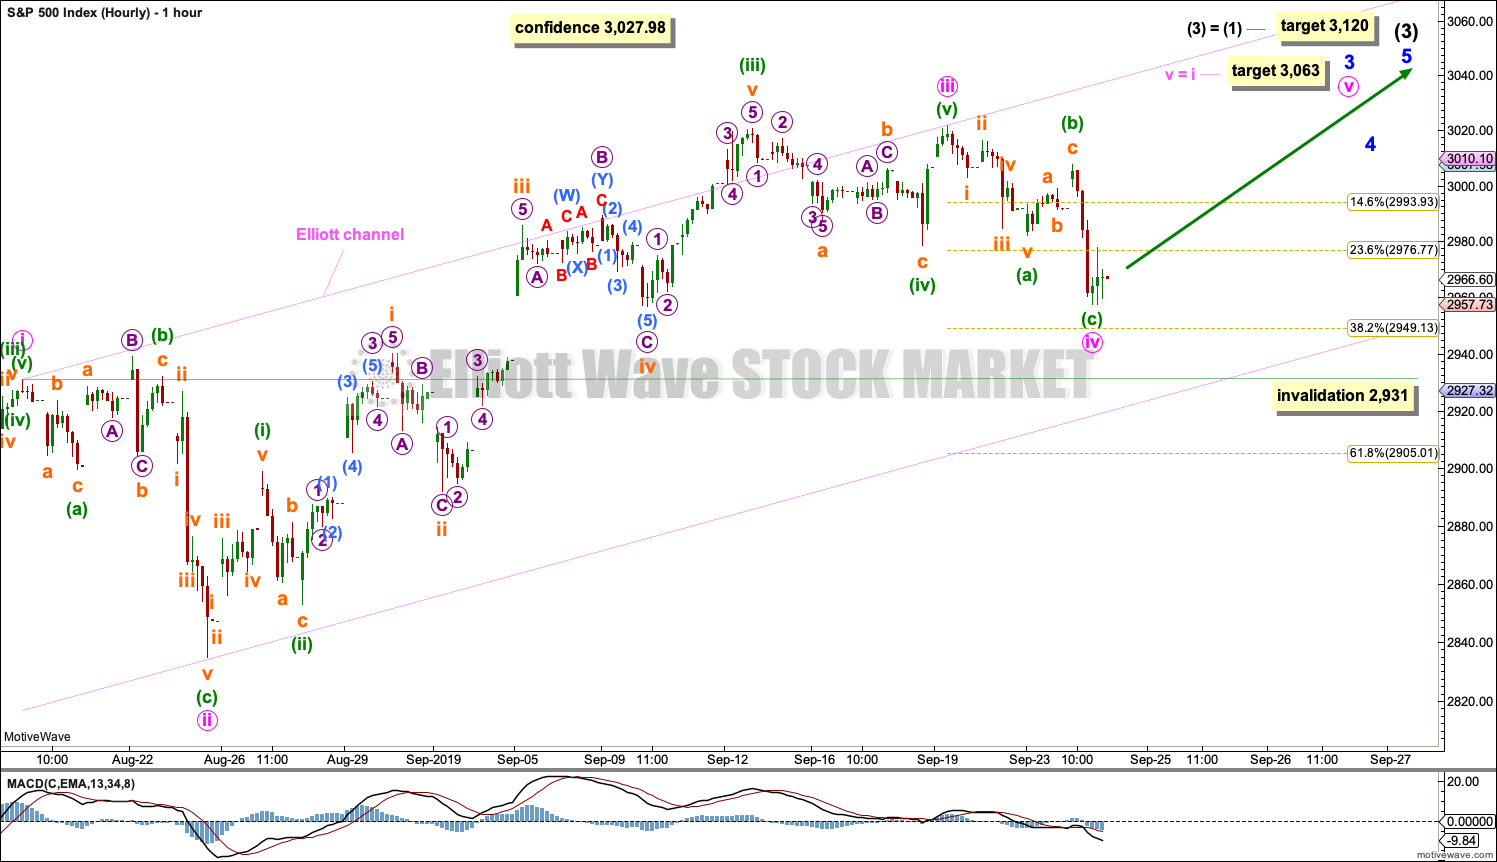
The middle of a third wave may have passed. The structure now looks complete at hourly and daily time frames.
Minute wave iv may now be a complete zigzag to exhibit alternation with minute wave ii. If minute wave iv is over here as a relatively shallow zigzag, it would exhibit good proportion and perfect alternation with the deeper flat correction of minute wave ii.
Draw the Elliott channel from the ends of minute waves i to iii, then place a parallel copy on the end of minute wave ii. This channel perfectly contains all of minor wave 3 so far, with the exception of an overthrow for the end of the middle of the third wave. This channel looks correct, so it looks likely that the way the impulse is labelled is now correct.
If it continues further, then minute wave iv may not move into minute wave i price territory below 2,931.
It is also still possible to move the degree of labelling within minor wave 3 all down one degree. The impulse labelled here on the hourly chart may only be minute wave i of minor wave 3. The invalidation point for that idea would be back at the start of minor wave 3 at 2,825.51.
ALTERNATE DAILY CHART
Click chart to enlarge.
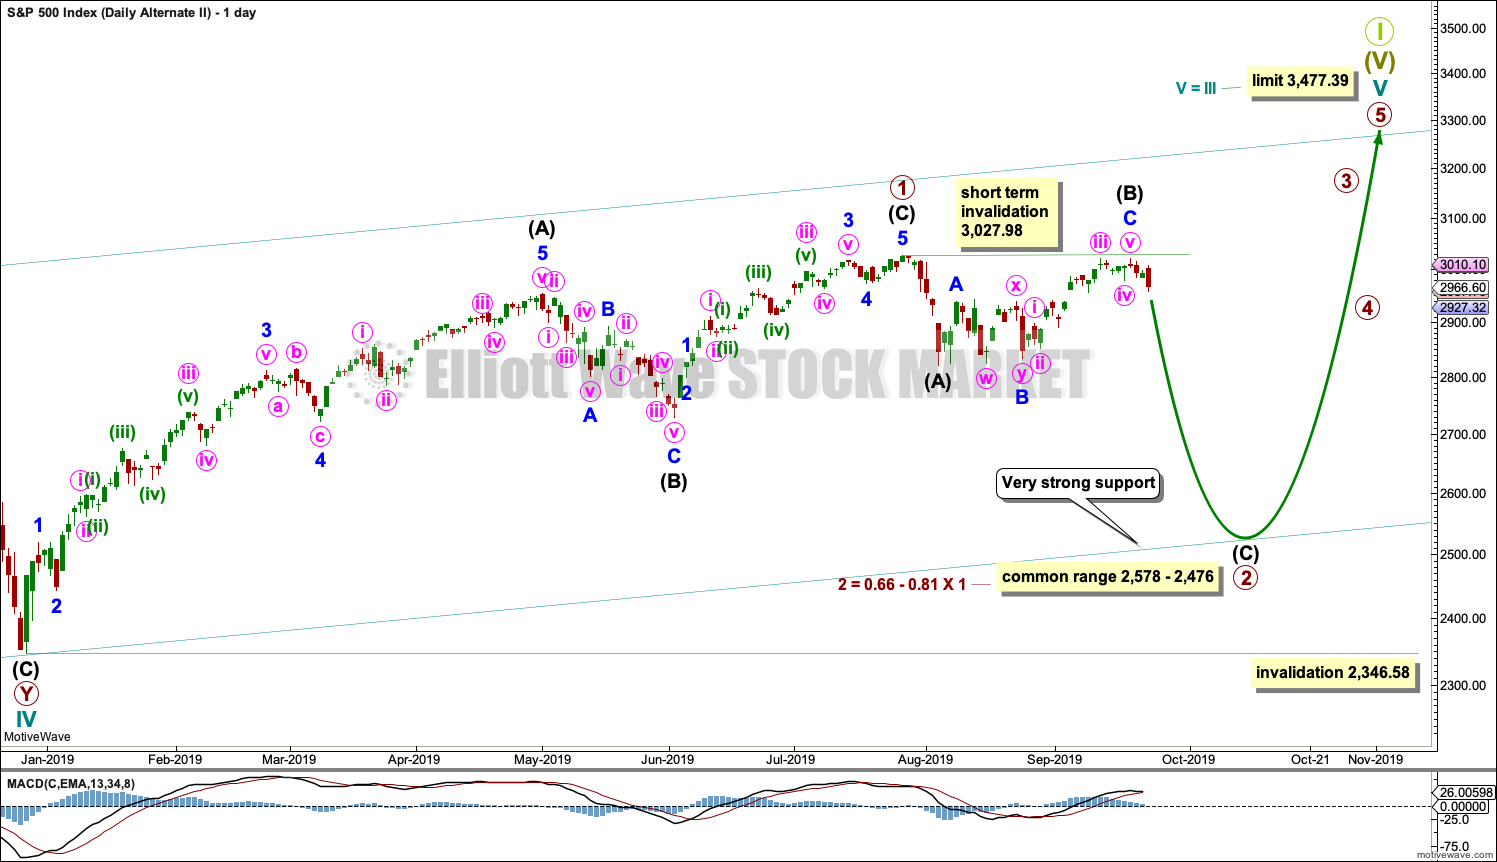
This alternate wave count has been published before. It will be published again as a reminder that alternates do currently exist
This alternate wave count is still judged to have a low probability because it does not currently have support from classic technical analysis.
The main wave count expects cycle wave V to unfold as the more common impulse. This alternate wave count looks at the less likely possibility that cycle wave V may unfold as an ending diagonal.
All sub-waves within ending diagonals must subdivide as zigzags. The second and fourth waves of diagonals are commonly very deep, correcting to between 0.66 and 0.81 the prior wave.
Within the zigzag of primary wave 2, intermediate wave (B) may not move beyond the start of intermediate wave (A) above 3,027.98.
At this stage, a new low below 2,825.51 would be required for any confidence in this wave count.
SECOND WAVE COUNT
WEEKLY CHART
Click chart to enlarge.
This weekly chart is almost identical to the first weekly chart, with the sole exception being the degree of labelling.
This weekly chart moves the degree of labelling for the impulse beginning in March 2009 all down one degree. This difference is best viewed on monthly charts.
The impulse is still viewed as nearing an end; a fifth wave is still seen as needing to complete higher. This wave count labels it primary wave 5.
TECHNICAL ANALYSIS
WEEKLY CHART
Click chart to enlarge. Chart courtesy of StockCharts.com.
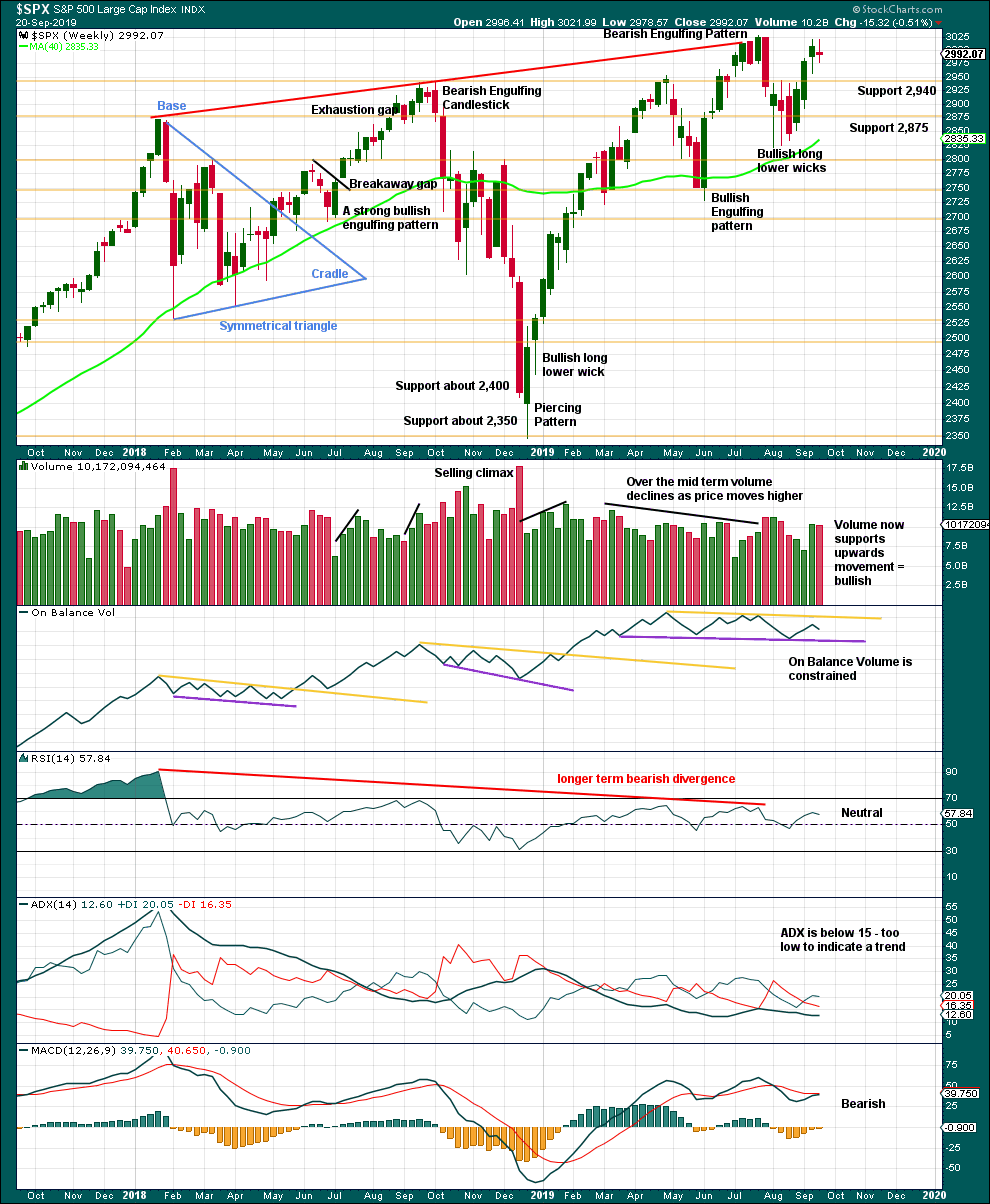
Last week is an upwards week with a slightly higher high and a higher low, but the candlestick has closed red and the balance of volume is down. At this stage, last week looks like a small pause within an ongoing upwards trend. There is no candlestick reversal pattern.
DAILY CHART
Click chart to enlarge. Chart courtesy of StockCharts.com.
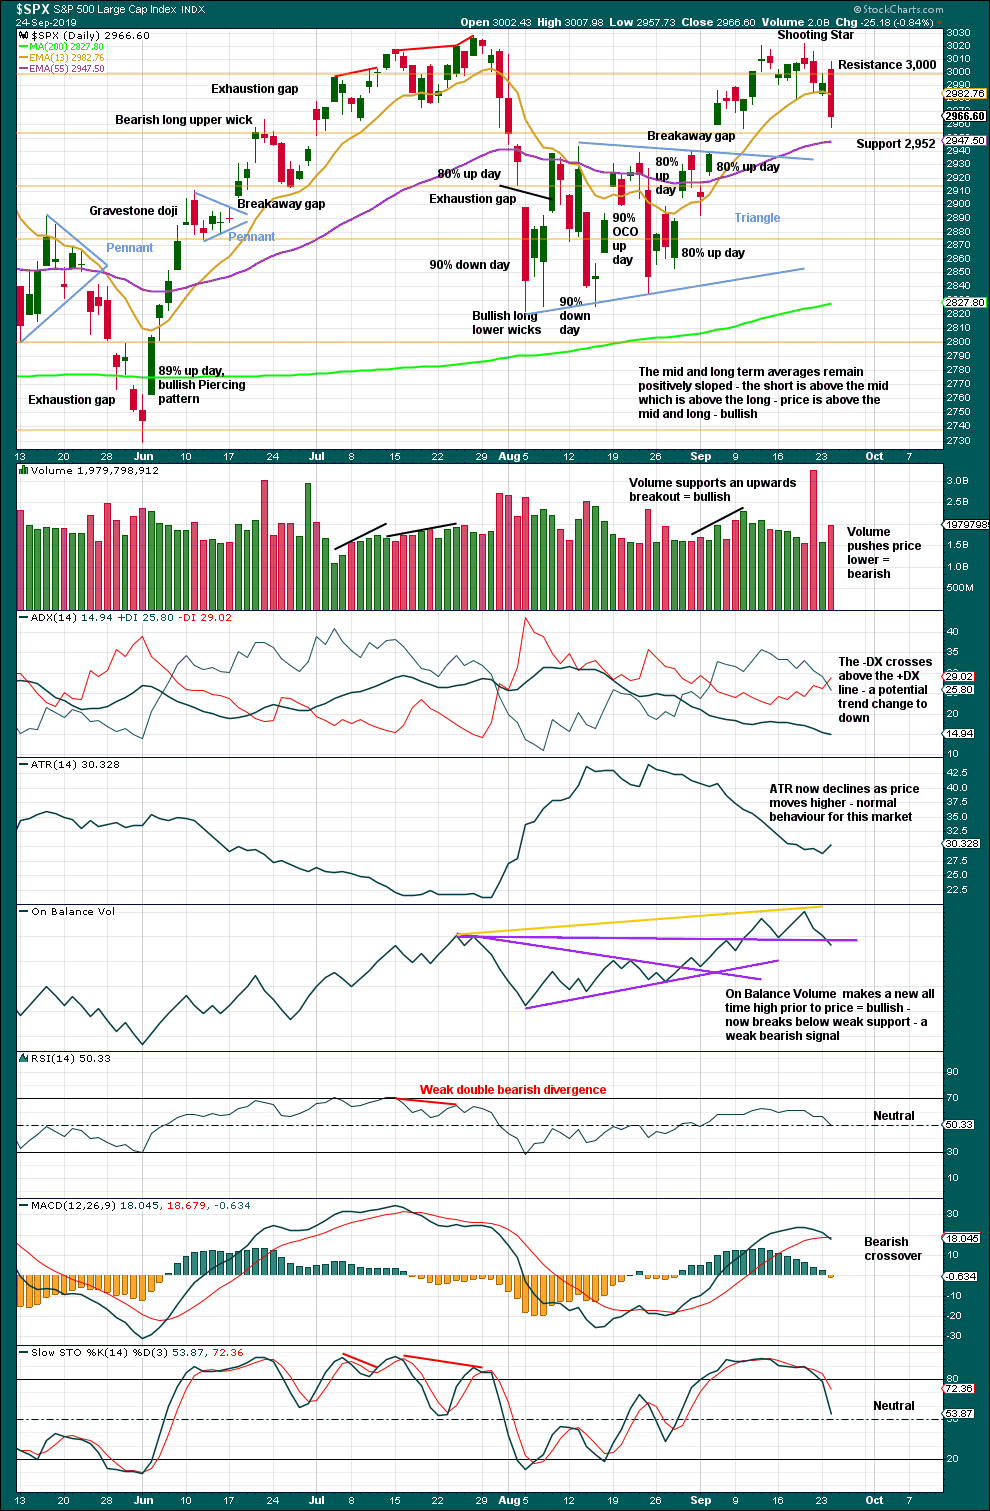
There is now a series of higher highs and higher lows since the 5th of August. Strength in 90% up days and back to back 80% up days off lows indicate the lows may be sustainable.
The target from the triangle is at 3,060, which has still not been met and remains valid.
Downwards movement here may possibly be a retest of the breakaway gap, which should offer support at 2,938.84.
The signal today from On Balance Volume is fairly weak. The line breached has little technical significance as it has already been breached.
Today Lowry’s data shows that up volume dominated up / down volume and advances dominated advances / declines. This session lacks strength in downwards movement despite a strong red daily candlestick and an increase in volume.
BREADTH – AD LINE
WEEKLY CHART
Click chart to enlarge. Chart courtesy of StockCharts.com. So that colour blind members are included, bearish signals
will be noted with blue and bullish signals with yellow.
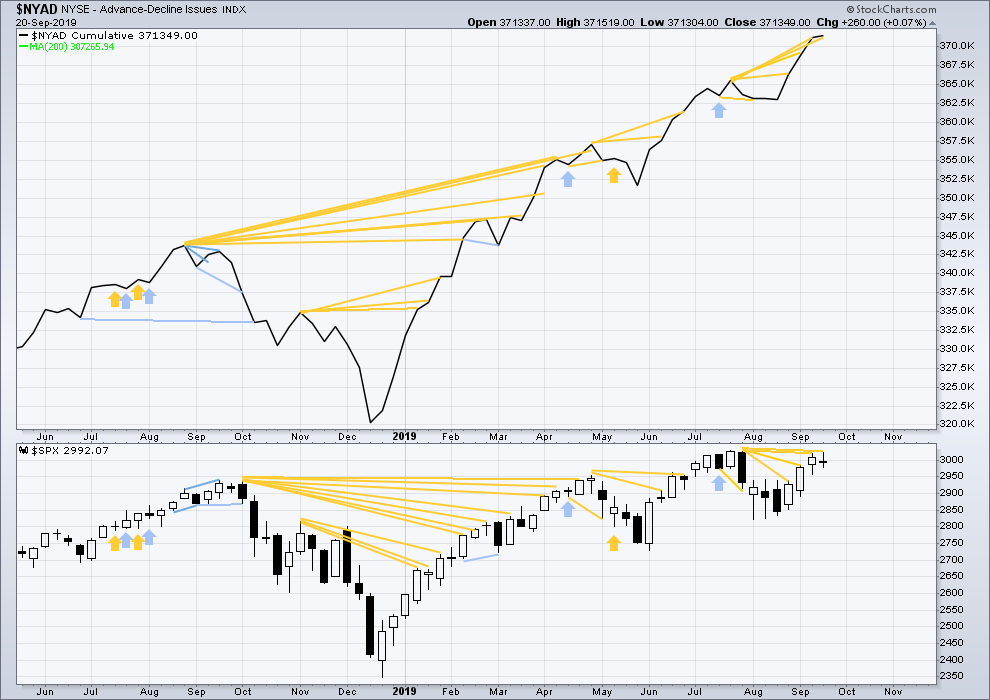
Bear markets from the Great Depression and onwards have been preceded by an average minimum of 4 months divergence between price and the AD line with only two exceptions in 1946 and 1976. With the AD line making new all time highs again this week, the end of this bull market and the start of a new bear market is very likely a minimum of 4 months away, which is end January 2020.
In all bear markets in the last 90 years there is some positive correlation (0.6022) between the length of bearish divergence and the depth of the following bear market. No to little divergence is correlated with more shallow bear markets. Longer divergence is correlated with deeper bear markets.
If a bear market does develop here, it comes after no bearish divergence. It would therefore more likely be shallow.
The AD line makes another new all time high. This is a very bullish signal and very strongly supports the Elliott wave count.
Small caps have made a new swing high above the prior high of the end of July, but mid and large caps have not yet done so. This upwards movement of the last four weeks appears to be led by small caps. Because small caps are usually the first to exhibit deterioration in the later stages of a bull market, some strength in small caps at this stage indicates a healthy bull market with further to run.
DAILY CHART
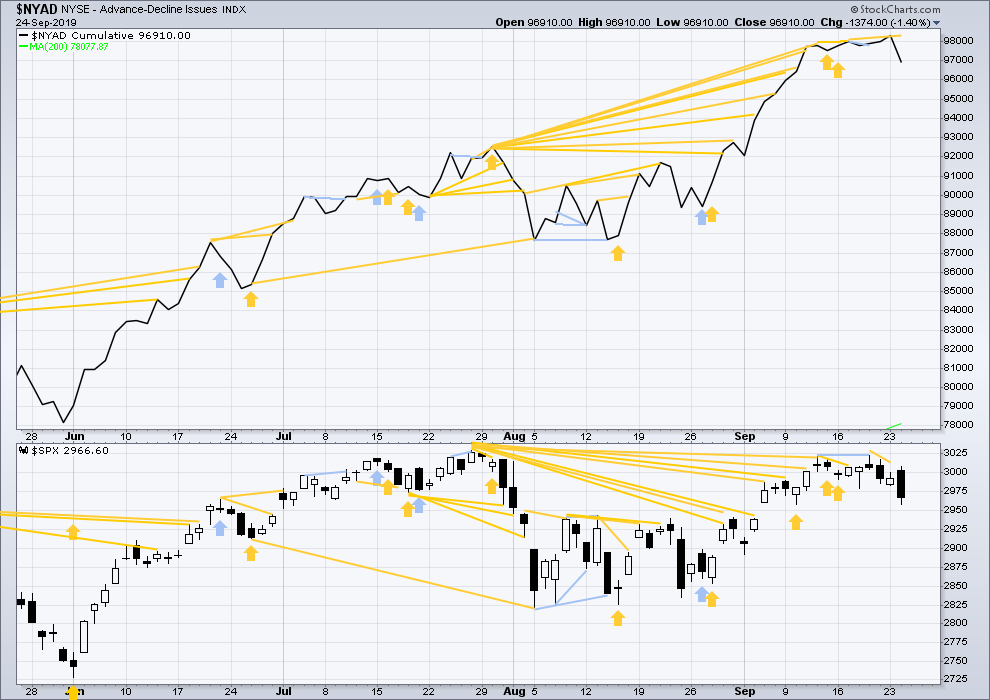
Click chart to enlarge. Chart courtesy of StockCharts.com. So that colour blind members are included, bearish signals
will be noted with blue and bullish signals with yellow.
Breadth should be read as a leading indicator.
Both price and the AD line have moved lower today. Neither have made new short-term swing lows. There is no short-term divergence.
VOLATILITY – INVERTED VIX CHART
WEEKLY CHART
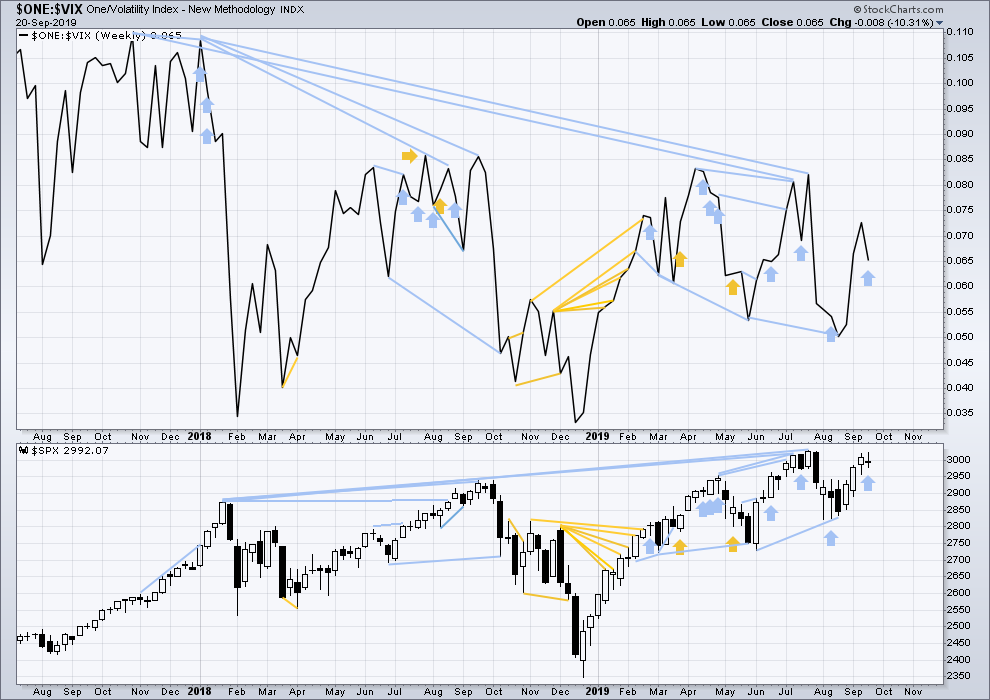
Click chart to enlarge. Chart courtesy of StockCharts.com. So that colour blind members are included, bearish signals
will be noted with blue and bullish signals with yellow.
The all time high for inverted VIX (which is the same as the low for VIX) was on 30th October 2017. There is now nearly one year and ten months of bearish divergence between price and inverted VIX.
The rise in price is not coming with a normal corresponding decline in VIX; VIX remains elevated. This long-term divergence is bearish and may yet develop further as the bull market matures.
This divergence may be an early warning, a part of the process of a top developing that may take years. It may not be useful in timing a trend change.
Last week price has moved slightly higher, but inverted VIX has moved strongly lower. Upwards movement in price last week does not come with a normal corresponding decline in VIX. This divergence is bearish for the short term.
DAILY CHART
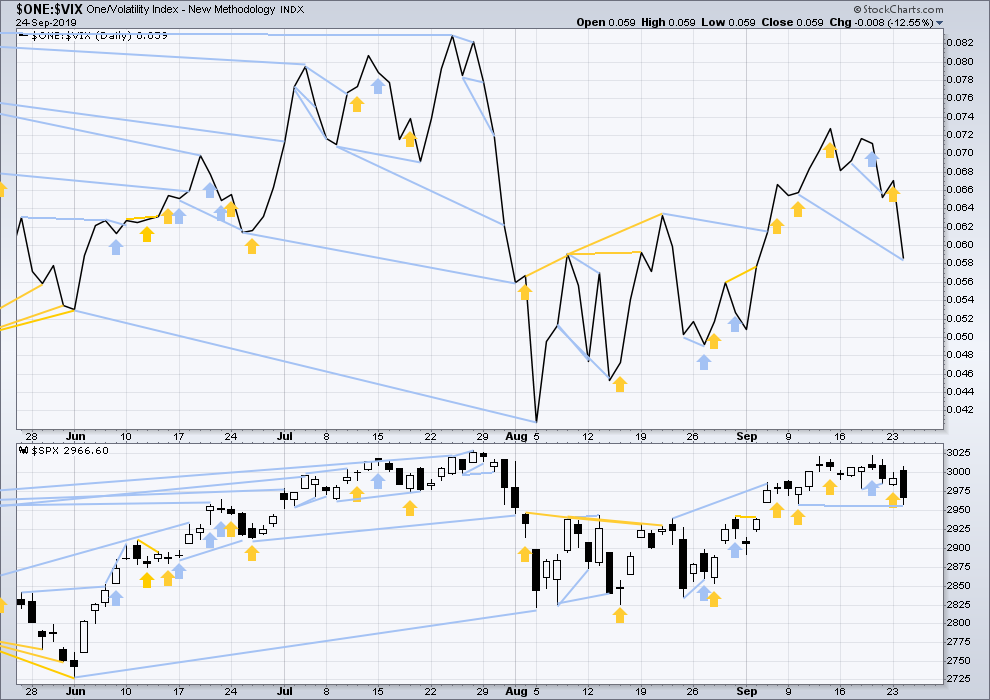
Click chart to enlarge. Chart courtesy of StockCharts.com. So that colour blind members are included, bearish signals
will be noted with blue and bullish signals with yellow.
Both price and inverted VIX have moved lower today. Inverted VIX has made a new short-term swing low below the prior low of the 11th of September, but price has not by a small margin. This divergence is bearish for the short term, but it shall be given no weight in this analysis as it is not confirmed by the AD line.
DOW THEORY
Dow Theory confirmed a bear market in December 2018. This does not necessarily mean a bear market at Grand Super Cycle degree though; Dow Theory makes no comment on Elliott wave counts. On the 25th of August 2015 Dow Theory also confirmed a bear market. The Elliott wave count sees that as part of cycle wave II. After Dow Theory confirmation of a bear market in August 2015, price went on to make new all time highs and the bull market continued.
DJIA: 23,344.52 – a close on the 19th of December at 23,284.97 confirms a bear market.
DJT: 9,806.79 – price has closed below this point on the 13th of December.
S&P500: 2,532.69 – a close on the 19th of December at 2,506.96 provides support to a bear market conclusion.
Nasdaq: 6,630.67 – a close on the 19th of December at 6,618.86 provides support to a bear market conclusion.
With all the indices having moved higher following a Dow Theory bear market confirmation, Dow Theory would confirm a bull market if the following highs are made:
DJIA: 26,951.81 – a close above this point has been made on the 3rd of July 2019.
DJT: 11,623.58 – to date DJT has failed to confirm an ongoing bull market.
S&P500: 2,940.91 – a close above this point was made on the 29th of April 2019.
Nasdaq: 8,133.30 – a close above this point was made on the 26th of April 2019.
Published @ 06:24 p.m. EST.
—
Careful risk management protects your trading account(s).
Follow my two Golden Rules:
1. Always trade with stops.
2. Risk only 1-5% of equity on any one trade.
—
New updates to this analysis are in bold.
I sold a VIX call spread for Oct 16 out of the money today, 13.5 and 14.5 strikes. I like this play a lot. Much wider price area for a win than a butterfly, and 1/2 the options required. Gets me on the right side of premium decay in the VIX options themselves. And it’s a high payoff structure, almost 3-1 max win/max loss. Check it out. Obviously I’m leaning on our bullish posture in the market over the next several weeks, and leverage the VIX spike from this iv wave just completed.
Interest rates driving all the asset classes methinks. Big move up in TNX today. Fascinating to grok the big picture. Sure looks massively bullish to me. Triple bottom on the quarterly (top left), current month with a nice lower tail. Bonds down gold down equities up. Gold may not follow that too long given Euro bond rates (net negative), but this is some gas for the US equities market. Financials might rip.
Hourly chart updated:
Minute iv now fits as a double zigzag. Within it, minuette (x) fits very well as an expanded flat. Minute iv looks like it’s ended very close to the 0.382 Fibonacci Ratio.
Minute iv may now be over in 35 hours, compared to minute ii over in 37 hours, this proportion is almost perfect.
RUT’s move down has pretty good Fibonacci fit with the low as the terminal price (gray ellipses). And there’s decent bottom structure now at this hourly timeframe, and the neckline of that bottom is about to be broken. Being rather long, I must admit to having bull (not beer) eyes…
The heavy black lines project and show the level of bullish symmetry, the level which if broken will establish a larger up swing than any other through the sell off.
RUT approaching large resistance 1553-1555. The bullish symmetry, a 38.2%, and prior pivots, bam bam bam. If it shoves through all that quickly, it’s a very bullish indicator IMO. A breather under that level is very likely. ALong with SPX resting under the approaching 61.8.
Sept 10 low relative to low of Sept 24 held in SPX but not in ES – a bullish divergence.
If it holds, it’s normally a bullish sign as per the lows of 23 and 26 Aug in both markets.
I nailed the price of the bottom (assuming it turns out to be the bottom…), but missed the timing by a lot. It’s hit exactly at my largest Fibo fitted projection, which was right at a 161.% extension. Gotta love market structure.
Would ya look at that!!!
Fashionably late