
For the short term, a pullback or consolidation was expected to begin on Friday. This is exactly what has happened.
Summary: For the short term, a little weakness in the last session suggests a pullback or consolidation may unfold here. The target for support is about 2,981. Thereafter, the upwards trend may resume to new all time highs.
The next target is 3,120. Classic analysis very strongly supports this main wave count.
The biggest picture, Grand Super Cycle analysis, is here.
Monthly charts were last published here, with video here. There are two further alternate monthly charts here, with video here.
ELLIOTT WAVE COUNTS
The two weekly Elliott wave counts below will be labelled First and Second. They may be about of even probability. When the fifth wave currently unfolding on weekly charts may be complete, then these two wave counts will diverge on the severity of the expected following bear market. To see an illustration of this future divergence monthly charts should be viewed.
FIRST WAVE COUNT
WEEKLY CHART
Click chart to enlarge.
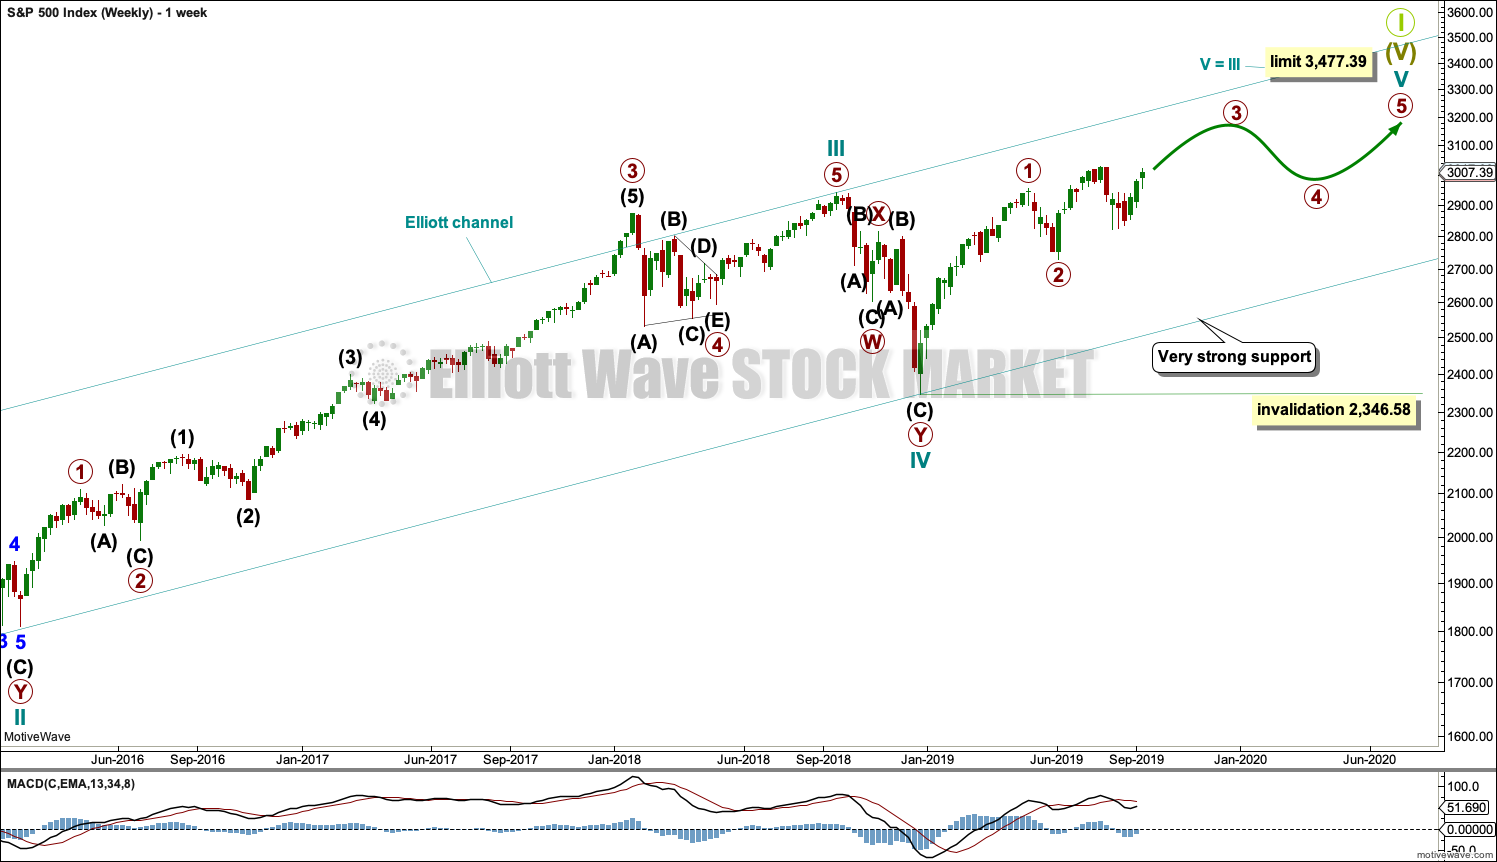
The basic Elliott wave structure consists of a five wave structure up followed by a three wave structure down (for a bull market). This wave count sees the bull market beginning in March 2009 as an incomplete five wave impulse and now within the last fifth wave, which is labelled cycle wave V. This impulse is best viewed on monthly charts. The weekly chart focusses on the end of it.
Elliott wave is fractal. This fifth wave labelled cycle wave V may end a larger fifth wave labelled Super Cycle wave (V), which may end a larger first wave labelled Grand Super Cycle wave I.
The teal Elliott channel is drawn using Elliott’s first technique about the impulse of Super Cycle wave (V). Draw the first trend line from the end of cycle wave I (off to the left of the chart, the weekly candlestick beginning 30th November 2014) to the end of cycle wave III, then place a parallel copy on the end of cycle wave II. This channel perfectly shows where cycle wave IV ended at support. The strongest portion of cycle wave III, the end of primary wave 3, overshoots the upper edge of the channel. This is a typical look for a third wave and suggests the channel is drawn correctly and the way the impulse is counted is correct.
Within Super Cycle wave (V), cycle wave III is shorter than cycle wave I. A core Elliott wave rule states that a third wave may never be the shortest. For this rule to be met in this instance, cycle wave V may not be longer in length than cycle wave III. This limit is at 3,477.39.
Cycle wave V may subdivide either as an impulse or an ending diagonal. Impulses are much more common. This main wave count expects that cycle wave V may be unfolding as an impulse.
The daily chart below will now focus on all movement from the end of primary wave 2.
In historic analysis, two further monthly charts have been published that do not have a limit to upwards movement and are more bullish than this wave count. Members are encouraged to consider those possibilities (links below summary) alongside the wave counts presented on a daily and weekly basis.
DAILY CHART
Click chart to enlarge.
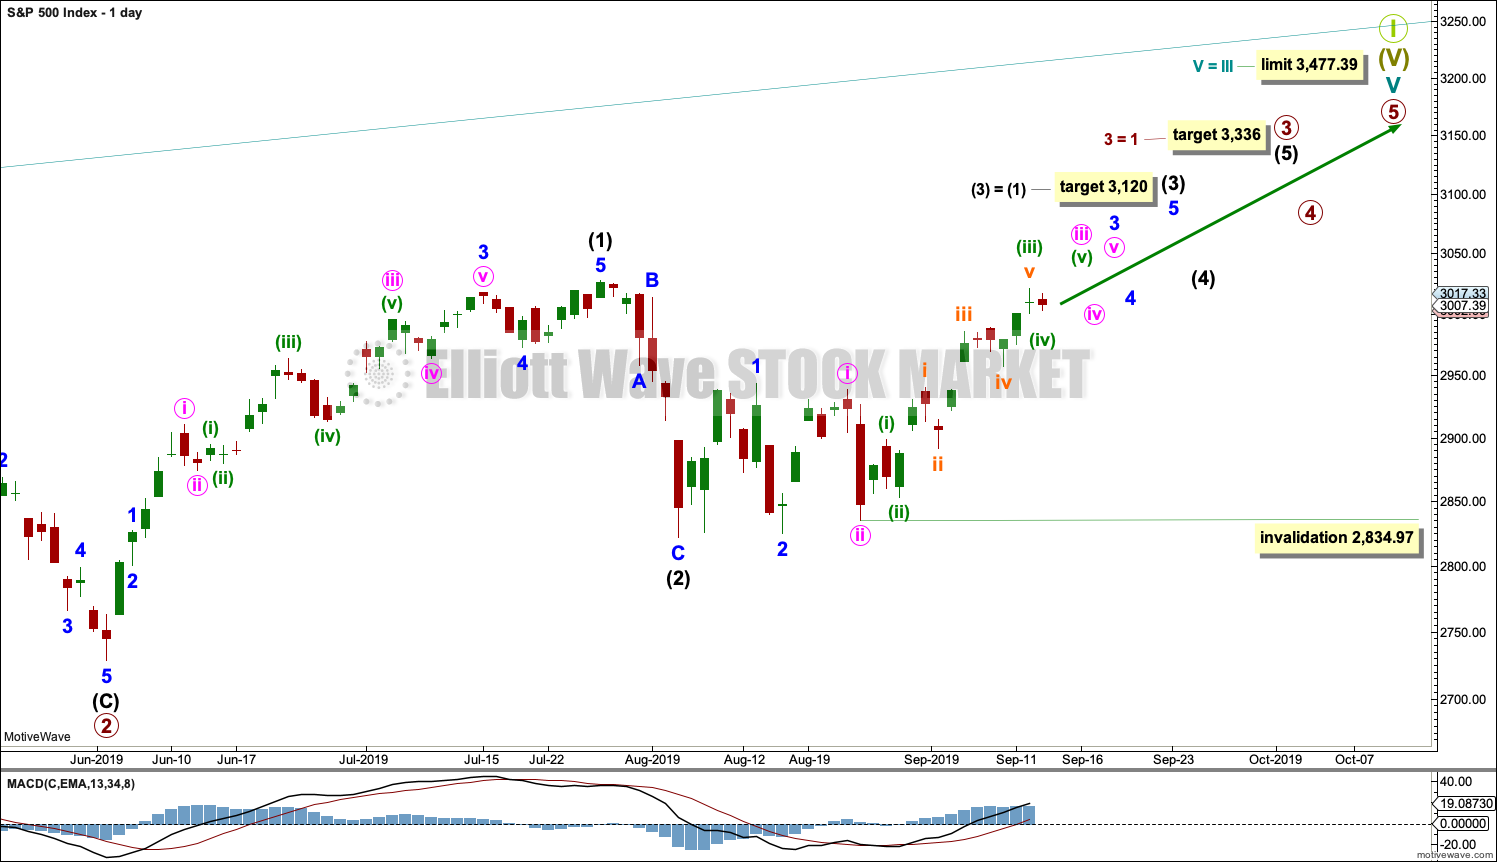
Cycle wave V is seen as an impulse for this wave count.
Within cycle wave V, primary waves 1 and 2 may be complete. Primary wave 3 may have begun.
Primary wave 3 may only subdivide as an impulse. Within primary wave 3, intermediate waves (1) and (2) may be complete.
Intermediate wave (3) may have begun. Intermediate wave (3) may only subdivide as an impulse.
Within intermediate wave (3), minor waves 1 and 2 may be complete. Within minor wave 3, minute waves i and ii may be complete. Within minute wave iii, minuette waves (i), (ii) and (iii) may be complete. It is also possible that within minute wave iii, only minuette wave (i) may be nearing completion. For this reason the invalidation point is left at the same point. Within minute wave iii, no second wave correction may move beyond its start below 2,834.97.
All of primary wave 3, intermediate wave (3), minor wave 3 and minute wave iii may only subdivide as impulses.
Intermediate wave (3) must move far enough above the end of intermediate wave (1) to then allow intermediate wave (4) to unfold and remain above intermediate wave (1) price territory.
HOURLY CHART
Click chart to enlarge.
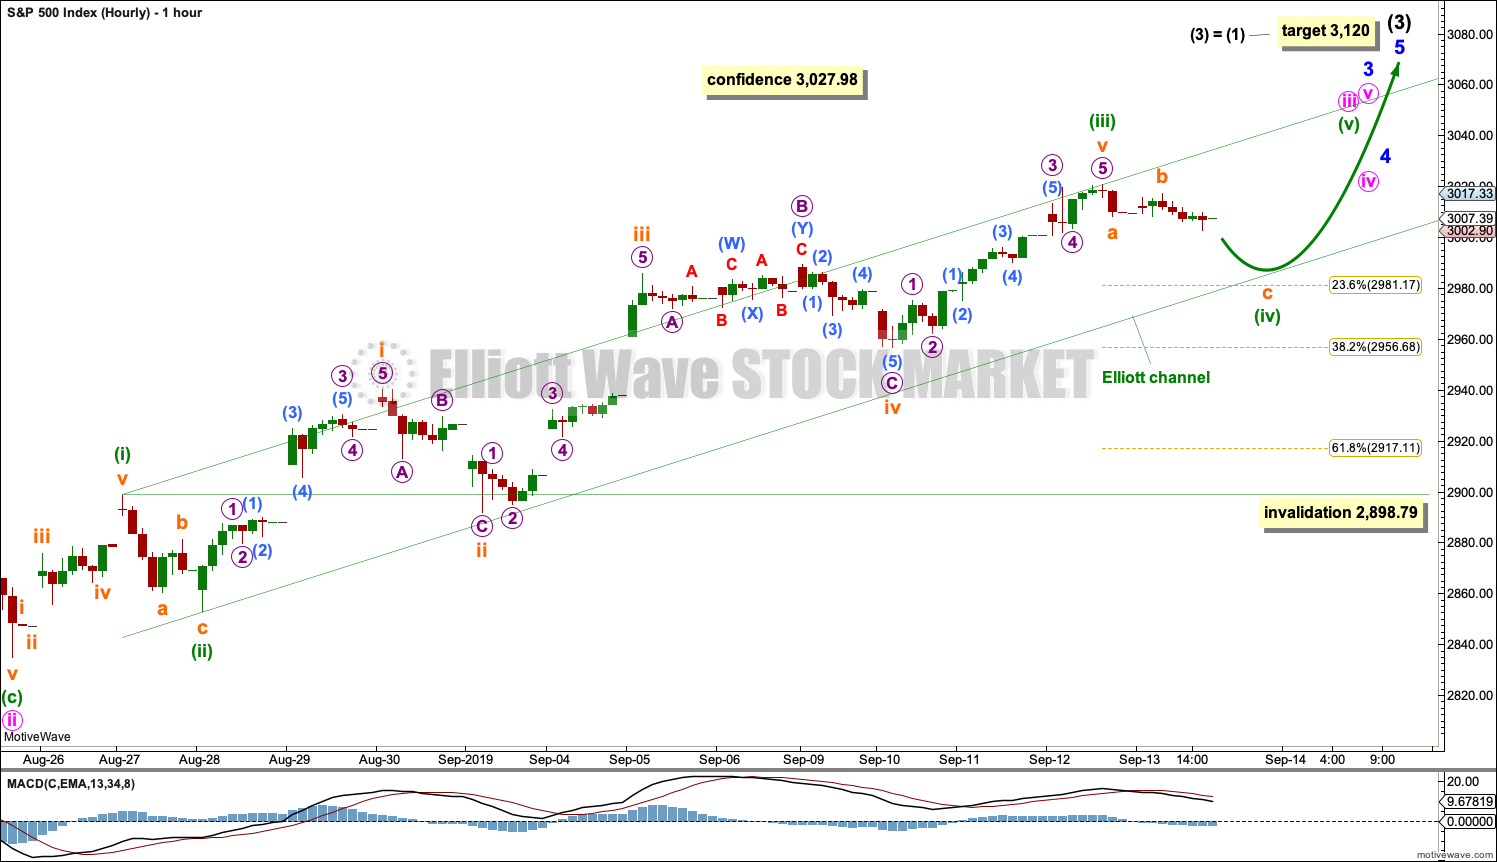
Within minute wave iii, minuette waves (i), (ii) and now (iii) may be complete. If minuette wave (iii) is over, then it would be just 0.61 points longer than 2.618 the length of minuette wave (i).
Minuette wave (iv) may not move into minuette wave (i) price territory below 2,898.79.
Minuette wave (ii) was a deep 0.72 zigzag lasting 8 hours. Minuette wave (iv) may be a more shallow sideways flat, triangle or combination. So far it shows up on the daily chart as one small range red daily candlestick. It may continue for another one or two sessions.
If the target for minuette wave (iv) to end is wrong, it may be too low. There is strong support here about 3,000, which may force minuette wave (iv) to be very shallow.
SECOND WAVE COUNT
WEEKLY CHART
Click chart to enlarge.
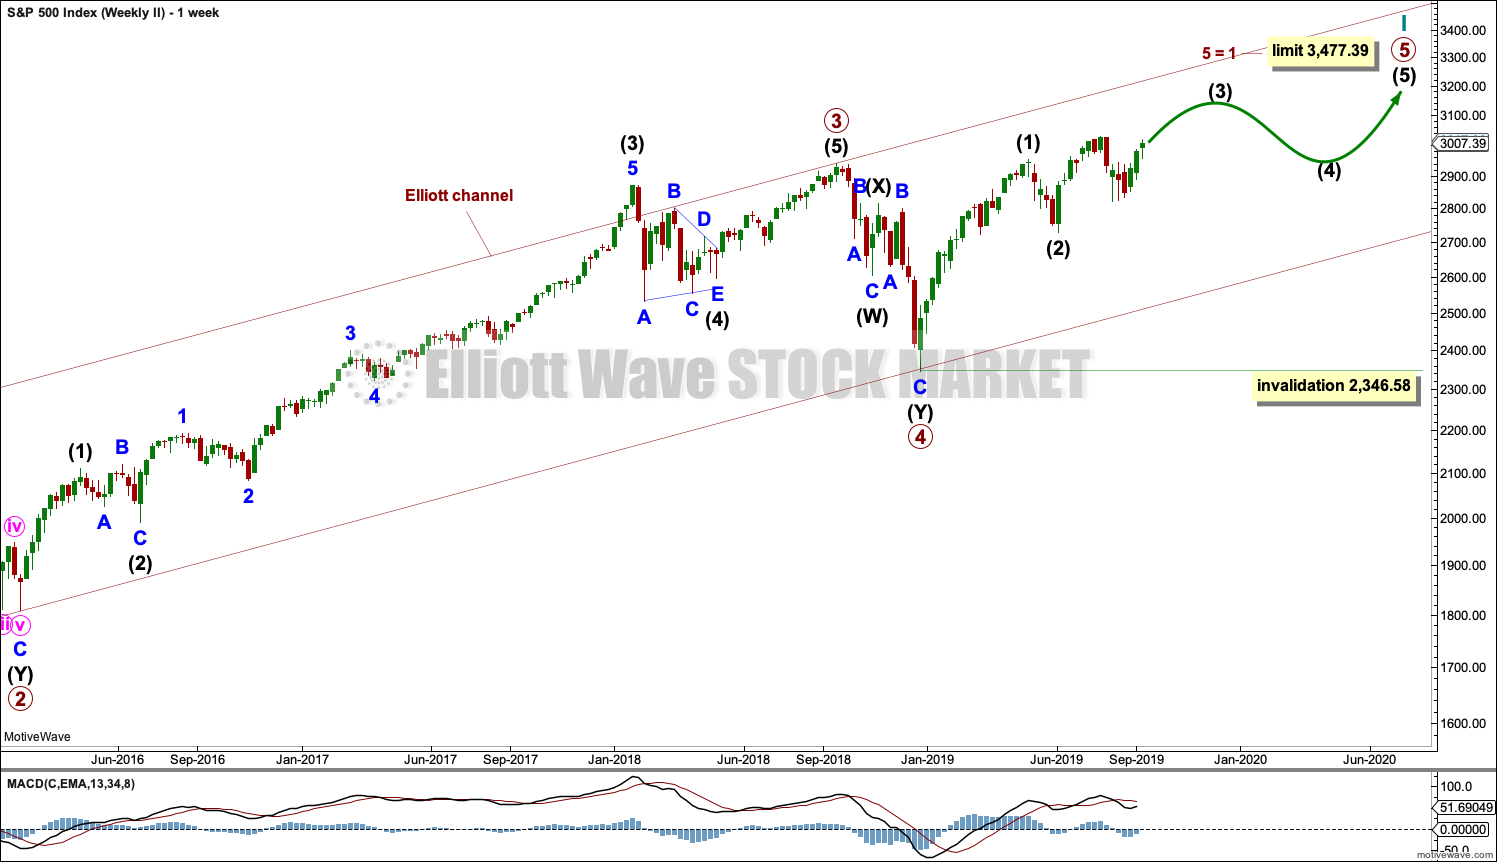
This weekly chart is almost identical to the first weekly chart, with the sole exception being the degree of labelling.
This weekly chart moves the degree of labelling for the impulse beginning in March 2009 all down one degree. This difference is best viewed on monthly charts.
The impulse is still viewed as nearing an end; a fifth wave is still seen as needing to complete higher. This wave count labels it primary wave 5.
TECHNICAL ANALYSIS
WEEKLY CHART
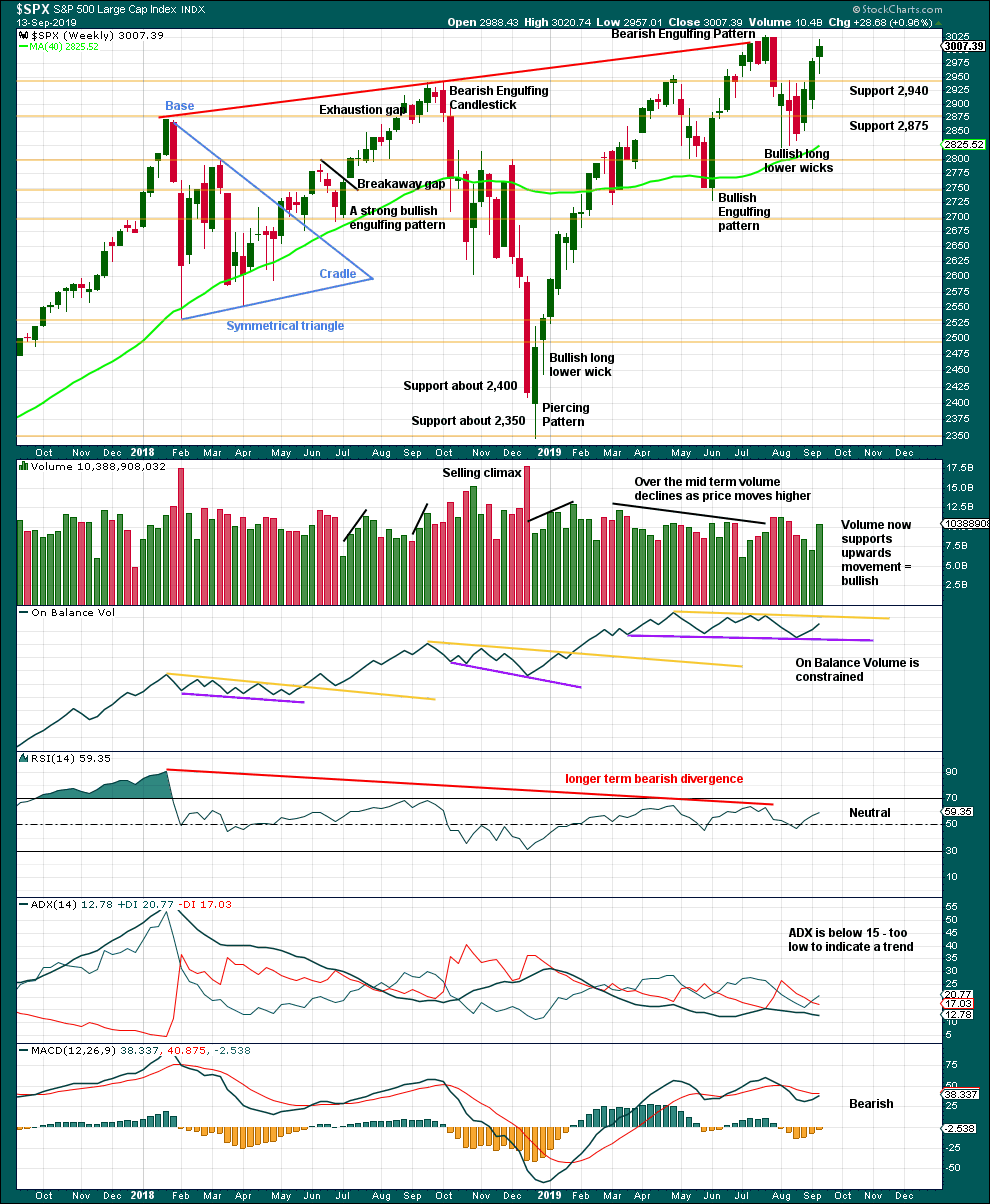
Click chart to enlarge. Chart courtesy of StockCharts.com.
A long lower wick and good support from volume for an upwards week strongly suggests more upwards movement directly ahead.
DAILY CHART
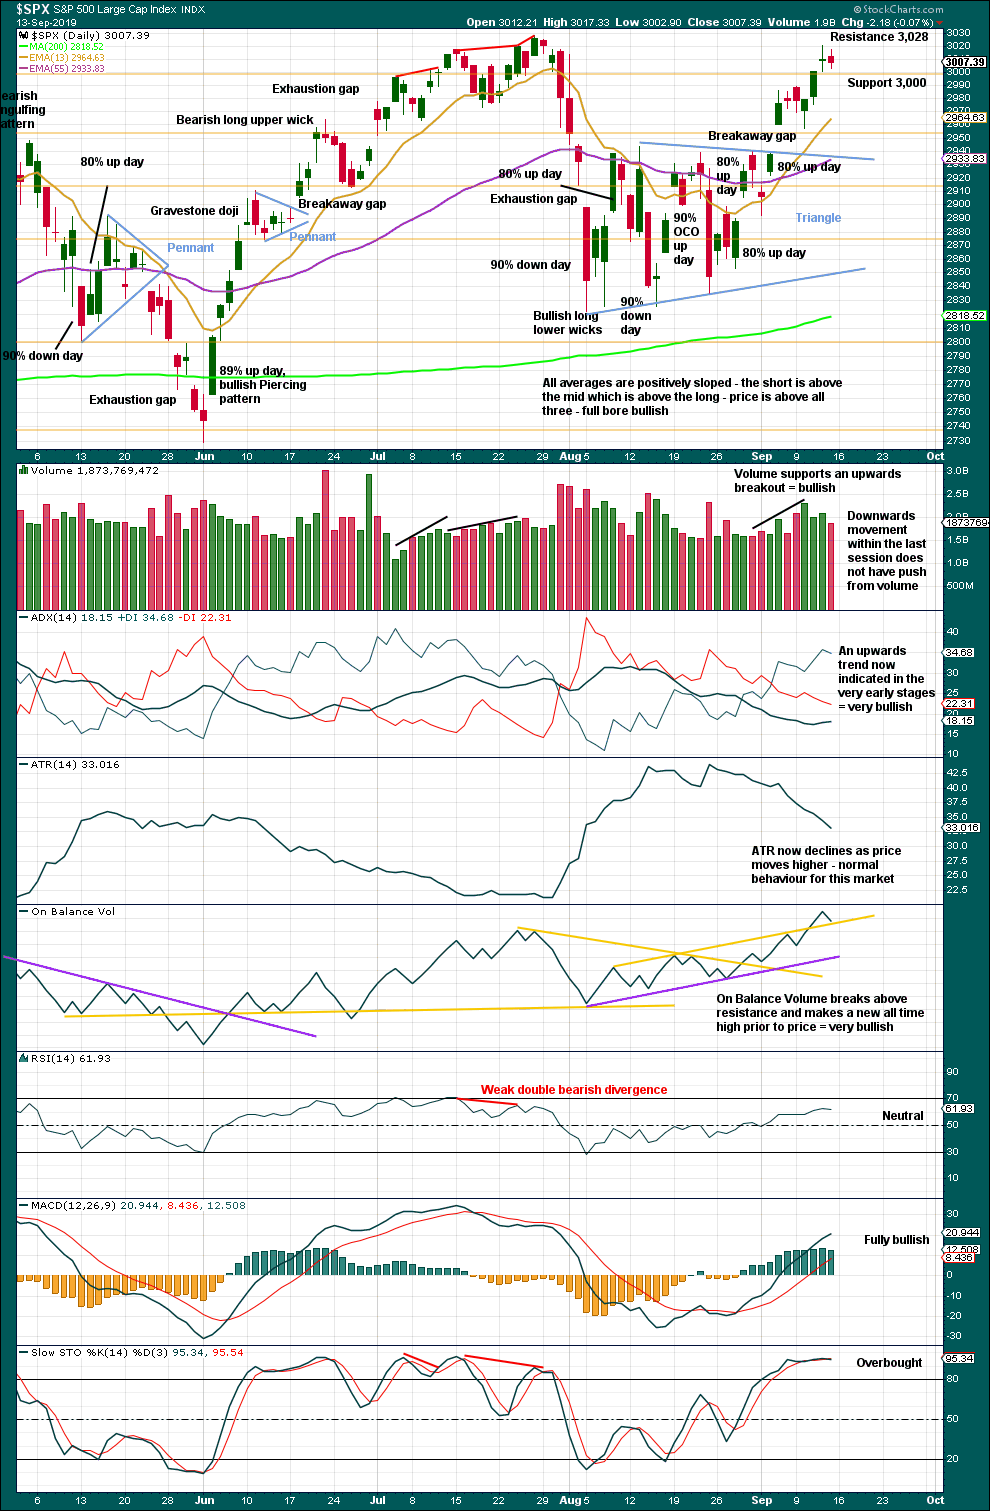
Click chart to enlarge. Chart courtesy of StockCharts.com.
The last low of the 15th of August was preceded immediately by a 90% downward day and followed immediately by a 90% OCO (Operating Companies Only) up day. This is a pattern commonly found at major lows, and it indicates a 180 degree shift in sentiment from bearish to bullish. This supports the Elliott wave count.
Now the next low of the 23rd of August has been followed by two back to back 80% up days. This too is very bullish and favours the main Elliott wave count.
There is now an upwards breakout above the triangle pattern with support from volume and a breakaway gap. The breakaway gap may offer support at 2,938.84.
A target from the triangle pattern is 3,060.
Resistance about 3,000 has been broken. Now Friday looks like a small test of support. A small range inside day, which lacks any push from volume, looks like a small pause within an ongoing upwards trend.
The short-term volume profile, On Balance Volume, ADX and the chart pattern of the triangle all strongly support the Elliott wave count. This trend has further room to move before RSI again reaches into overbought.
BREADTH – AD LINE
WEEKLY CHART
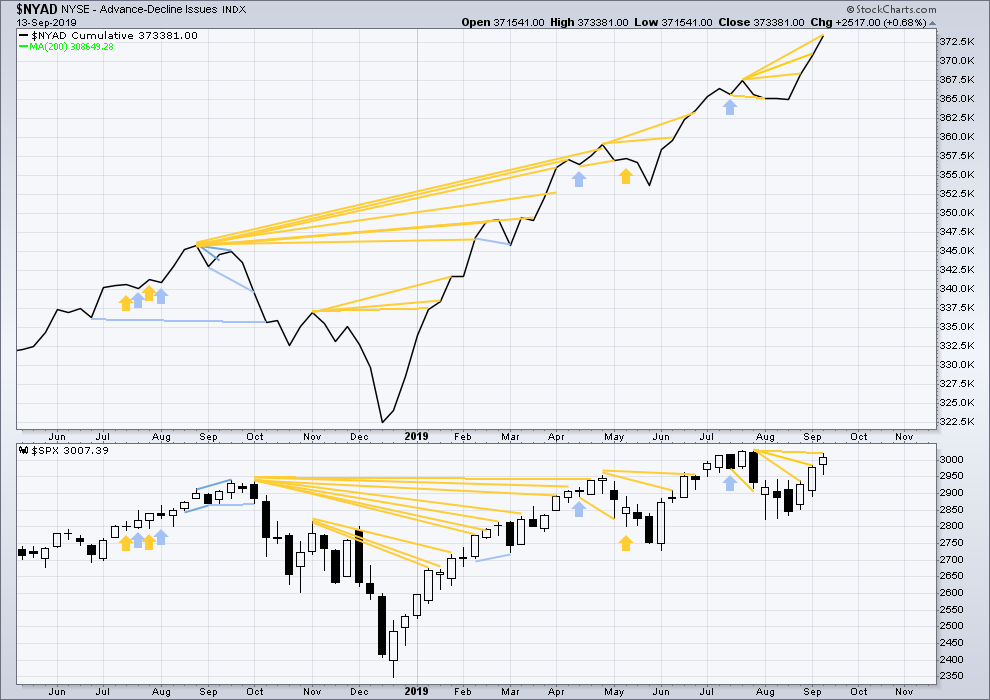
Click chart to enlarge. Chart courtesy of StockCharts.com. So that colour blind members are included, bearish signals
will be noted with blue and bullish signals with yellow.
Bear markets from the Great Depression and onwards have been preceded by an average minimum of 4 months divergence between price and the AD line with only two exceptions in 1946 and 1976. With the AD line making new all time highs again this week, the end of this bull market and the start of a new bear market is very likely a minimum of 4 months away, which is mid January 2020.
In all bear markets in the last 90 years there is some positive correlation (0.6022) between the length of bearish divergence and the depth of the following bear market. No to little divergence is correlated with more shallow bear markets. Longer divergence is correlated with deeper bear markets.
If a bear market does develop here, it comes after no bearish divergence. It would therefore more likely be shallow.
Again, this week both price and the AD line have moved higher.
The AD line makes a new all time high. This is a very bullish signal and very strongly supports the Elliott wave count.
Small caps have made a new swing high above the prior high of the end of July, but mid and large caps have not yet done so. This upwards movement of the last three weeks appears to be led by small caps. Because small caps are usually the first to exhibit deterioration in the later stages of a bull market, some strength in small caps at this stage indicates a healthy bull market with further to run.
DAILY CHART
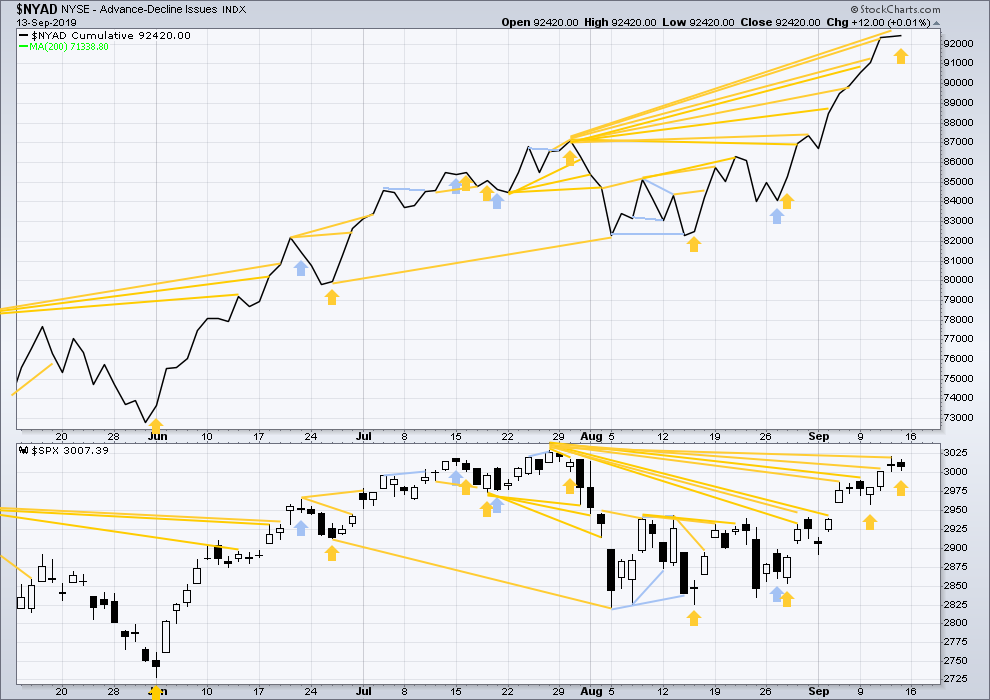
Click chart to enlarge. Chart courtesy of StockCharts.com. So that colour blind members are included, bearish signals
will be noted with blue and bullish signals with yellow.
Breadth should be read as a leading indicator.
Another new all time high from the AD line today is very bullish. This suggests any consolidation or pullback may be relatively shallow and short lived. Bullish divergence still strongly supports the mid-term outlook for the Elliott wave count.
VOLATILITY – INVERTED VIX CHART
WEEKLY CHART
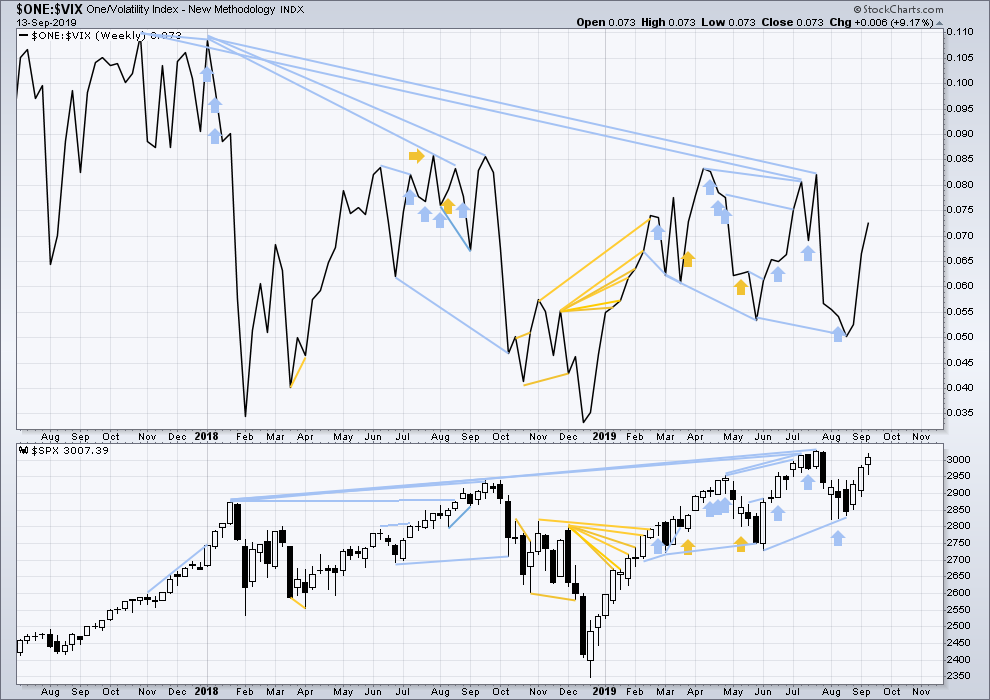
Click chart to enlarge. Chart courtesy of StockCharts.com. So that colour blind members are included, bearish signals
will be noted with blue and bullish signals with yellow.
The all time high for inverted VIX (which is the same as the low for VIX) was on 30th October 2017. There is now nearly one year and ten months of bearish divergence between price and inverted VIX.
The rise in price is not coming with a normal corresponding decline in VIX; VIX remains elevated. This long-term divergence is bearish and may yet develop further as the bull market matures.
This divergence may be an early warning, a part of the process of a top developing that may take years. It may not be useful in timing a trend change.
Again, this week both price and inverted VIX have moved higher. There is no new divergence.
DAILY CHART
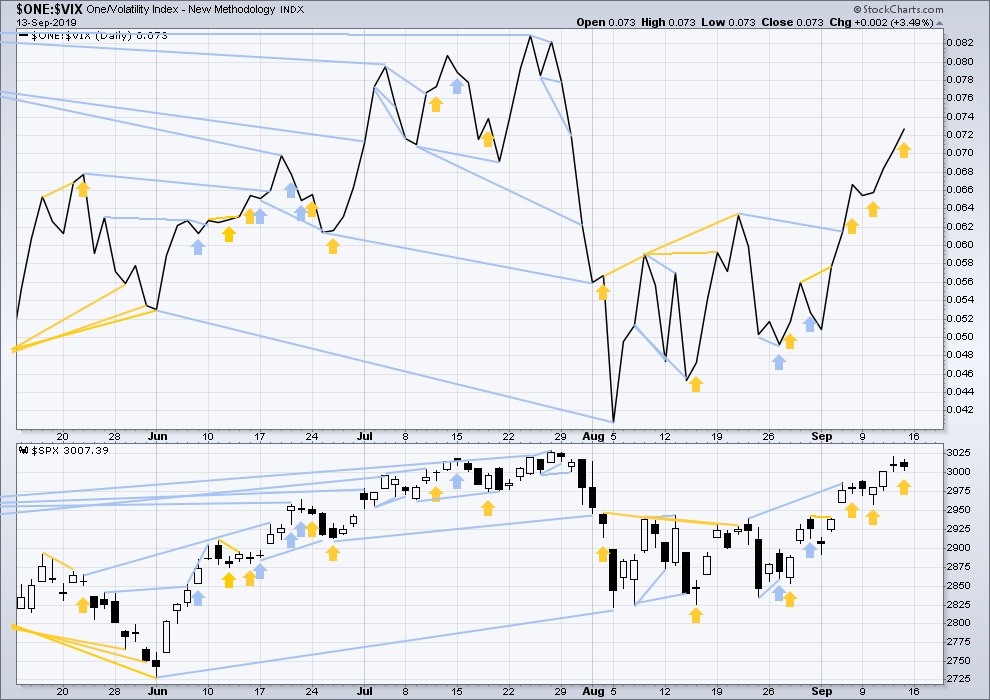
Click chart to enlarge. Chart courtesy of StockCharts.com. So that colour blind members are included, bearish signals
will be noted with blue and bullish signals with yellow.
On Friday price moved sideways and did not make a new short-term high, but inverted VIX has moved strongly higher to make a new short-term high. This divergence is bullish and shall be given a little weight in this analysis as it confirms bullishness in the AD line.
DOW THEORY
Dow Theory confirmed a bear market in December 2018. This does not necessarily mean a bear market at Grand Super Cycle degree though; Dow Theory makes no comment on Elliott wave counts. On the 25th of August 2015 Dow Theory also confirmed a bear market. The Elliott wave count sees that as part of cycle wave II. After Dow Theory confirmation of a bear market in August 2015, price went on to make new all time highs and the bull market continued.
DJIA: 23,344.52 – a close on the 19th of December at 23,284.97 confirms a bear market.
DJT: 9,806.79 – price has closed below this point on the 13th of December.
S&P500: 2,532.69 – a close on the 19th of December at 2,506.96 provides support to a bear market conclusion.
Nasdaq: 6,630.67 – a close on the 19th of December at 6,618.86 provides support to a bear market conclusion.
With all the indices having moved higher following a Dow Theory bear market confirmation, Dow Theory would confirm a bull market if the following highs are made:
DJIA: 26,951.81 – a close above this point has been made on the 3rd of July 2019.
DJT: 11,623.58 – to date DJT has failed to confirm an ongoing bull market.
S&P500: 2,940.91 – a close above this point was made on the 29th of April 2019.
Nasdaq: 8,133.30 – a close above this point was made on the 26th of April 2019.
Published @ 11:33 p.m. EST.
—
Careful risk management protects your trading account(s).
Follow my two Golden Rules:
1. Always trade with stops.
2. Risk only 1-5% of equity on any one trade.
—
New updates to this analysis are in bold.
Hourly chart updated:
Minuette (iv) could now be over
RUT hourly, looking toppy? Is that an expanding flat with a and b complete? Maybe and maybe.
My view going forward. Nailed the last couple turns, can we do it again here? This time though I’ve deployed a bear spread instead of using a butterfly at the target.
The dashed blue lines are symmetric projections, handy little tools those things! Note the one pointing to the 61% way down at 2900. Not impossible…
Kevin I’ve put an ES 240 mins alternate in comments on Lara’s video post which may be closer to her cash chart EW count.
yes i noticed she modified the minute/minuette level details, and I’ve not taken the effort to mimic that at this point. for the analysis above, I don’t think it makes any significant difference for my projections, but I’ll spend some time reviewing adjustments after the market quiets down mid morning, thanks.
I’m starting to lean towards FOMC not cutting rates this week. At Jackson Hole several members said they didn’t want to cut at the last meeting, and several wanted to have one cut and done. Things aren’t as bleak as they were a few weeks ago with an inverted yield curve that’s no longer there.
Anyone have reason to believe the Fed “has to cut” this week? Because if it doesn’t there will be a waterfall sell off, at least very temporarily.
I’ll be shocked if no 1/4 pt cut. I believe the “pricing in oddsmaker” and I don’t think the Fed bucks the occupant that much (can you imagine the likely reaction?). And there’s so much international precedent for cutting (though it’s international overall that is suffering more slow down, Germany in particular). And because a 1/4 pt cut seems more in line with our main EW count. But I do think the market sells off mildly on that.
While the rule “oil up market up” holds when the reason for oil up is increasing demand, when it’s decreasing supply it would seem the opposite would hold, and that’s the case here in pre-market trading. Equities down fairly sharply on the mid-east news while oil is sky high.
Hmmm.. pretty quite here.
Where is the rabbit?