
Upwards movement continues exactly as expected. Today the Elliott wave analysis has strong support from the AD line and On Balance Volume.
Summary: The next target is 3,120. Classic analysis very strongly supports this main wave count.
The biggest picture, Grand Super Cycle analysis, is here.
Monthly charts were last published here, with video here. There are two further alternate monthly charts here, with video here.
ELLIOTT WAVE COUNTS
The two weekly Elliott wave counts below will be labelled First and Second. They may be about of even probability. When the fifth wave currently unfolding on weekly charts may be complete, then these two wave counts will diverge on the severity of the expected following bear market. To see an illustration of this future divergence monthly charts should be viewed.
FIRST WAVE COUNT
WEEKLY CHART
Click chart to enlarge.
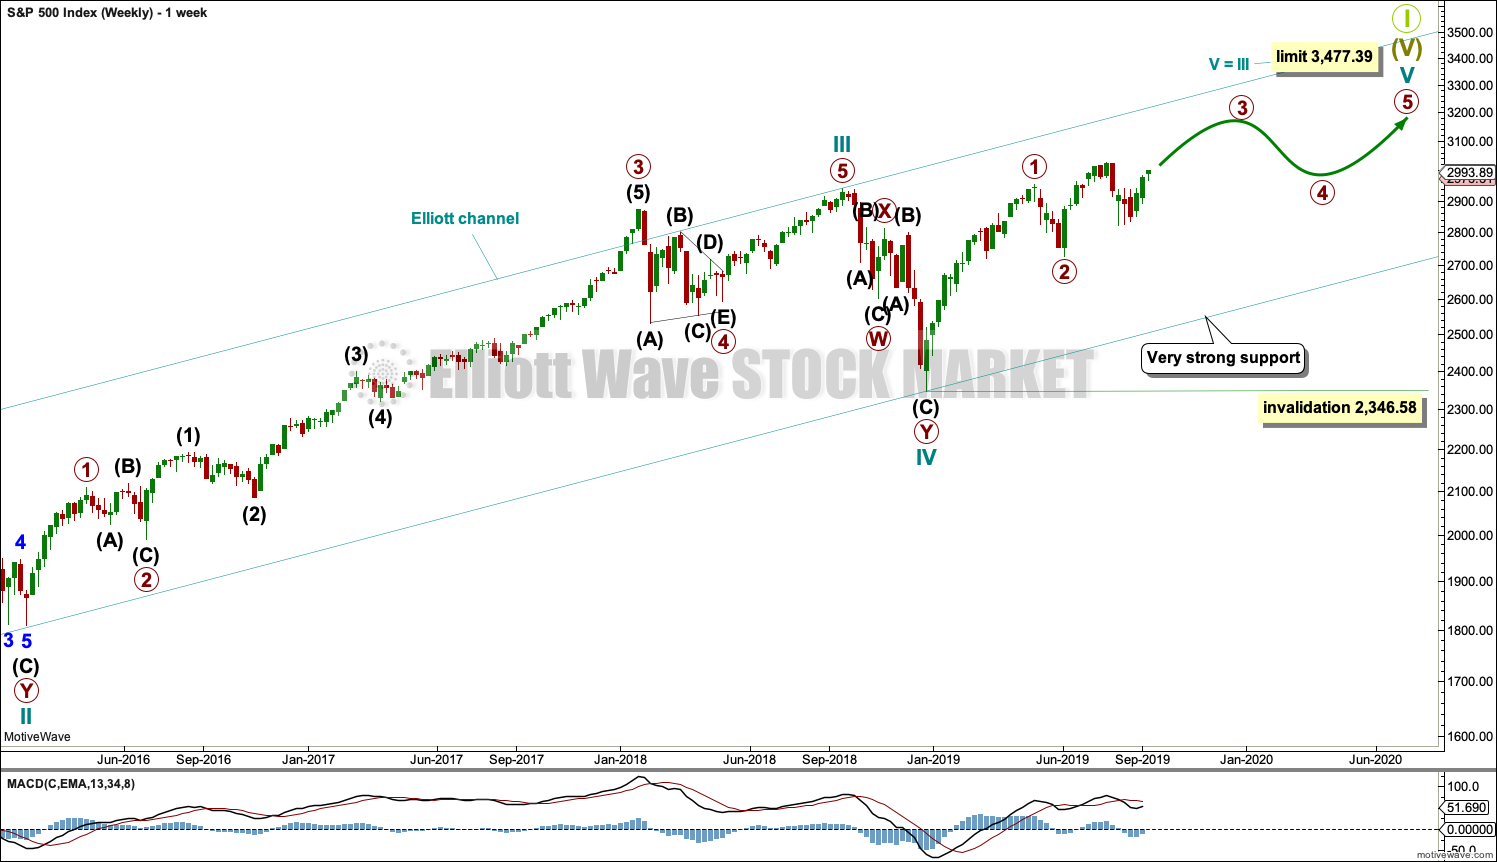
The basic Elliott wave structure consists of a five wave structure up followed by a three wave structure down (for a bull market). This wave count sees the bull market beginning in March 2009 as an incomplete five wave impulse and now within the last fifth wave, which is labelled cycle wave V. This impulse is best viewed on monthly charts. The weekly chart focusses on the end of it.
Elliott wave is fractal. This fifth wave labelled cycle wave V may end a larger fifth wave labelled Super Cycle wave (V), which may end a larger first wave labelled Grand Super Cycle wave I.
The teal Elliott channel is drawn using Elliott’s first technique about the impulse of Super Cycle wave (V). Draw the first trend line from the end of cycle wave I (off to the left of the chart, the weekly candlestick beginning 30th November 2014) to the end of cycle wave III, then place a parallel copy on the end of cycle wave II. This channel perfectly shows where cycle wave IV ended at support. The strongest portion of cycle wave III, the end of primary wave 3, overshoots the upper edge of the channel. This is a typical look for a third wave and suggests the channel is drawn correctly and the way the impulse is counted is correct.
Within Super Cycle wave (V), cycle wave III is shorter than cycle wave I. A core Elliott wave rule states that a third wave may never be the shortest. For this rule to be met in this instance, cycle wave V may not be longer in length than cycle wave III. This limit is at 3,477.39.
Cycle wave V may subdivide either as an impulse or an ending diagonal. Impulses are much more common. This main wave count expects that cycle wave V may be unfolding as an impulse.
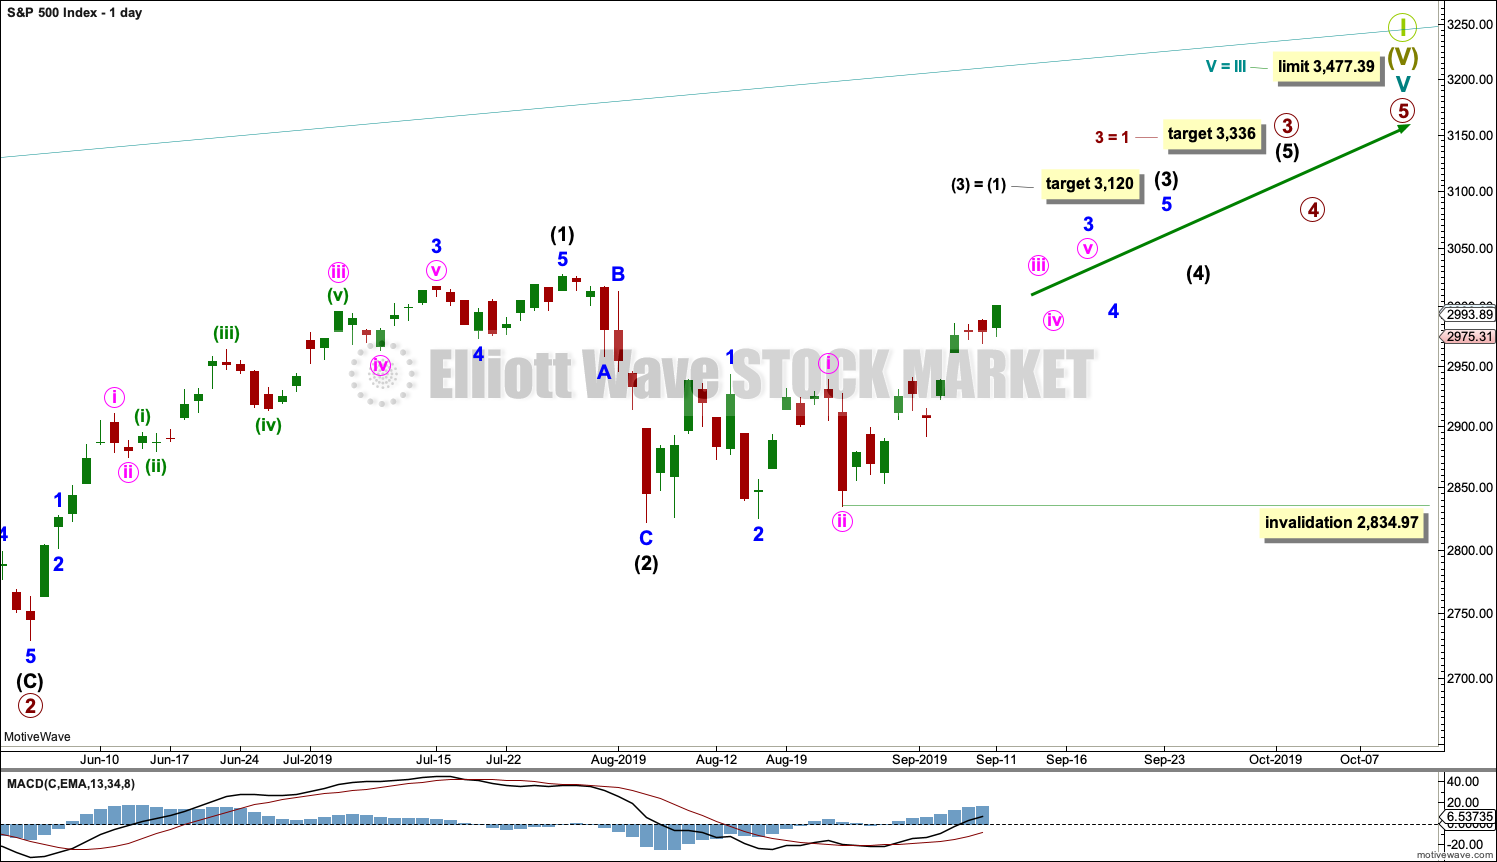
The daily chart below will now focus on all movement from the end of primary wave 1.
In historic analysis, two further monthly charts have been published that do not have a limit to upwards movement and are more bullish than this wave count. Members are encouraged to consider those possibilities (links below summary) alongside the wave counts presented on a daily and weekly basis.
DAILY CHART
Click chart to enlarge.
Cycle wave V is seen as an impulse for this wave count.
Within cycle wave V, primary waves 1 and 2 may be complete. Primary wave 3 may have begun.
Primary wave 3 may only subdivide as an impulse. Within primary wave 3, intermediate waves (1) and (2) may be complete.
Intermediate wave (3) may have begun. Intermediate wave (3) may only subdivide as an impulse.
Within intermediate wave (3), minor waves 1 and 2 may be complete. Within minor wave 3, minute waves i and ii may be complete. Within minute wave iii, no second wave correction may move beyond its start below 2,834.97.
All of primary wave 3, intermediate wave (3), minor wave 3 and minute wave iii may only subdivide as impulses.
Intermediate wave (3) must move far enough above the end of intermediate wave (1) to then allow intermediate wave (4) to unfold and remain above intermediate wave (1) price territory.
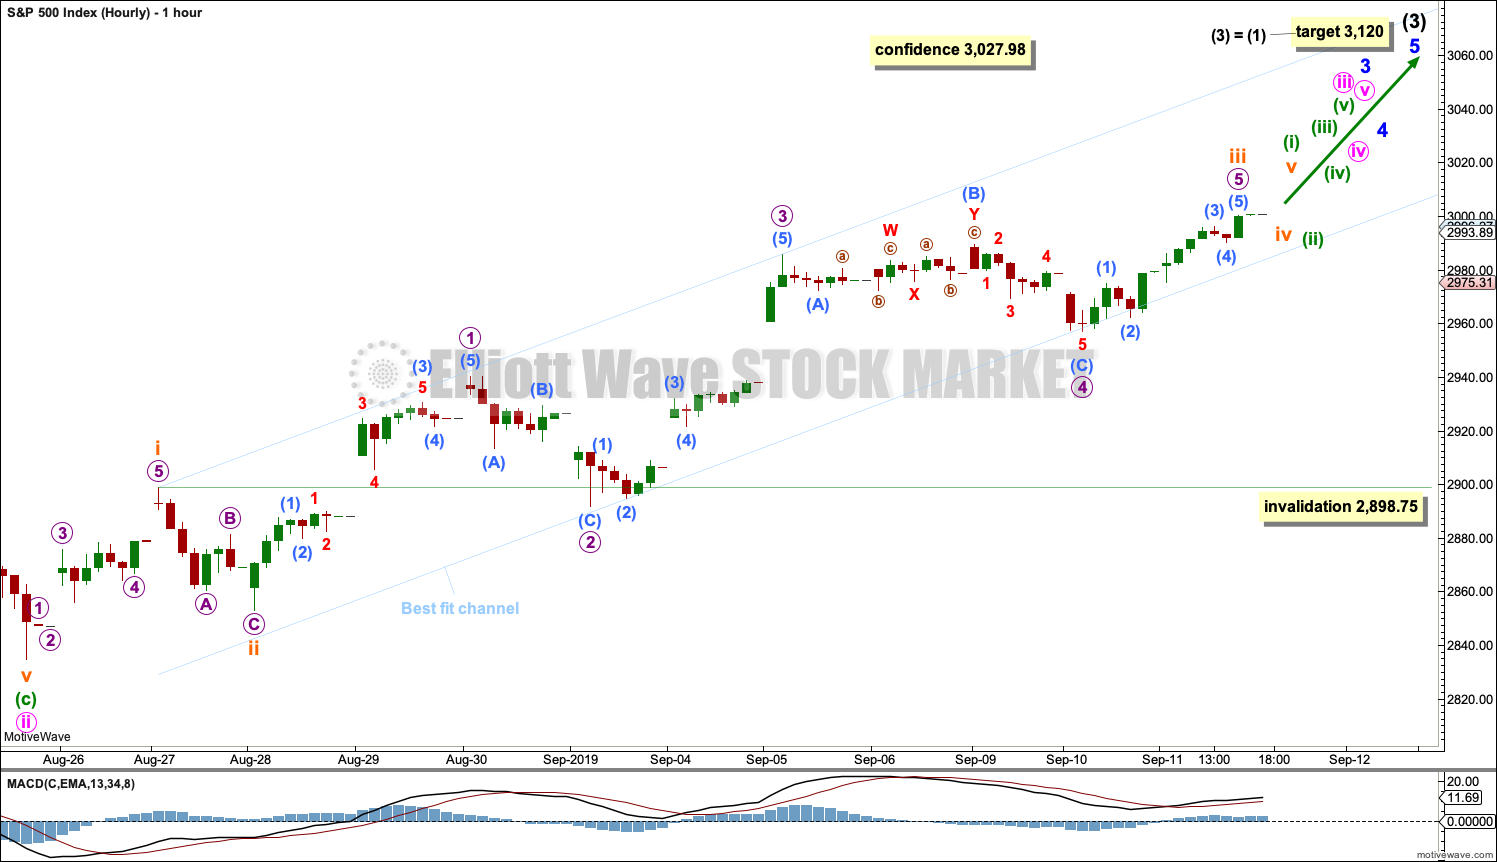
HOURLY CHART
Click chart to enlarge.
Within minor wave 3, minute waves i and ii may be complete. Minute wave iii may only subdivide as an impulse. Within the impulse of minute wave iii, minuette wave (i) may be almost complete.
Within minuette wave (i), subminuette waves i and ii may be complete. Subminuette wave iii may now be complete. Subminuette wave iv may find support about the lower edge of the best fit channel.
The breakaway gap remains open.
Subminuette wave iv may not move into subminuette wave i price territory below 2,898.75.
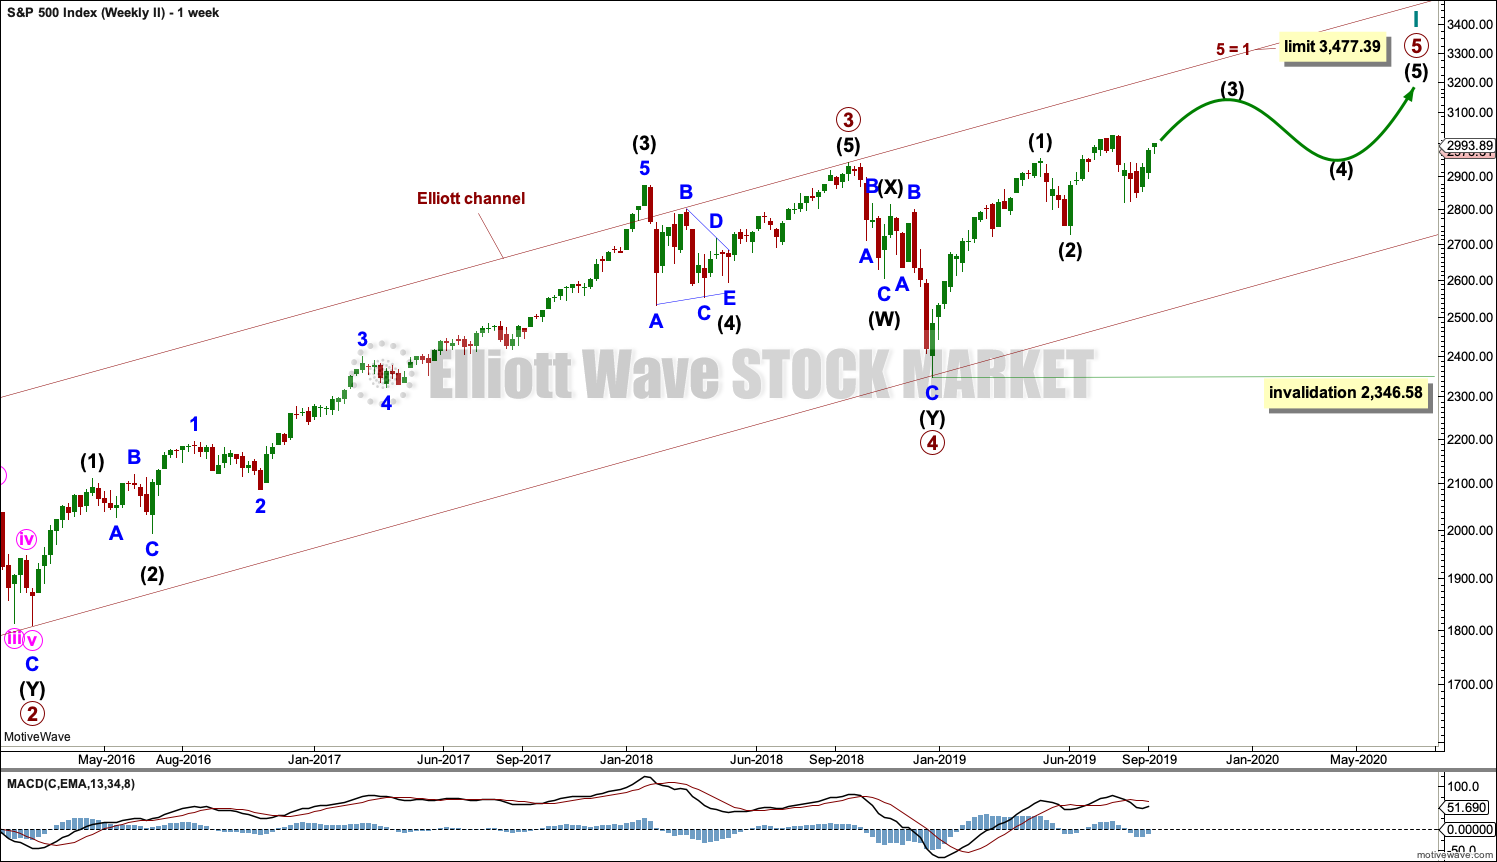
SECOND WAVE COUNT
WEEKLY CHART
Click chart to enlarge.
This weekly chart is almost identical to the first weekly chart, with the sole exception being the degree of labelling.
This weekly chart moves the degree of labelling for the impulse beginning in March 2009 all down one degree. This difference is best viewed on monthly charts.
The impulse is still viewed as nearing an end; a fifth wave is still seen as needing to complete higher. This wave count labels it primary wave 5.
TECHNICAL ANALYSIS
WEEKLY CHART
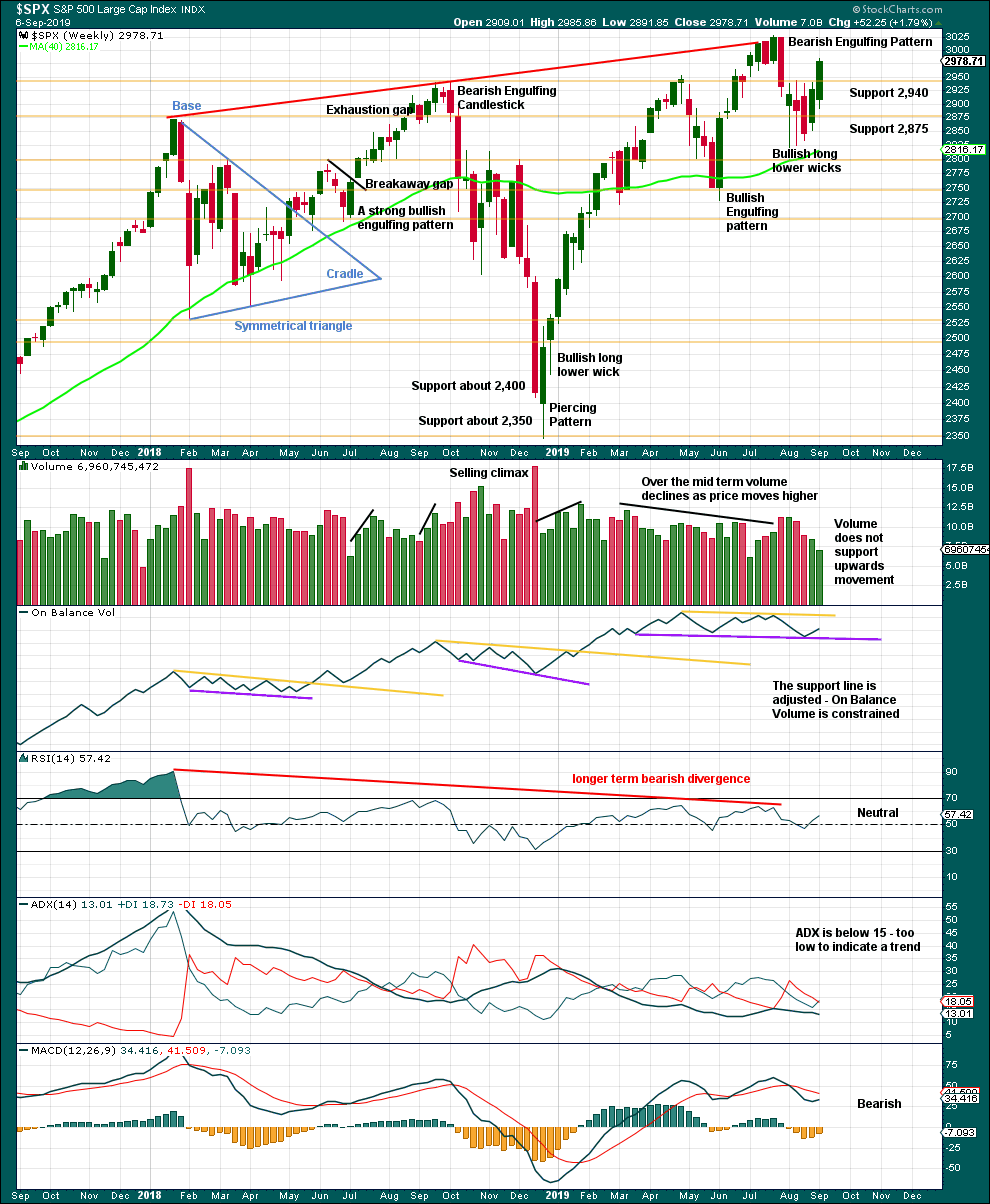
Click chart to enlarge. Chart courtesy of StockCharts.com.
Last week has effected an upwards breakout from a small range of the prior three weeks. While the breakout does not have support from volume at the weekly chart level, it does at the daily chart level for the day of the breakout.
DAILY CHART
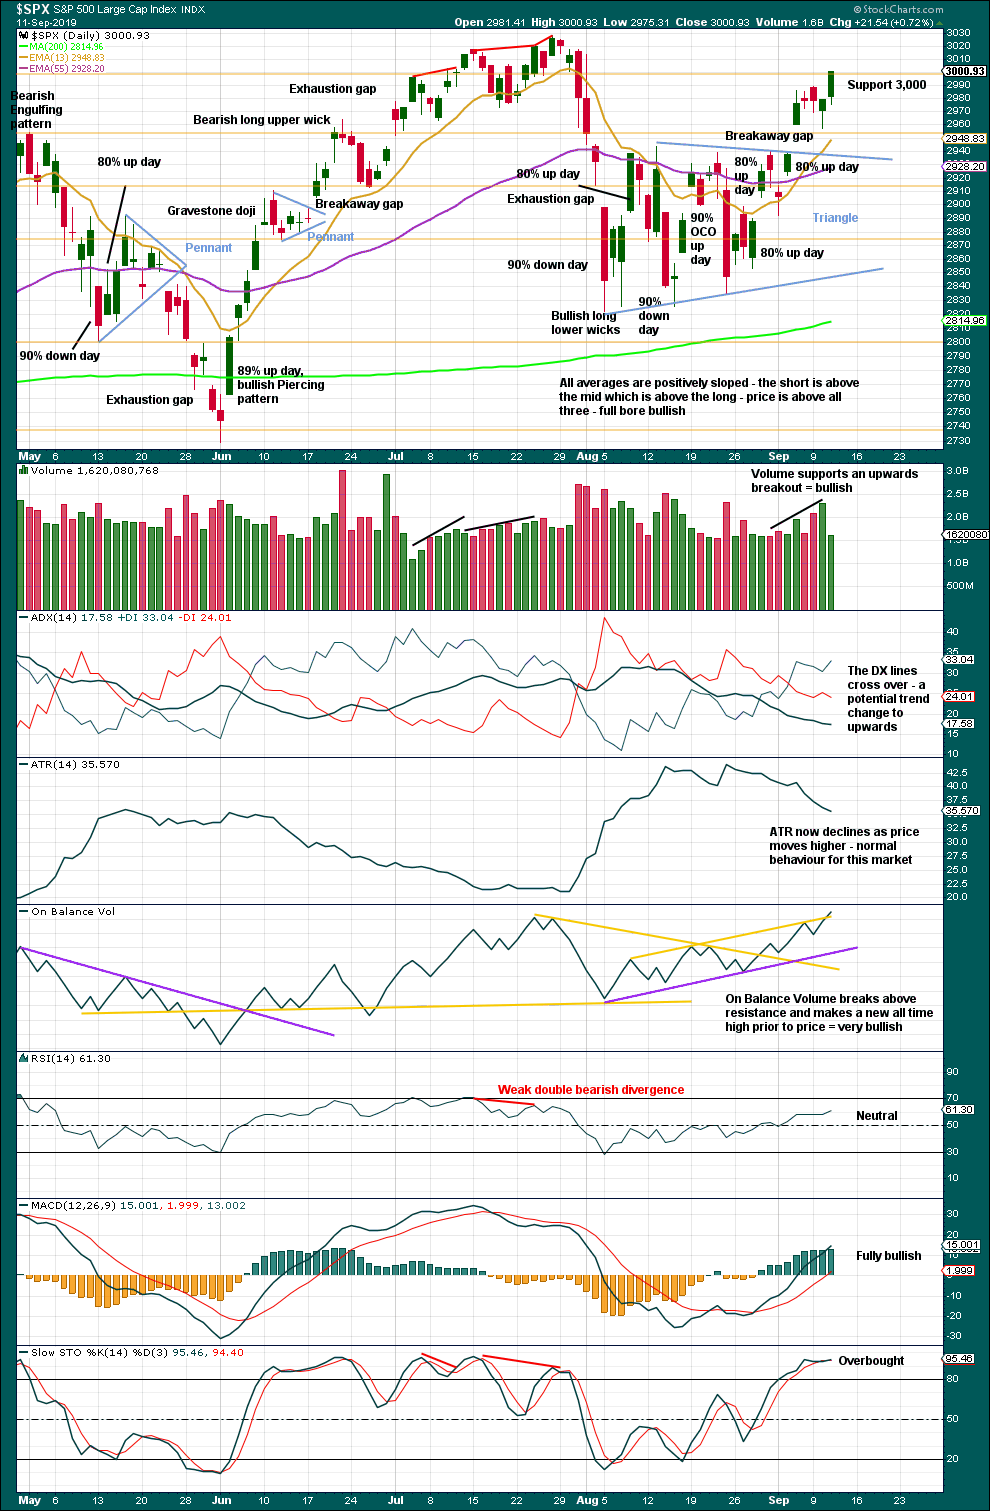
Click chart to enlarge. Chart courtesy of StockCharts.com.
The last low of the 15th of August was preceded immediately by a 90% downward day and followed immediately by a 90% OCO (Operating Companies Only) up day. This is a pattern commonly found at major lows, and it indicates a 180 degree shift in sentiment from bearish to bullish. This favours the main Elliott wave count.
Now the next low of the 23rd of August has been followed by two back to back 80% up days. This too is very bullish and favours the main Elliott wave count.
There is now an upwards breakout above the triangle pattern with support from volume and a breakaway gap. The breakaway gap may offer support at 2,938.84.
A target from the triangle pattern is 3,060.
Look for next resistance about 3,000.
Today a shaven head and a new all time high from On Balance Volume is extremely bullish. This chart strongly supports the Elliott wave count.
BREADTH – AD LINE
WEEKLY CHART
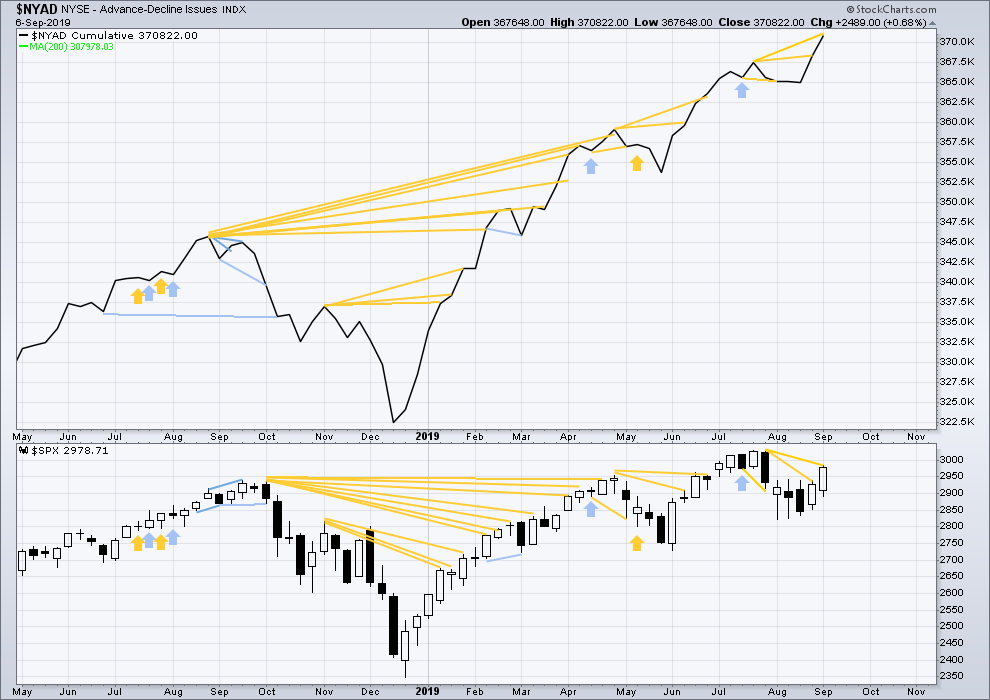
Click chart to enlarge. Chart courtesy of StockCharts.com. So that colour blind members are included, bearish signals
will be noted with blue and bullish signals with yellow.
Bear markets from the Great Depression and onwards have been preceded by an average minimum of 4 months divergence between price and the AD line with only two exceptions in 1946 and 1976. With the AD line making new all time highs again this week, the end of this bull market and the start of a new bear market is very likely a minimum of 4 months away, which is the beginning of January 2020.
In all bear markets in the last 90 years there is some positive correlation (0.6022) between the length of bearish divergence and the depth of the following bear market. No to little divergence is correlated with more shallow bear markets. Longer divergence is correlated with deeper bear markets.
If a bear market does develop here, it comes after no bearish divergence. It would therefore more likely be shallow.
Again, last week both price and the AD line have moved higher.
The AD line makes a new all time high. This is a very bullish signal and very strongly supports the Elliott wave count.
DAILY CHART
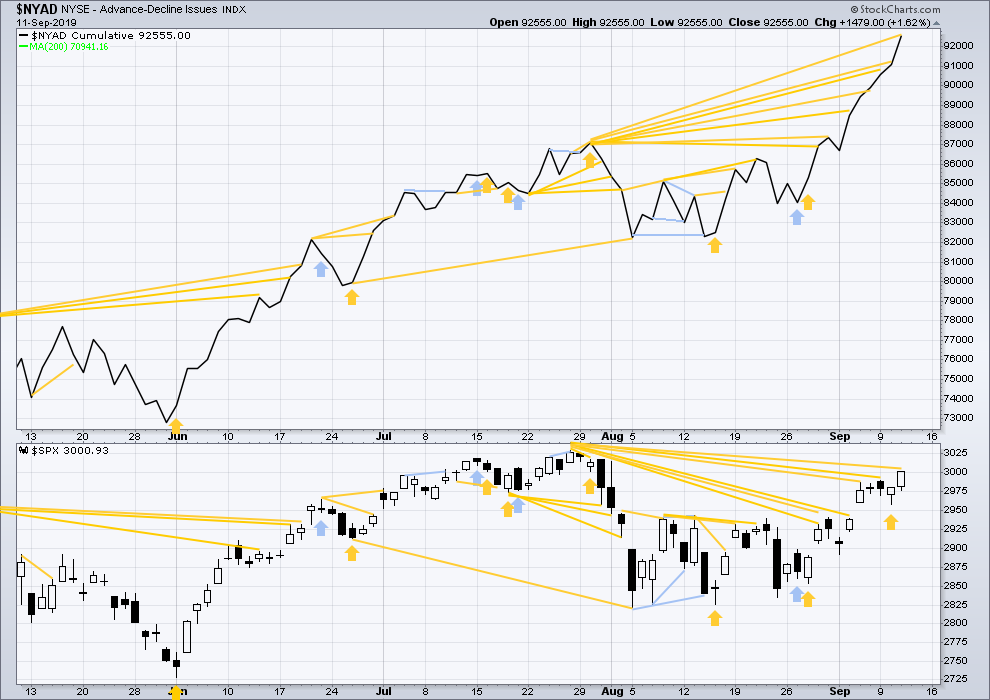
Click chart to enlarge. Chart courtesy of StockCharts.com. So that colour blind members are included, bearish signals
will be noted with blue and bullish signals with yellow.
Breadth should be read as a leading indicator.
Today both price and the AD line moved higher. The AD line has made yet another new all time high prior to price. This continuing divergence is very bullish and strongly supports the Elliott wave count.
VOLATILITY – INVERTED VIX CHART
WEEKLY CHART
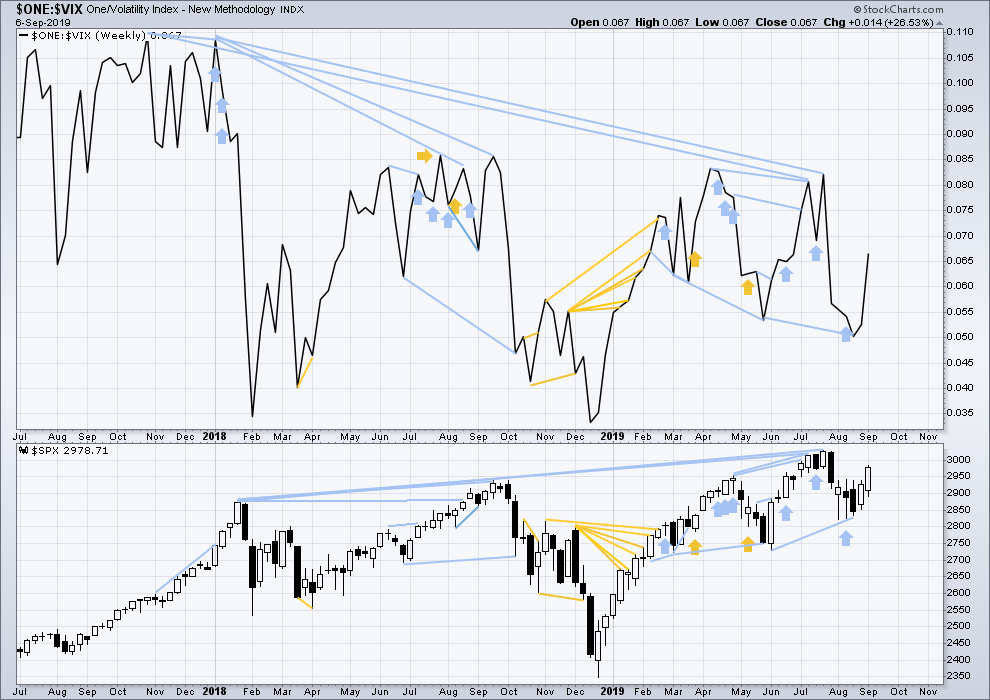
Click chart to enlarge. Chart courtesy of StockCharts.com. So that colour blind members are included, bearish signals
will be noted with blue and bullish signals with yellow.
The all time high for inverted VIX (which is the same as the low for VIX) was on 30th October 2017. There is now nearly one year and ten months of bearish divergence between price and inverted VIX.
The rise in price is not coming with a normal corresponding decline in VIX; VIX remains elevated. This long-term divergence is bearish and may yet develop further as the bull market matures.
This divergence may be an early warning, a part of the process of a top developing that may take years. It may not be useful in timing a trend change.
Last week both price and inverted VIX have moved higher. There is no new divergence.
DAILY CHART
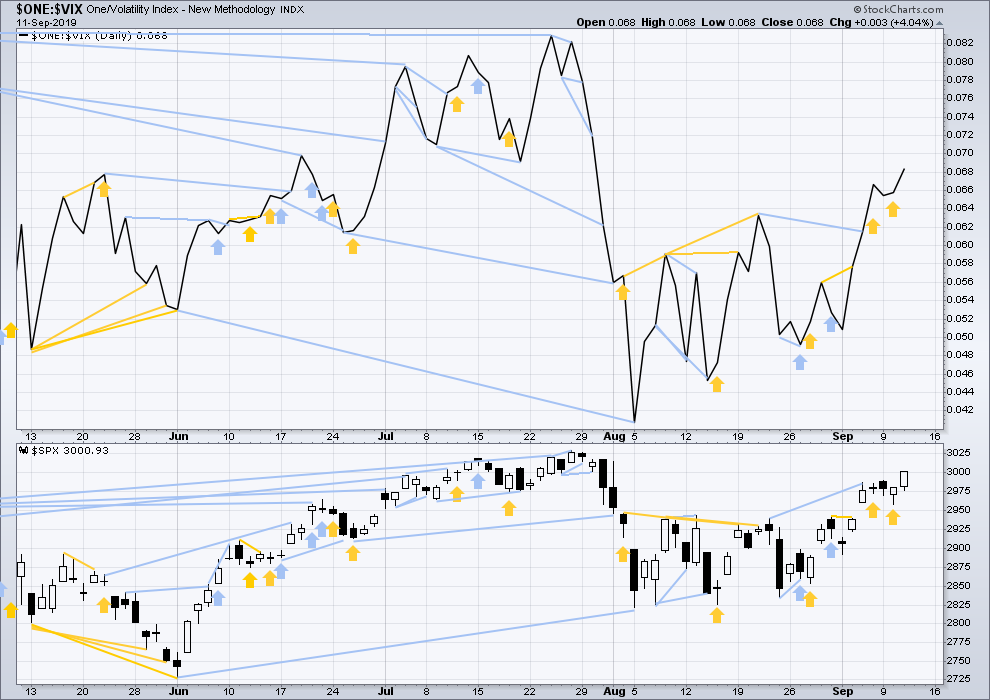
Click chart to enlarge. Chart courtesy of StockCharts.com. So that colour blind members are included, bearish signals
will be noted with blue and bullish signals with yellow.
Today both price and inverted VIX have moved higher. There is no new short-term divergence.
DOW THEORY
Dow Theory confirmed a bear market in December 2018. This does not necessarily mean a bear market at Grand Super Cycle degree though; Dow Theory makes no comment on Elliott wave counts. On the 25th of August 2015 Dow Theory also confirmed a bear market. The Elliott wave count sees that as part of cycle wave II. After Dow Theory confirmation of a bear market in August 2015, price went on to make new all time highs and the bull market continued.
DJIA: 23,344.52 – a close on the 19th of December at 23,284.97 confirms a bear market.
DJT: 9,806.79 – price has closed below this point on the 13th of December.
S&P500: 2,532.69 – a close on the 19th of December at 2,506.96 provides support to a bear market conclusion.
Nasdaq: 6,630.67 – a close on the 19th of December at 6,618.86 provides support to a bear market conclusion.
With all the indices having moved higher following a Dow Theory bear market confirmation, Dow Theory would confirm a bull market if the following highs are made:
DJIA: 26,951.81 – a close above this point has been made on the 3rd of July 2019.
DJT: 11,623.58 – to date DJT has failed to confirm an ongoing bull market.
S&P500: 2,940.91 – a close above this point was made on the 29th of April 2019.
Nasdaq: 8,133.30 – a close above this point was made on the 26th of April 2019.
Published @ 08:45 p.m. EST.
—
Careful risk management protects your trading account(s).
Follow my two Golden Rules:
1. Always trade with stops.
2. Risk only 1-5% of equity on any one trade.
—
New updates to this analysis are in bold.
Howdy Folks!
People are very Bullish here!
S & P 500 Linear Regression Model dating all the way back to 1871 tells a somewhat different story!
For example if we where to cross above 123.7% we will be in the 3 standard deviations.
In easy terms that only happens .003% of the time!
Very rare to happen!
Only other time that it has happen was back in 2000 where we went 130% above the line!
September 3080 will be at the 3 standard
October 3091 will be at the 3 standard
Since January 2018 to now every time we got to 116 – 119.7% above the regression line we have had corrections!
Very high percentages of the line leads to very poor performance in the stock markets that’s why it has been sideways for the past 18 months!
At Lara’s target of 3120 will put us at 126 – 127% of regression if that happens from now until the end of October!
For her 3400ish Target that would probably have to happen towards the end of next year!
That’s a big IF!
That would also break the 2000 record!
Be careful folks the risk right now outweighs the reward!
Caveat Emptor!
At the end of a very long running bull market I would absolutely expect to see extremes like price moving into 3 std deviations from the mean.
I do not think that using only one metric, standard deviations from the mean, is going to be helpful in timing an end to this bull market. And just because price is currently very extreme, does not mean that it cannot become more extreme.
Along the way up I am also expecting another two multi month pullbacks or consolidations which may assist to relieve extreme conditions; intermediate (4) and primary 4. But not yet.
Updated hourly chart
XLF leading? another leg up today ….
28.70 coming it appears. But this is on the highly correlated sell-off in bonds. Which is (primary thesis) a iv wave down. If/when that finishes and bonds reassert their secular uptrend, XLF likely to turn tail.
grabbed some high delta IWM calls for Oct when I saw the 5 min in RUT turn back up with a slightly higher pivot low than the last. Working well so far…
was able to sell twice and buy twice so far today, fun……. currently long
sold again, maybe its triangle time, let the 20D MA catch up?
Nice.
I just put a small amount of $ where my mouth is re: RUT. Bought Dec IWM calls WAAAAY out of the money calls at 180. $13 apiece. A very cheap gamble. Go RUT. (and go 49’rs).
also trying something new here, I think RUT goes sideways/down into and through tomorrow. bought just in the money IWM puts for tomorrow, cheap and not too much movement down gets me to break even. A few points (below 169.2) and they pay well.
Agree, currently short futures contract
stopped out of this one
Lol!!! Yea I bailed earlier too. Interesting how SPX and RUT are diverging a bit here towards the end of the day. Still think we get a “real iv” in both over next few days.
This weekly chart suggests we are approaching or at a critical juncture for SPX. I am still fully long. But I have my finger on the trigger.
Gold up day; looks like a B wave up to me (or even a 2 wave if gold is starting a new motive wave down, as suggested is possible by Lara in her gold update). At any rate, setting up GLD for a short in my view.
I extensively EW map AMGN, and it’s well set up to the long side, waiting for a trigger, my website alerts page for that chart. specktrading dot com.
Kind of looks like the broad markets might be starting another iv here. SPY is exactly on the mid-point of the butterfly (299-301-303) I targetted for right here, right…tomorrow! So sideways action here until late tomorrow floats one of my boats pretty well.
Hi Lara
The targets of 3477 is that the end of wave 5 and commencement of a bear market or is it at 3616 as for your grand super cycle analysis.
Ah, the Grand Super Cycle analysis target is probably wrong. And would only apply to the second weekly chart in this analysis, because the first has that hard limit.
Friends, gentlepeople, and colleagues: I believe it’s more likely than not that RUT is going up to the 1800 area, at least, to complete this intermediate 3. The higher projection on the chart is of the intermediate 1 and that points to just below the 161% extension and that means yes, I’m strongly bullish. I would suggest buying pullbacks, as they say. In whatever timeframe floats your boat.
I still have a long standing Point & Figure chart that gives a target of 3900+ on SPX. I also have one now for the DJIA of 31,000+. Quite bullish targets indeed.
Correction: 3800+ P&F target
#1
Second again
Three of a kind.