
Price remains range bound with resistance about 2,940 and support about 2,920. The breakout is still expected to be in the same direction. Targets remain the same.
Summary: An upwards breakout above 2,940 with support from volume would add confidence in the main wave count. If this happens, then the next target is 3,120. Classic analysis very strongly supports this main wave count.
A new low below 2,822.12 would indicate a continuing deeper pullback as fairly likely, as outlined by the alternate wave counts. The first target would then be at 2,663.
The biggest picture, Grand Super Cycle analysis, is here.
Monthly charts were last published here, with video here. There are two further alternate monthly charts here, with video here.
ELLIOTT WAVE COUNTS
The two weekly Elliott wave counts below will be labelled First and Second. They may be about of even probability. When the fifth wave currently unfolding on weekly charts may be complete, then these two wave counts will diverge on the severity of the expected following bear market. To see an illustration of this future divergence monthly charts should be viewed.
FIRST WAVE COUNT
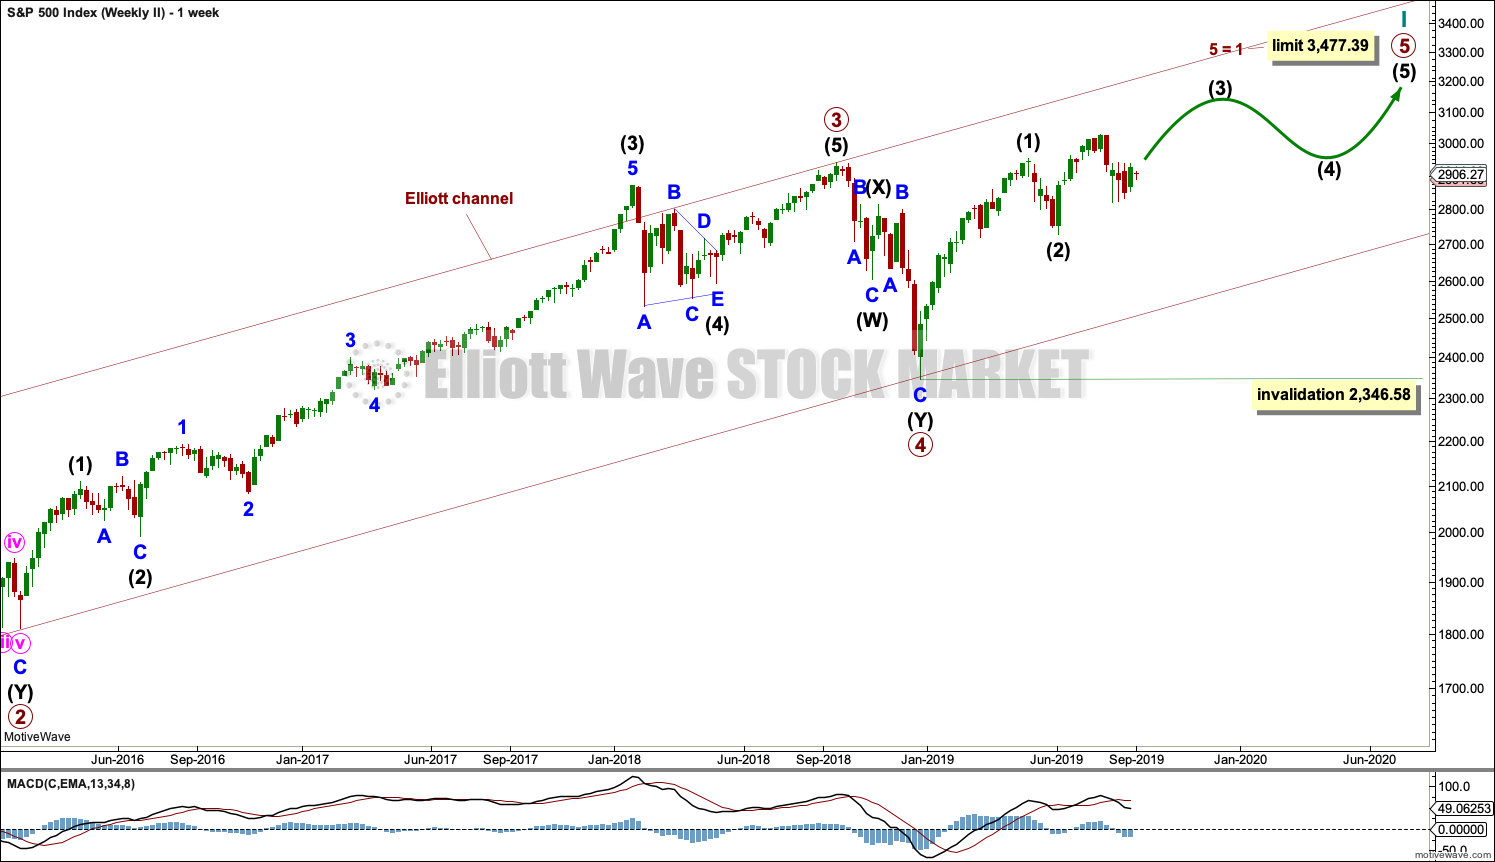
WEEKLY CHART
Click chart to enlarge.
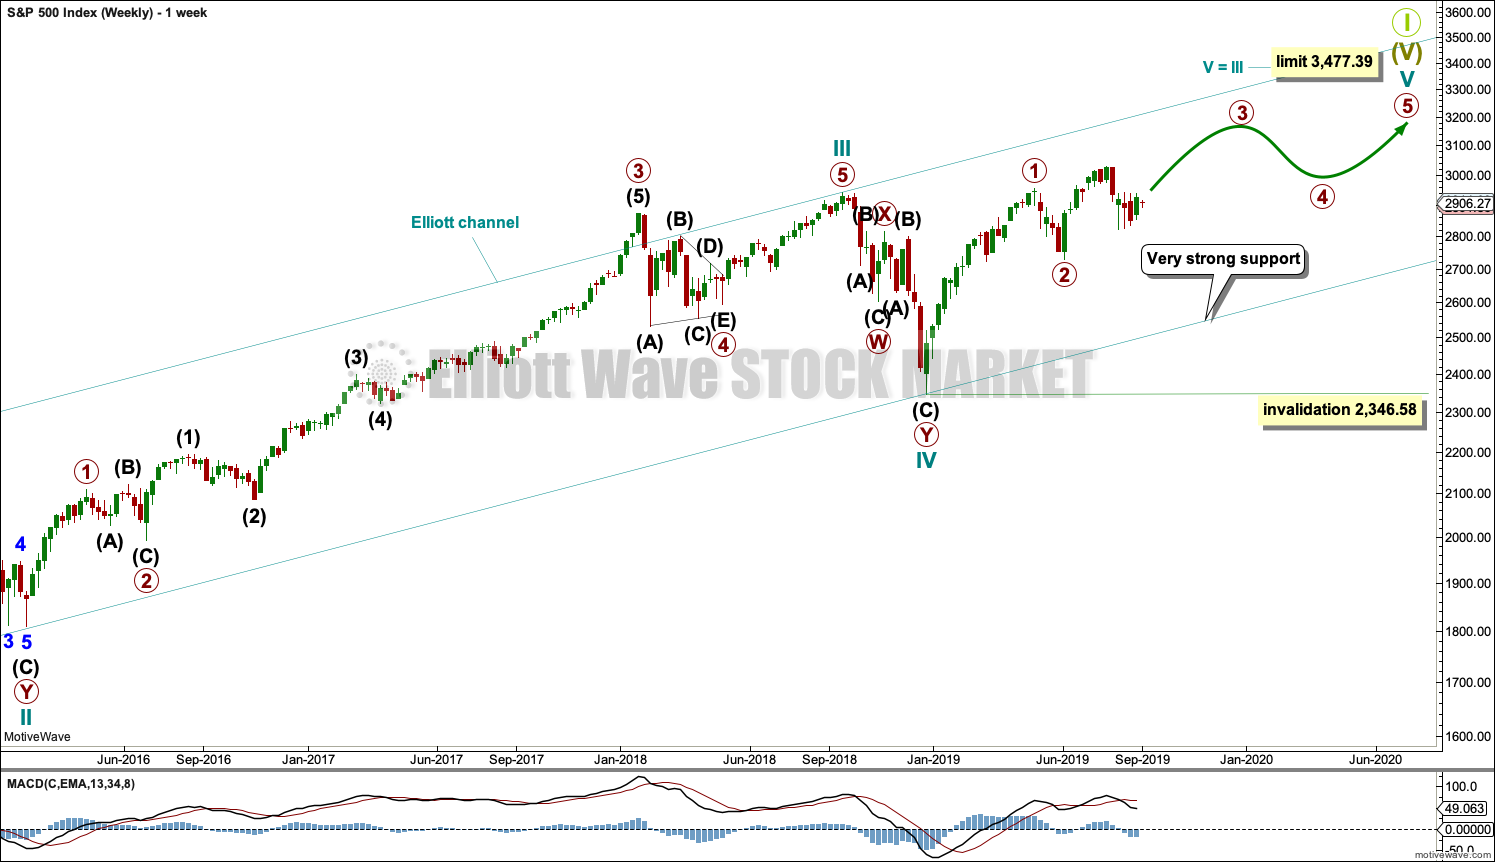
The basic Elliott wave structure consists of a five wave structure up followed by a three wave structure down (for a bull market). This wave count sees the bull market beginning in March 2009 as an incomplete five wave impulse and now within the last fifth wave, which is labelled cycle wave V. This impulse is best viewed on monthly charts. The weekly chart focusses on the end of it.
Elliott wave is fractal. This fifth wave labelled cycle wave V may end a larger fifth wave labelled Super Cycle wave (V), which may end a larger first wave labelled Grand Super Cycle wave I.
The teal Elliott channel is drawn using Elliott’s first technique about the impulse of Super Cycle wave (V). Draw the first trend line from the end of cycle wave I (off to the left of the chart, the weekly candlestick beginning 30th November 2014) to the end of cycle wave III, then place a parallel copy on the end of cycle wave II. This channel perfectly shows where cycle wave IV ended at support. The strongest portion of cycle wave III, the end of primary wave 3, overshoots the upper edge of the channel. This is a typical look for a third wave and suggests the channel is drawn correctly and the way the impulse is counted is correct.
Within Super Cycle wave (V), cycle wave III is shorter than cycle wave I. A core Elliott wave rule states that a third wave may never be the shortest. For this rule to be met in this instance, cycle wave V may not be longer in length than cycle wave III. This limit is at 3,477.39.
Cycle wave V may subdivide either as an impulse or an ending diagonal. Impulses are much more common. This main wave count expects that cycle wave V may be unfolding as an impulse.
The daily charts below will now focus on all of cycle wave V.
In historic analysis, two further monthly charts have been published that do not have a limit to upwards movement and are more bullish than this wave count. Members are encouraged to consider those possibilities (links below summary) alongside the wave counts presented on a daily and weekly basis.
MAIN DAILY CHART
Click chart to enlarge.
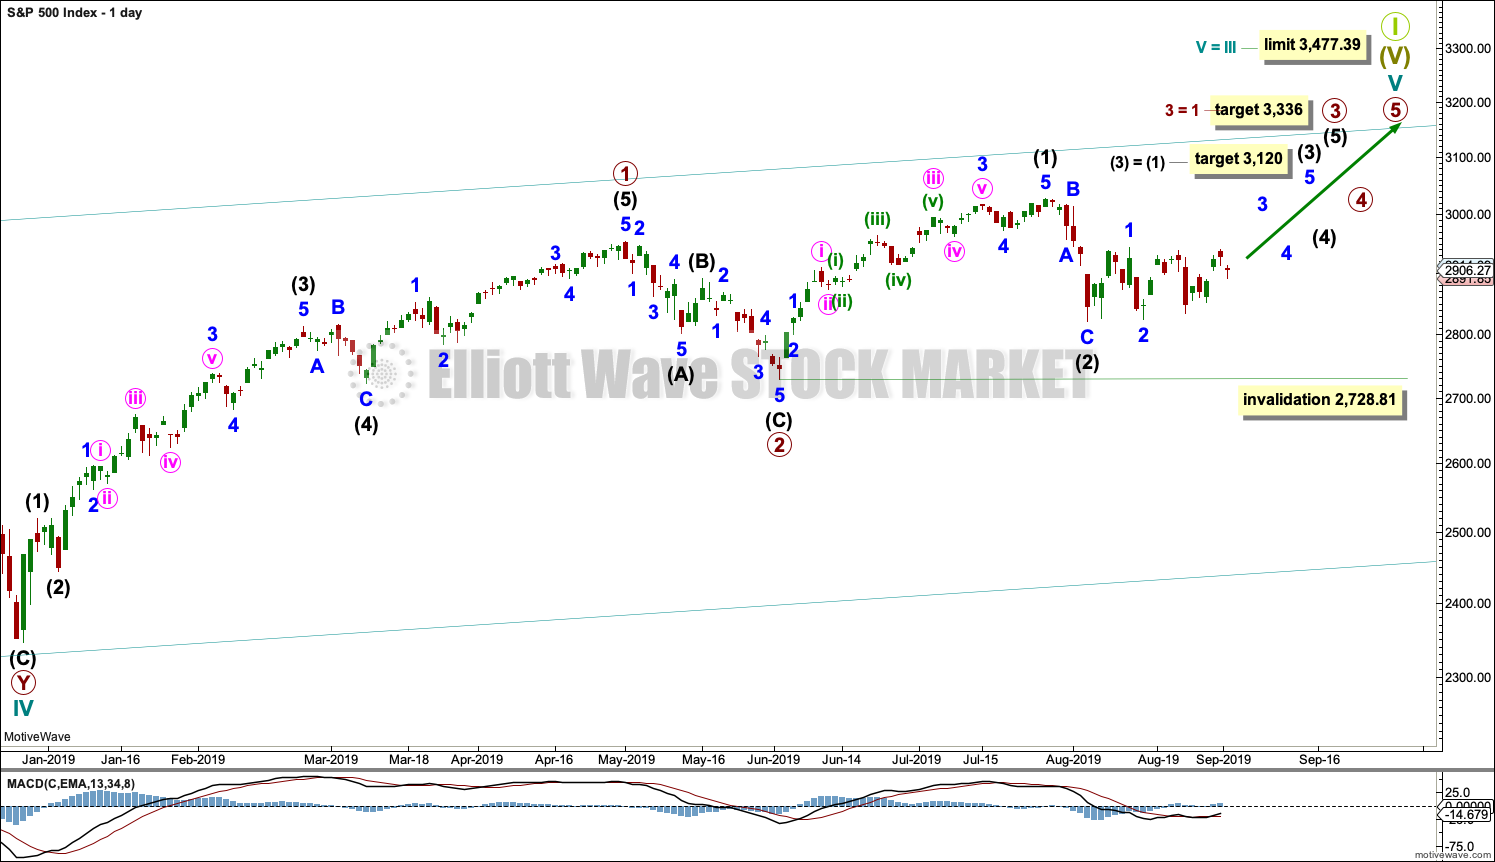
Cycle wave V is seen as an impulse for this wave count.
Within cycle wave V, primary waves 1 and 2 may be complete. Primary wave 3 may have begun.
Primary wave 3 may only subdivide as an impulse. Within primary wave 3, intermediate waves (1) and (2) may be complete.
It is also possible that intermediate wave (2) may be incomplete and sideways movement of the last 20 sessions may be minor wave B within a zigzag for intermediate wave (2). If intermediate wave (2) continues lower, then it may not move beyond the start of intermediate wave (1) below 2,728.81.
Intermediate wave (3) may have begun. Intermediate wave (3) may only subdivide as an impulse.
MAIN HOURLY CHART
Click chart to enlarge.
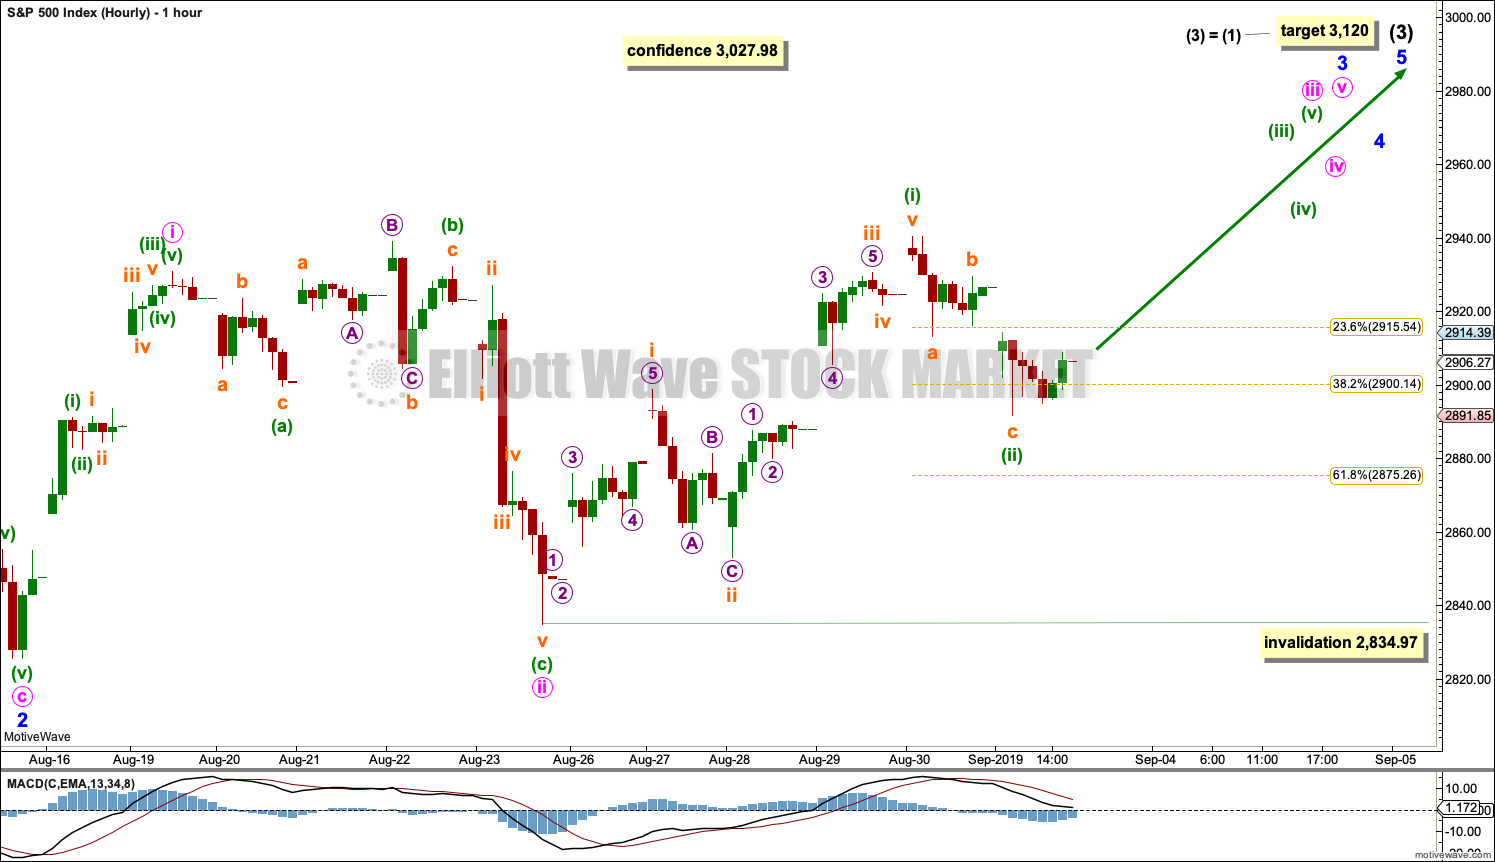
Intermediate wave (3) may only subdivide as a five wave impulse. Within intermediate wave (3), minor waves 1 and 2 may now be complete. Minor wave 3 may only subdivide as a five wave impulse.
Within minor wave 3, minute waves i and ii may be complete. Within minute wave iii, minuette wave (ii) may not move beyond the start of minuette wave (i) below 2,834.97. For the very short term, a little more confidence may be had in this wave count if price makes a new high tomorrow above 2,913.32 by any amount at any time frame. At that stage, the short-term expectation for more bearish wave counts could be invalidated.
Minute wave iii must move beyond the end of minute wave i. Minute wave iii must move far enough above the end of minute wave i to allow room for minute wave iv to unfold and remain above first wave price territory.
The next wave up for this wave count may then exhibit an increase in momentum as a third wave at five degrees unfolds.
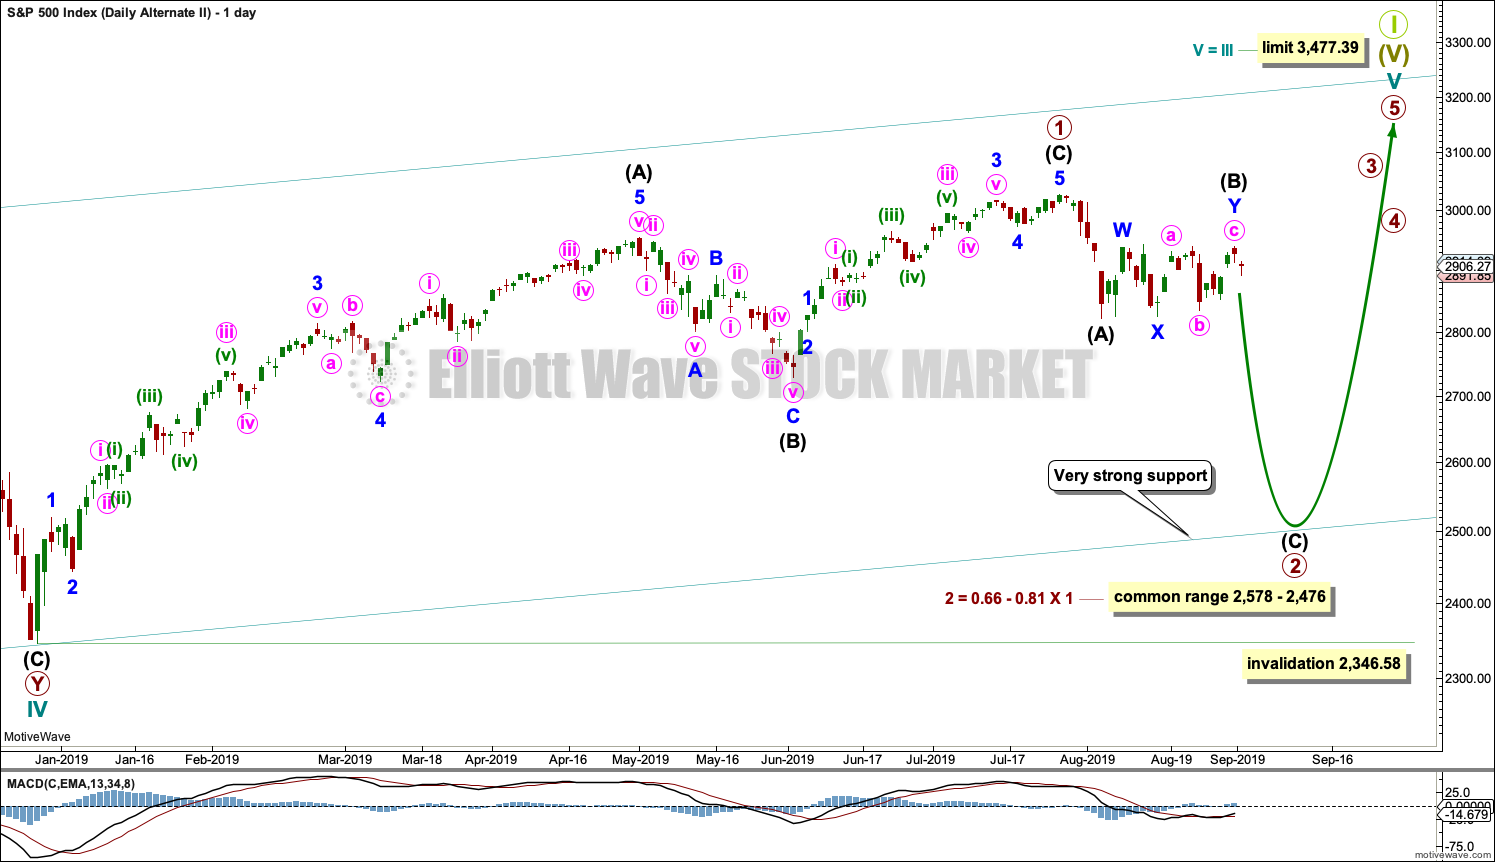
ALTERNATE DAILY CHART
Click chart to enlarge.
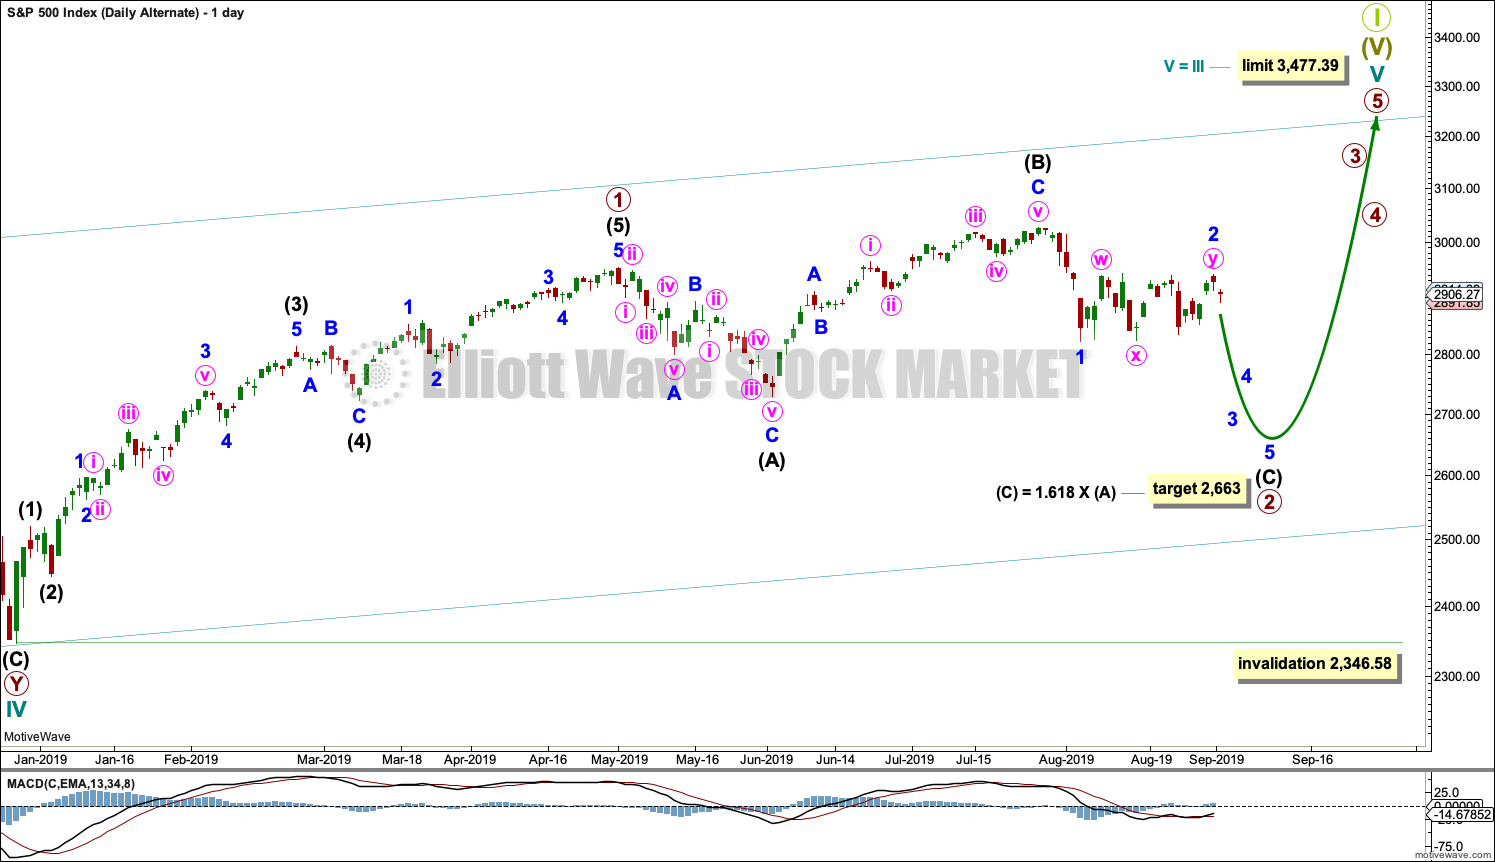
This first alternate wave count considers the possibility that cycle wave V may be unfolding as an impulse.
Cycle wave V must subdivide as a five wave motive structure. Within that five wave structure, primary wave 1 only may be complete.
Primary wave 2 may be unfolding as an expanded flat correction. These are reasonably common Elliott wave corrective structures. Flat corrections subdivide 3-3-5. Expanded flats have B waves which are 1.05 or more the length of their A waves. In this example for primary wave 2, intermediate wave (B) is a 1.33 length of intermediate wave (A). The target for intermediate wave (C) expects it to exhibit the most common Fibonacci Ratio to intermediate wave (A) within an expanded flat.
If price reaches the target at 2,663 and keeps falling, then the next target would be the 0.618 Fibonacci Ratio of primary wave 1 at 2,578.66.
Primary wave 2 may not move beyond the start of primary wave 1 below 2,346.58.
ALTERNATE HOURLY CHART
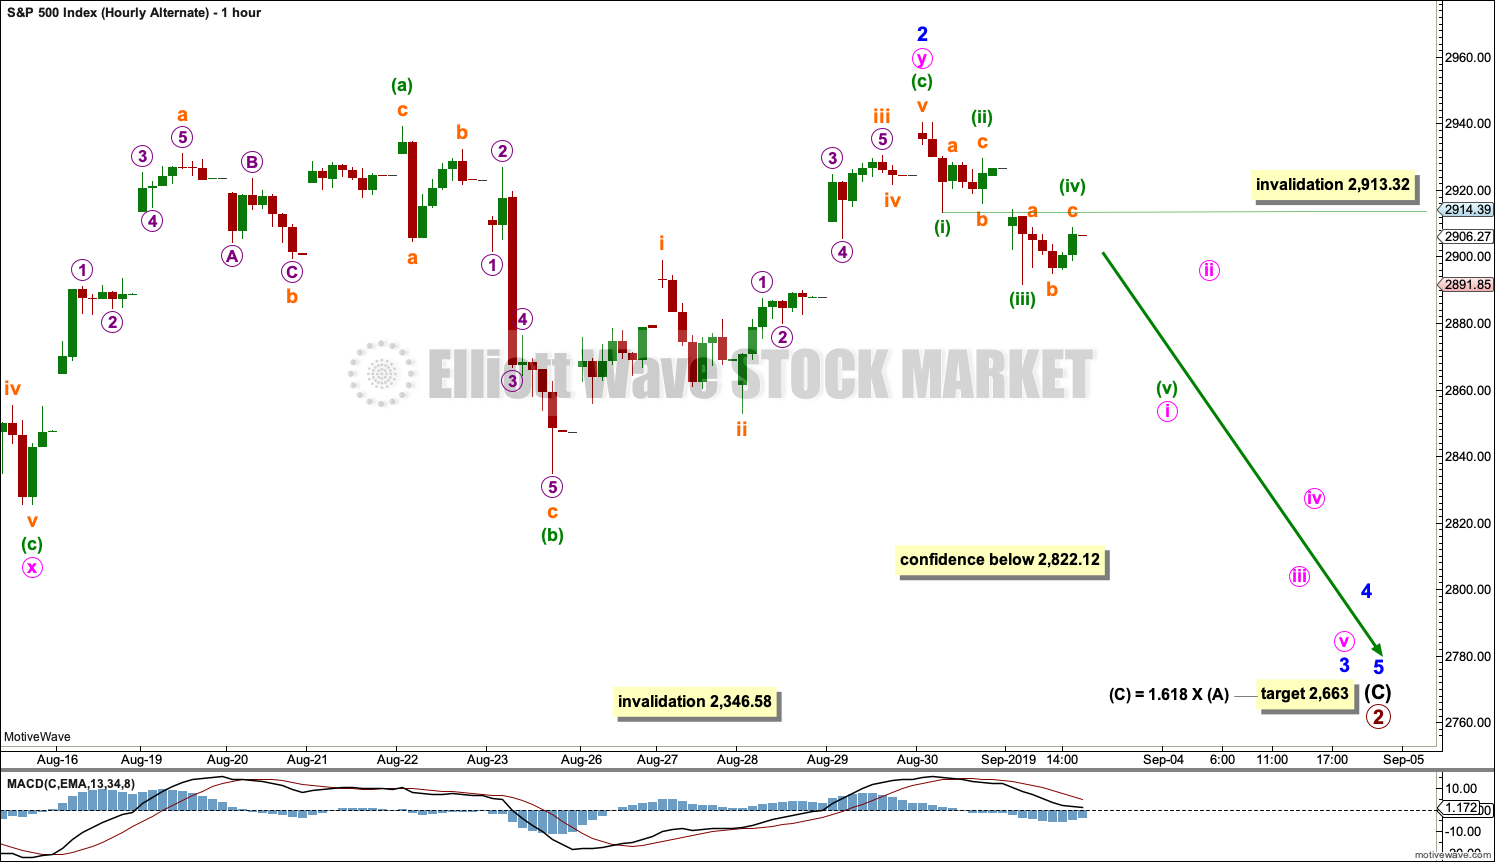
Click chart to enlarge.
Intermediate wave (C) must subdivide as a five wave motive structure for this wave count. Minor waves 1 and 2 may be complete within intermediate wave (C).
Minor wave 2 may have ended as a double combination: zigzag – X – flat.
Minor wave 3 may have begun and may only subdivide as an impulse. Minute wave i within minor wave 3 may be incomplete. Within minute wave i, minuette wave (iv) may not move into minuette wave (i) price territory above 2,913.32.
SECOND ALTERNATE DAILY CHART
Click chart to enlarge.
This second alternate daily chart considers the other structural possibility for cycle wave V, that of an ending diagonal. Ending diagonals in fifth wave positions are not as common as impulses; for this reason, this wave count will remain an alternate until an impulse for cycle wave V is invalidated.
All sub-waves within an ending diagonal must subdivide as zigzags. Primary wave 1 may have been complete as a zigzag at the last all time high on the 26th of July.
Primary wave 2 may be continuing lower as a zigzag. Within the zigzag, intermediate wave (B) may now be a complete double combination.
Within diagonals, sub-waves 2 and 4 are normally very deep, ending within a range of 0.66 to 0.81 the prior wave. This range for primary wave 2 is from 2,578 to 2,476. Primary wave 2 may possibly come as low as the lower edge of the teal channel, which is copied over from the weekly chart.
Primary wave 2 may not move beyond the start of primary wave 1 below 2,346.58.
SECOND ALTERNATE HOURLY CHART
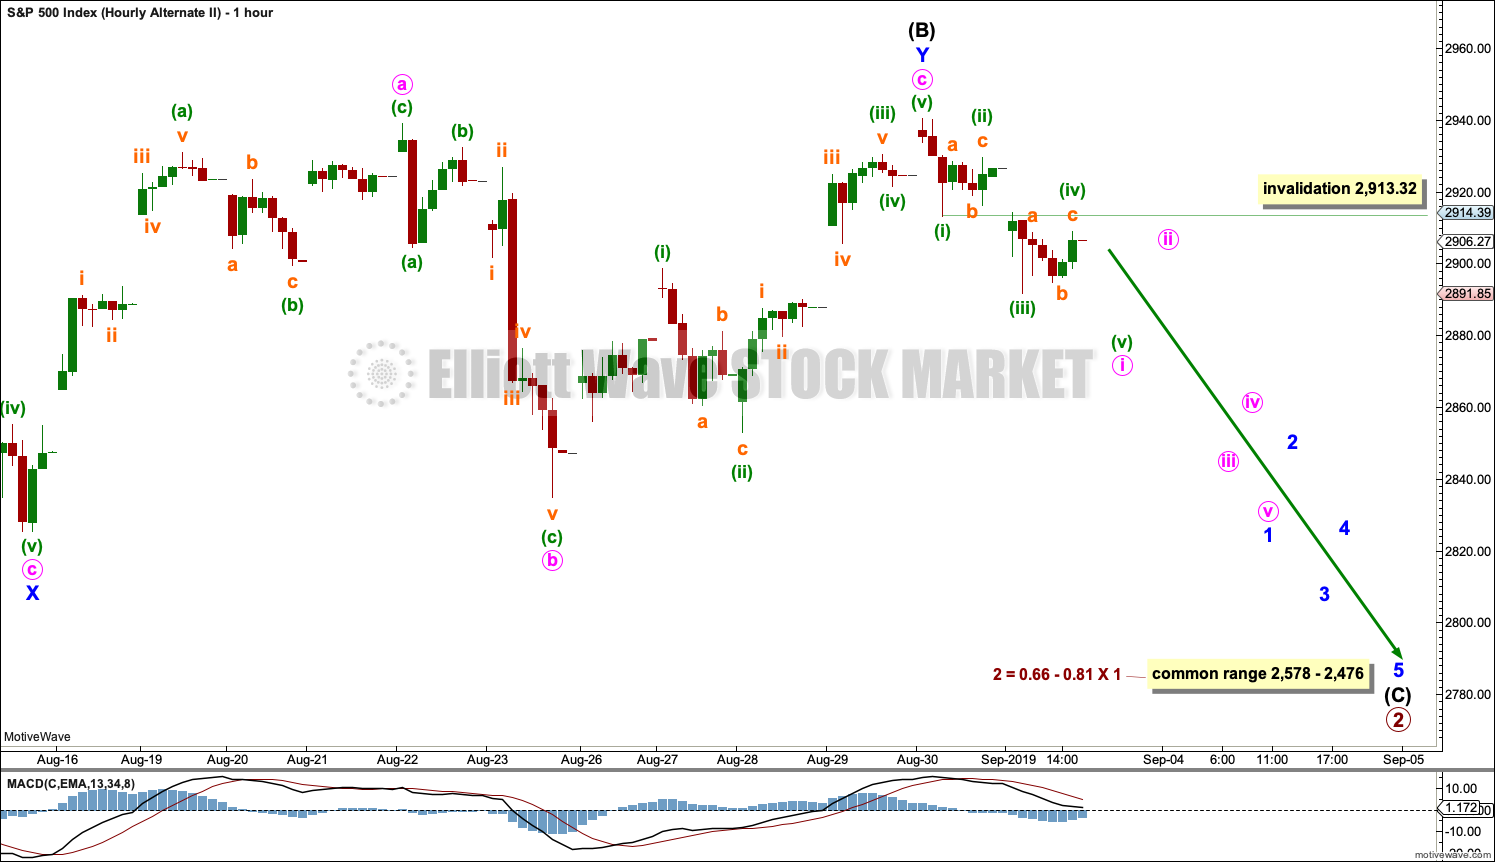
Click chart to enlarge.
Intermediate wave (B) within the zigzag of primary wave 2 may now be a complete double combination: zigzag – X – flat.
Intermediate wave (C) downwards may have begun. Intermediate wave (C) must subdivide as a five wave motive structure. Within intermediate wave (C), minute wave i may be an incomplete impulse. Within minute wave i, minuette wave (iv) may not move into minuette wave (i) price territory above 2,913.32.
SECOND WAVE COUNT
WEEKLY CHART
Click chart to enlarge.
This weekly chart is almost identical to the first weekly chart, with the sole exception being the degree of labelling.
This weekly chart moves the degree of labelling for the impulse beginning in March 2009 all down one degree. This difference is best viewed on monthly charts.
The impulse is still viewed as nearing an end; a fifth wave is still seen as needing to complete higher. This wave count labels it primary wave 5.
TECHNICAL ANALYSIS
WEEKLY CHART
Click chart to enlarge. Chart courtesy of StockCharts.com.
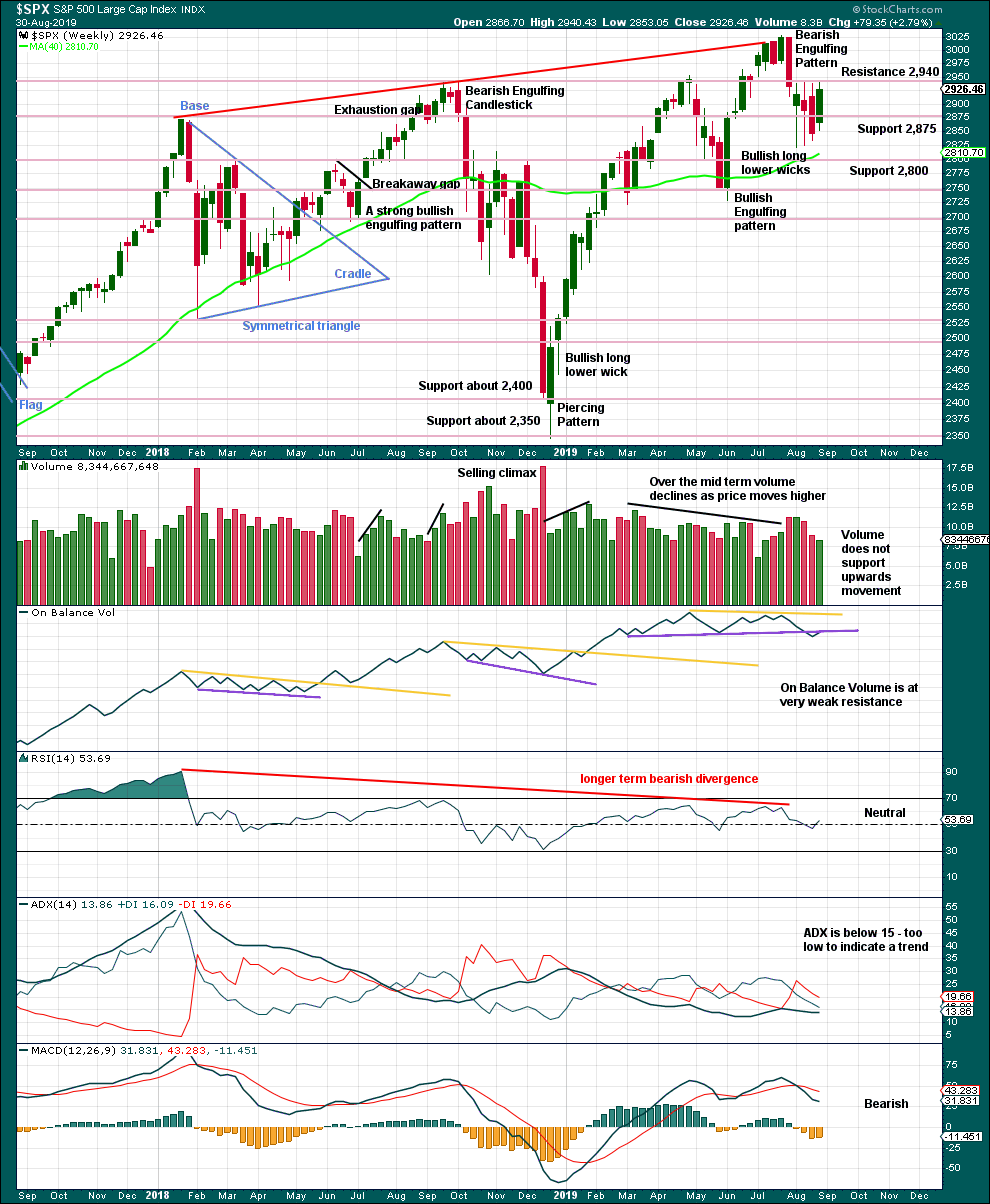
Price remains range bound with resistance about 2,940 and support about 2,920.
The larger trend is up from the low in December 2018, with a series of higher highs and higher lows. This upwards trend should be assumed to remain while the last swing low at 2,728.81 remains intact.
If On Balance Volume breaks back above the resistance line, then the weak bearish signal would be negated and the line would need to be redrawn.
DAILY CHART
Click chart to enlarge. Chart courtesy of StockCharts.com.
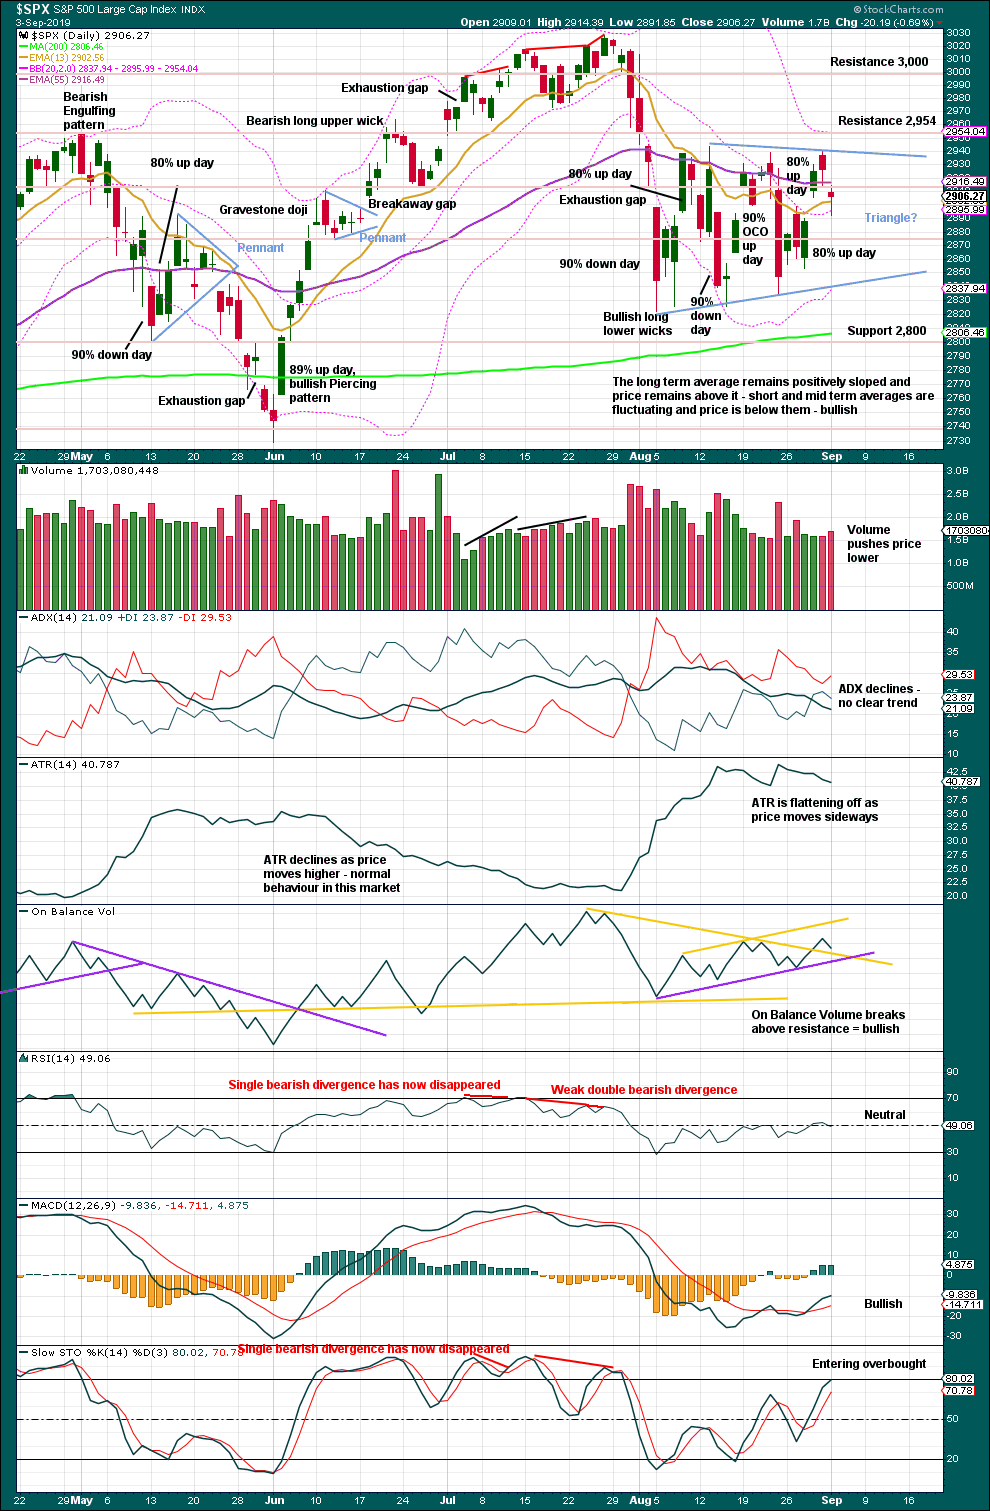
The last low of the 15th of August was preceded immediately by a 90% downward day and followed immediately by a 90% OCO (Operating Companies Only) up day. This is a pattern commonly found at major lows, and it indicates a 180 degree shift in sentiment from bearish to bullish. This favours the main Elliott wave count.
Now the next low of the 23rd of August has been followed by two back to back 80% up days. This too is very bullish and favours the main Elliott wave count.
The classic triangle no longer has a very clear look. The trend lines do not converge at a normal rate. This pattern is weak.
On Balance Volume gives a clear bullish signal. This supports the main Elliott wave count.
BREADTH – AD LINE
WEEKLY CHART
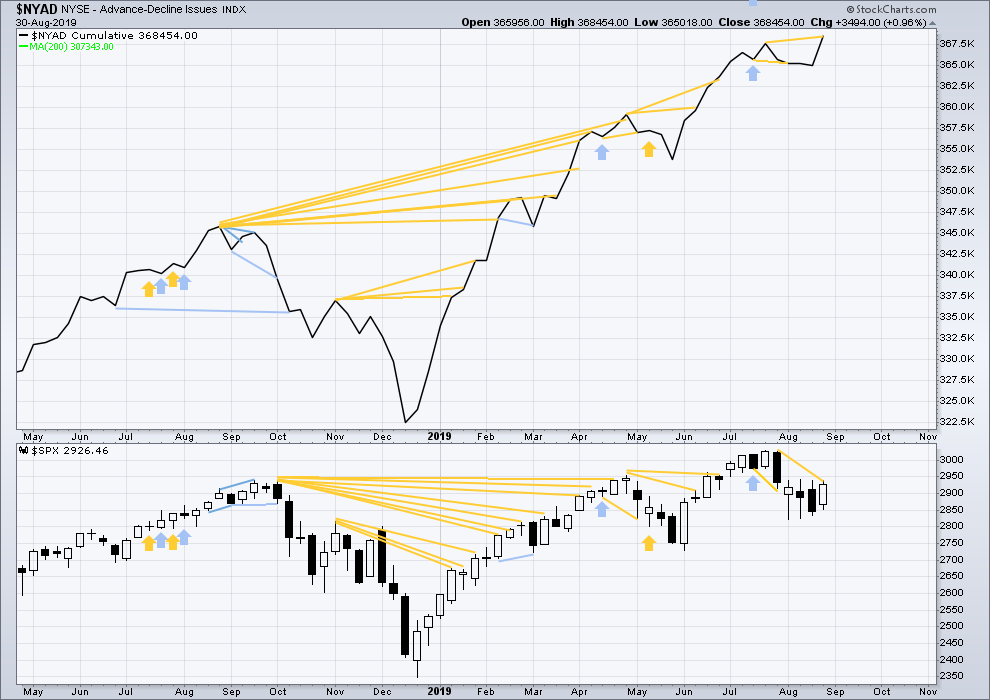
Click chart to enlarge. Chart courtesy of StockCharts.com. So that colour blind members are included, bearish signals
will be noted with blue and bullish signals with yellow.
Bear markets from the Great Depression and onwards have been preceded by an average minimum of 4 months divergence between price and the AD line with only two exceptions in 1946 and 1976. With the AD line making new all time highs again last week, the end of this bull market and the start of a new bear market is very likely a minimum of 4 months away, which is the end of December 2019.
In all bear markets in the last 90 years there is some positive correlation (0.6022) between the length of bearish divergence and the depth of the following bear market. No to little divergence is correlated with more shallow bear markets. Longer divergence is correlated with deeper bear markets.
If a bear market does develop here, it comes after no bearish divergence. It would therefore more likely be shallow.
Last week both price and the AD line have moved higher.
The AD line makes a new all time high. This is a very bullish signal and very strongly supports the main Elliott wave count.
DAILY CHART
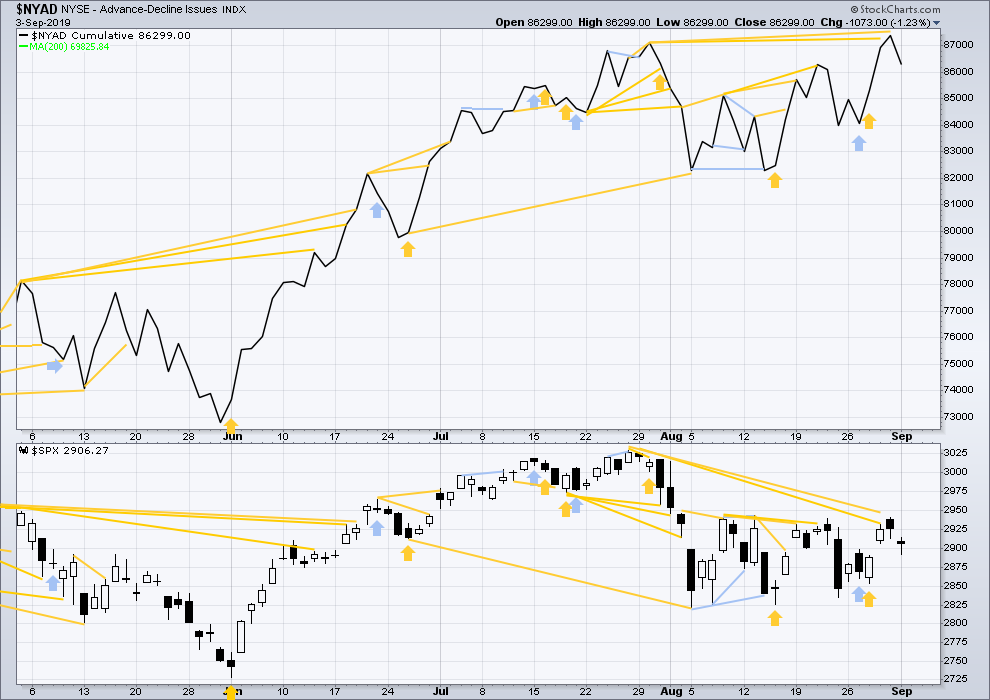
Click chart to enlarge. Chart courtesy of StockCharts.com. So that colour blind members are included, bearish signals
will be noted with blue and bullish signals with yellow.
Breadth should be read as a leading indicator.
The AD line makes another new all time high on Friday. This is a very bullish signal and strongly favours the main Elliott wave count.
Today both price and the AD line have moved lower. Neither have made new short-term swing lows. There is no new divergence.
VOLATILITY – INVERTED VIX CHART
WEEKLY CHART
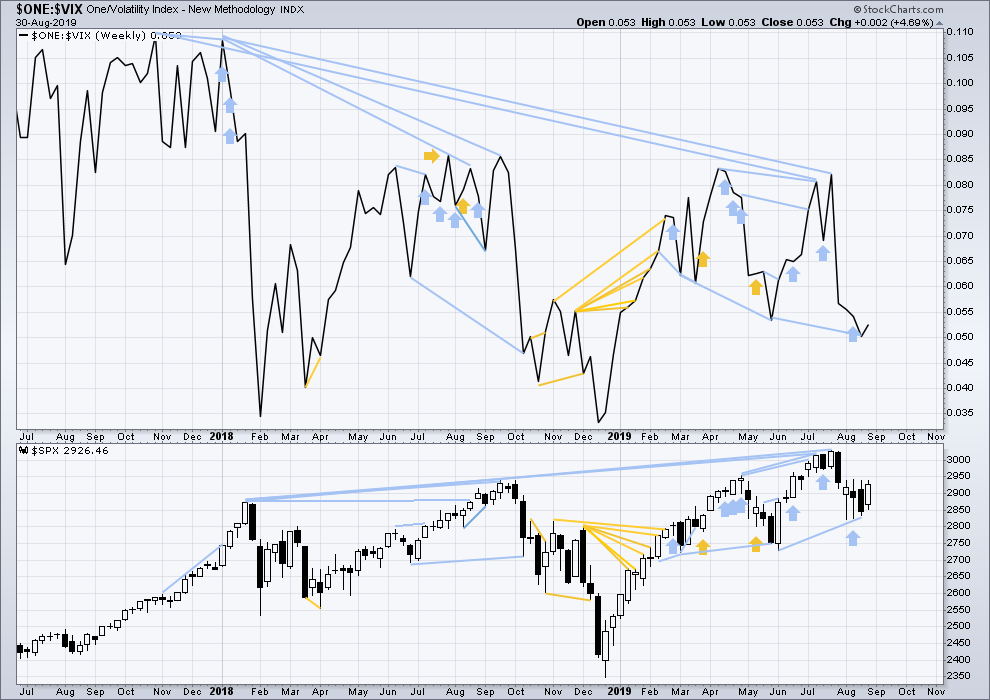
Click chart to enlarge. Chart courtesy of StockCharts.com. So that colour blind members are included, bearish signals
will be noted with blue and bullish signals with yellow.
The all time high for inverted VIX (which is the same as the low for VIX) was on 30th October 2017. There is now nearly one year and nine months of bearish divergence between price and inverted VIX.
The rise in price is not coming with a normal corresponding decline in VIX; VIX remains elevated. This long-term divergence is bearish and may yet develop further as the bull market matures.
This divergence may be an early warning, a part of the process of a top developing that may take years. It may not be useful in timing a trend change.
Last week both price and inverted VIX have moved higher. There is no new divergence.
DAILY CHART
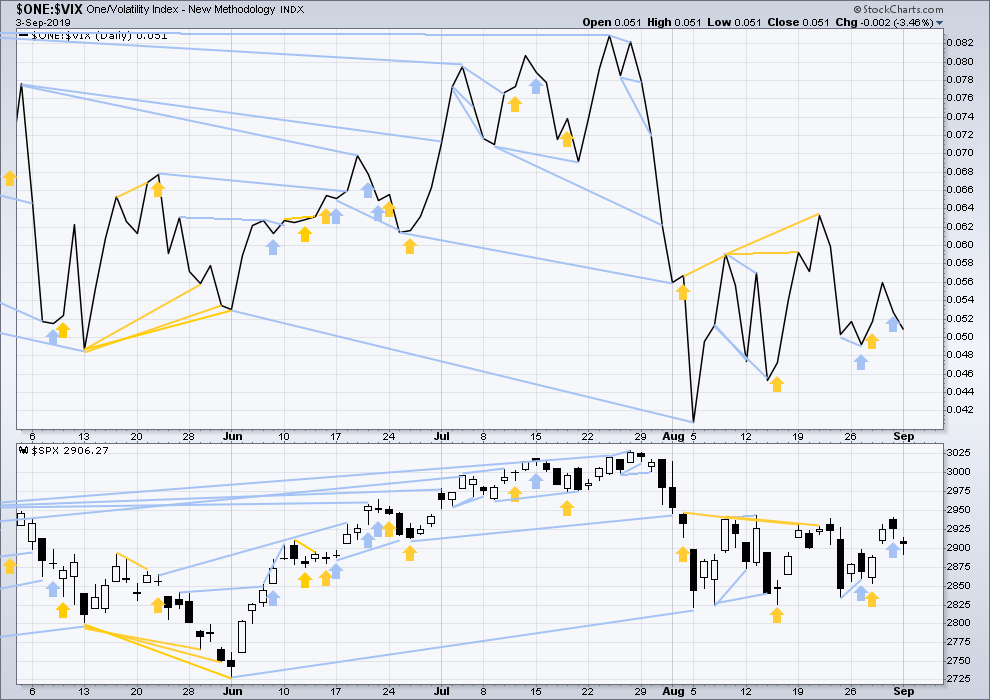
Click chart to enlarge. Chart courtesy of StockCharts.com. So that colour blind members are included, bearish signals
will be noted with blue and bullish signals with yellow.
Bearish divergence noted on Friday for the short term has now been followed by a downwards day. This divergence may be resolved here.
Today both inverted VIX and price have moved lower. Neither have made new short-term swing lows. There is no new divergence.
DOW THEORY
Dow Theory confirmed a bear market in December 2018. This does not necessarily mean a bear market at Grand Super Cycle degree though; Dow Theory makes no comment on Elliott wave counts. On the 25th of August 2015 Dow Theory also confirmed a bear market. The Elliott wave count sees that as part of cycle wave II. After Dow Theory confirmation of a bear market in August 2015, price went on to make new all time highs and the bull market continued.
DJIA: 23,344.52 – a close on the 19th of December at 23,284.97 confirms a bear market.
DJT: 9,806.79 – price has closed below this point on the 13th of December.
S&P500: 2,532.69 – a close on the 19th of December at 2,506.96 provides support to a bear market conclusion.
Nasdaq: 6,630.67 – a close on the 19th of December at 6,618.86 provides support to a bear market conclusion.
With all the indices having moved higher following a Dow Theory bear market confirmation, Dow Theory would confirm a bull market if the following highs are made:
DJIA: 26,951.81 – a close above this point has been made on the 3rd of July 2019.
DJT: 11,623.58 – to date DJT has failed to confirm an ongoing bull market.
S&P500: 2,940.91 – a close above this point was made on the 29th of April 2019.
Nasdaq: 8,133.30 – a close above this point was made on the 26th of April 2019.
Published @ 09:50 p.m. EST.
—
Careful risk management protects your trading account(s).
Follow my two Golden Rules:
1. Always trade with stops.
2. Risk only 1-5% of equity on any one trade.
—
New updates to this analysis are in bold.
Hourly chart updated:
I bailed on some shorts, got long QQQ, took a bearish hedge of my overhead TLT butterfly by putting on a bearish put debit spread in TLT.
Once again (we have been here before!!!) things are looking rather bullish in the major markets (well, except RUT, which is a concern). But will price break out, or are we gapping down tomorrow and selling off from there…again? Future ain’t written…but the banksters may know, because IMO all these gaps are their overnight thin market manipulations, and I’ve presumed it’s been to enable them to distribute. But maybe…it’s been to enable them to accumulate. We will see…
Lara, can you comment on this as a viable ending diagonal structure?
Sure.
It’s one of the possibilities I keep charted. It has a limit.
There are two problems with it:
1. The AD line has zero divergence with price, this wave count expects the bull market to end like that, with no divergence. That has happened before and so can happen again, but it’s rare so the probability is very low. It means a relatively shallow and brief bear market may follow.
2. The lower trend line isn’t nicely showing where pullbacks within P5 are finding support, its overshot. That can happen, but its a much more normal look for diagonals to adhere perfectly to their trend lines.
Thanks!
Keep your eye on bonds. They “should be” turning back down if there’s going to be a real ongoing stock rally here. So far, nope. Holding flat just below resistance. But if they start dropping this week, maybe SPX blows out of this range.
and gold keeps making higher highs…
Yup. Here’s my GLD chart. The green dashed lines are different Fibonacci fitted projections, each starting at the point in time I projected them. The lowest stalled the market. Price is at the lowest of new ones. Etc. I have fairly high confidence that in the end, one of those will be about the pivot level for the turn of this overall 4 months push up, because I find that GLD has great Fibonacci structure.
IWM a=c closes the gap
So I have and Algo that trades ZN and ES, it has not had an ES position for weeks. It bought ES yesterday at close and sold today’s open
the algo re entered the ES positions, it smells a bull too
Gap and go…or gap and crap?
Kevin – sbux going to start paying ?
It’s a start Fred! And a nice start, given it’s a sharp move down on an up day. Hopefully, it’ll motivate some profit taking here.
I’m in the black a little now but the price is still too high for profit for me at expiry (Sept 20). I need below 92.8 to make any money, and I peak at 90. I’m nicely profitable on anything below that. Fall mountain…(just don’t fall on me!).
Check advancing issues over decliners. I think you will see a bullish position at this point of the trading day. The close is what matters of course. But right now, it is looking bullish.
I might add that at this point in the trading day, the McClellan Oscillator is at a new swing high. This is very bullish as we have not yet even really begun the advance or broken up out of the trading range. If we break upwards, we are looking at a 140+ point SPX rally based on classic TA. That would put us around 3080, well on our way to the first target.
I think it is very helpful to assess the M.O. in conjunction with new 52 week highs and lows. The slightly positive reading yesterday narrowly averted yet another H.O. observation…
Yes, A/D for SPX is 418/82 at the moment. Very strong for this point in the day.
Here’s my hourly SPX view though. Obviously significant resistance overhead, including that down trend line. And very bullish conditions have been a theme of these pops up in this range…followed a day or two later by a slamming sell off! If the price can break the range highs, could be an explosion to the upside. But keep your twitter ear open…
tweets this morning threatening the expansion of “trade war” to Europe, and indicating a China deal is absolutely nowhere in sight. Mildly surprising the market has no reaction, but maybe twitter raging is being increasingly tuned out.
#1
Boy oh boy. I tell you. Give a guy an inch and watch them take a mile. You got me good buddy.
Wait for an inch?
As Senna once said, “if I see an opening, I go!”.